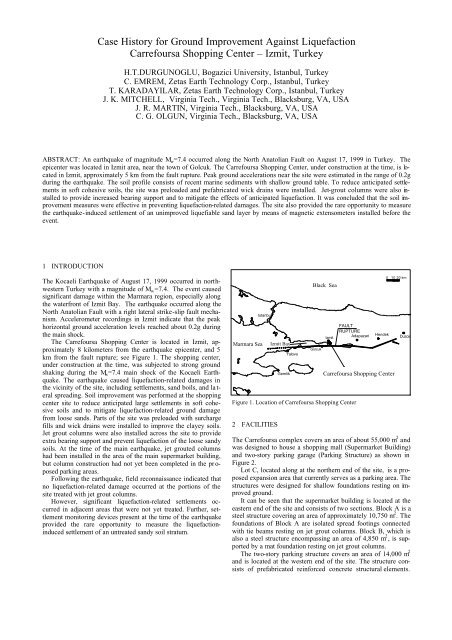
Case History for Ground Improvement Against Liquefaction ...
Case History for Ground Improvement Against Liquefaction ...
Case History for Ground Improvement Against Liquefaction ...

You also want an ePaper? Increase the reach of your titles
YUMPU automatically turns print PDFs into web optimized ePapers that Google loves.
Figure 3. Typical geotechnical sectionA more detailed analysis, using the CPT, was made by Durgunoglu(1999) using the method suggested by Stark and Olson(1995).For the analysis, peak accelerations in rock were estimatedusing attenuation relationships based on distance from the NorthAnatolian Fault. Magnitude was determined from prior seismologicalinvestigations that assumed a characteristic earthquake <strong>for</strong>the area. Peak accelerations at the ground surface were estimatedby modifying the bedrock accelerations using the proceduregiven by Idriss (1998) <strong>for</strong> soft soil sites. Estimated cyclic stressratios in the loose sand layer were found to be as high as 0.5 <strong>for</strong>the selected design ground motions of M=7.5 and 0.5g. It wasestimated that the critical limit values of corrected tip resistanceagainst liquefaction were q c1 =15 MPa <strong>for</strong> clean sands andq c1 =11.5 MPa <strong>for</strong> silty sands. To relate the fine content of soillayers with the friction ratio, the correlation chart suggested bySuzuki (1995) was utilized. From this method, the zones with R f< 1% and q c1
tional soil stiffness and reduction of liquefaction potential. TheParking Structure area and Lot C were surcharged with a 3.0 mhigh sand fill. Wick drains 20 m long were installed at 2.5 mspacings <strong>for</strong> the Parking Structure, and at a 3.0 m spacing <strong>for</strong> LotC. Magnetic extensometers, with a series of circular magneticanchors, were installed to monitor settlements at differentdepths. At the Parking Structure area, the surcharge fill had beenremoved and jet grout column construction has begun, when themain shock of the Kocaeli Earthquake M w =7.4 occurred.Jet grout columns were designed to be installed throughoutthe parking structure in primary and secondary grids to provideblanket treatment <strong>for</strong> the area. The primary grid consisted of 0.6m diameter jet grout columns to be installed with a 2.2 m centerto-centerspacing under the footings (four columns per footing ingeneral) and with an 8.0 m center-to-center spacing under theslabs. The columns extended from the ground surface to a depthof 9 m into the lower medium clay stratum. The secondary gridwith a 4.0 m center-to-center spacing included shorter columnsthat penetrated only the liquefiable sand layer, which is about 3m thick in this area of the site. Similar short jet grout columnswith a 2.0 m center-to-center spacing were also designed to beinstalled to mitigate the liquefaction risk <strong>for</strong> Lot C.For quality control of jet grout column construction, in-situpile integrity, pull-out tests, column diameter measurements, andunconfined compression strength tests on core samples were per<strong>for</strong>med.Compressive strength values varied between 1.4 MPaand 6.7 MPa with an average value of 2.9 MPa <strong>for</strong> the samplesobtained from 7 day-old jet grout columns. Other specific s of thejet grout column construction are provided in Table 1.Table 1. Details of jet grout column constructionJet grout systemJet-1Number of nozzles 2Nozzle size2 mmRods lifting speed50 cm/minRods rotation speed20 rev/minInjection pressure450 barWater/cement ratio 1/16 OBSERVED FIELD PERFORMANCE AND STATUS OFCONSTRUCTION DURING THE M W =7.4 KOCAELIEARTHQUAKE6.1 Construction StatusTo provide a clearer understanding of the findings of the fieldreconnaissance, the status of the constructio n of the shoppingcenter facilities at the time of the 17 August 1999 earthquake issummarized below. While reviewing these notes, it may be helpfulto examine Figure 2:− At supermarket building Block A, subsoil improvement andfoundation construction had been completed and erection ofsteel framework was almost completed.− At supermarket building Block B, subsoil improvement andfoundation construction had been completed while the erectionof steel framework was underway.− At the parking structure section, the preloading fill was removedand subsoil improvement with jet grout column constructionwas partially completed.− At Lot C, the preloading fill was still in place and no jet groutcolumns were installed yet.6.2 Earthquake-Induced SettlementsVisual field inspections following the earthquake indicated thatno structural damage occurred in the Supermarket Building(Block A and B) and no noticeable settlements or ground damageswere observed anywhere at the site except in the Lot C areawhere the surcharge fill was still in place and part of parkingstructure area that were not yet treated. The ground surface in theParking Structure area was completely inundated with water followingmorning of the earthquake. Both Lot C and the ParkingStructure area were treated with wick drains that penetrated theunderlying sand stratum. However, following the removal ofsurcharge fill, settlement observation was ceased <strong>for</strong> the parkingstructure zone and there<strong>for</strong>e it was not possible to monitor theinduced settlements by the earthquake <strong>for</strong> this section.Following field inspection, it was concluded that the observedsurface water originated from the wick drains due to earthquakeinducedpore pressure build-up in the sand layer. Three settlementmeasuring devices were in place at Lot C zone during theearthquake. By comparing pre- and post-earthquake readings, theearthquake-induced settlement of the sand layer could be closelydetermined. A typical records from one of the three magnetic extensometersinstalled at Lot C, are presented in Figure 4.settlement (cm)75706560555045403530252015105020.07.99s 2=9.0cm27.07.99s 3=5.0cm03.08.99ME-7 SC-710.08.9917.08.99Anchor 1EQ-M7.424.08.99Anchor 231.08.99Anchor 3Anchors 4-614.09.99dateFigure 4. Time dependent settlement readings from magnetic extensometerat Lot CSimplified methods of analyses were proposed in the literature<strong>for</strong> estimating settlements in saturated sand deposits subjectedto earthquake shaking. Tokimatsu and Seed (1987) andIshihara (1993) have developed empirical charts to estimate thevertical settlement subsequent to an earthquake.Each of the three installed magnetic extensometers consistedof five magnetic anchors installed at five-meter vertical intervals.During the quality control tests, 10 CPT tests were per<strong>for</strong>med atLot C area prior to jet grouting on 30/09/2001. CPTs 8, 9 and 10were located closest to settlement columns 7, 9, and 8 respectively.The variation of tip resistance (q c ), and friction ratio (R f )values with depth <strong>for</strong> a typical CPT data is shown in Figure 5.The estimated sand layer thickness <strong>for</strong> each CPT location rangedfrom 1.1 m to 1.5 m based on the the soil classification proceduredeveloped by Roberston (1988). To estimate the earthquake-inducedsettlement within the untreated sand layer, thedifference between the settlement values recorded by anchors 2and 3 were calculated. The elevation of anchors 2 and 3 do notcorrespond to the top and bottom of the sand layers (the anchorswere installed in clayey and silty soil layers located about 2.5 mabove and 1 m below the sand layer, respectively). There<strong>for</strong>e,the estimated earthquake-induced settlements in the sand shouldbe considered maximum values, as it is conceivable that a portionof the measured settlements may have occurred within theover- and underlying finer-grained soils. It is believed however,that the vast majority of the settlements measured between anchors2 and 3 were from the sand layer. Based on this methodology,it is estimated that up to 4.0 to 4.5 cm of earthquakeinducedsettlement, corresponding to about 2.9 to 3.6% volumetricstrain, respectively, occurred in the sand stratum.
0q c (MPa), Rf (%)0 2 4 6 8 1010.08.0Tokimatsu&Seed, 1987Ishihara, 1993 1:11234CPT-10estimated settlement (cm)6.04.02.0depth (m)56q cR f0.00.0 2.0 4.0 6.0 8.0 10.0observed settlement (cm)7h=1.3mFigure 6. Comparison of estimated settlements8910Figure 5. Typical CPT data from September, 1999 at Lot C, after themain shock, be<strong>for</strong>e the construction of jet grout columnsObservations immediately following the earthquake of August17, 1999 revealed that, within and/or in the close vicinity ofthe Carrefoursa site neither sand boils, nor any surficial grounddamage occurred. Ishihara (1985) examined the soil conditionsassociated with various liquefaction-related damage reports andproduced estimates of the thickness of the overlying layer requiredto prevent level-ground liquefaction-related damage asshown in Figure 7. Considering that approximately a 6.0For purposes of comparison, existing settlement methodsfrom the literature were used to assess predictive capability asdetermined by how closely they predicted the actual settlements.In using the CPT data <strong>for</strong> this purpose, the thin layer influencewas considered as recommended by Robertson and Fear (1995),and a correction factor <strong>for</strong> cone resistance was also used in thecalculations. Based on this methodology, Ishihara's procedure(1993), estimated about 4.8 cm of settlement. In order to comparethe results from two in-situ tests, SPT blow count valuesobtained from boreholes made at Lot C are utilized and, Tokimatsuand Seed’s procedure yielded an estimated average settlementof 4.6 cm. The results are summarized in Table 2 andplotted in Figure 6 <strong>for</strong> the purpose of comparison. For this site, itcan be seen that both Ishihara’s method utilizing CPT data andTokimatsu and Seed’s method utilizing SPT data provided closeestimates <strong>for</strong> the observed settlements.Table 2. Comparison of estimated settlementsProcedure Predicted Settlement(average value- cm)Ishihara (1993) 4.8Tokimatsu and4.6Seed (1987)6.3 Earthquake-Induced <strong>Ground</strong> DamageObserved Settlement(averagevalue- cm)4.2<strong>Liquefaction</strong> is often accompanied by the development of sandboils. However the development of sand boils is a complicatedand somewhat random process depending on the magnitude ofthe excess pore pressure; the thickness, density, and depth of thezone of excess pore pressure; and the thickness, permeability,and intactness of any soil layers that overlay the zone of high excesspore pressure (Kramer, 1996).Variation in sandlayer thicknessacrosss the siteFigure 7. Conditions <strong>for</strong> occurrence and nonoccurrence of grounddamage (After Ishihara, 1985; Adapted from Kramer, 1996)m thick layer of “unliquefiable soil” overlays the 1.5 m thick liquefiablesand layer at Lot C section, non-occurrence of surfacemanifestation is expected according to Ishihara as shown withthe full circle in Figure 7.Considering that the liquefiable sand layer thickness reachesto 4.0 m, Carrefoursa site is still within the “no ground damage”zone as presented by the open circle on Figure 7. It is also in<strong>for</strong>mativeto note that Lot C and partly parking structure sectionswere the only area at the complex that had not been improvedwith jet-grouted columns prior to the earthquake. All other areashad been improved with both primary and secondary grids ofgrouted columns to reduce liquefaction susceptibility. Based onthe differences in per<strong>for</strong>mance between the unimproved and theadjacent improved areas, it has been demonstrated that the jetgroutedcolumns have been effective in reducing liquefaction
susceptibility and liquefaction-related settlements of the sandlayer.7 CONCLUDING REMARKSThe principal conclusions drawn from this study are:1. Conditions appropriate <strong>for</strong> liquefaction were present at theCarrefoursa Shopping Center site. A loose sand layer 3.0 m inthickness was found to be liquefiable under relatively lowlevels of accelerations.2. During the August 1999 earthquake, the Supermarket Buildingsection of the site were treated with jet grout columnswhile Lot C and partly parking structure sections were untreated.This provided an opportunity to observe the per<strong>for</strong> m-ance difference of unimproved and improved sites againstliquefaction.3. Settlements of up to 4.5 cm occurred in the area where thesand layer was untreated, while no liquefaction related settlementswere observed within the areas treated with jet groutcolumns. Lot C and partly parking structure sections were theonly areas at the center that had not been improved with jetgrout columns at the time of the quake. All other areas hadbeen improved with jet grout columns to reduce liquefactionsusceptibility.4. Both Ishihara’s method utilizing CPT data and Tokimatsuand Seed’s method utilizing SPT N values provided close estimates<strong>for</strong> the observed settlements.5. No ground failure in the <strong>for</strong>m of sand boils or ground crackswere observed anywhere at the site. Considering that approximately6.0 m thick “unliquefiable soil” overlays the 1.5m thick “liquefiable” sand layer at Lot C, the absence of surfacemanifestation of liquefaction is expected according toIshihara.6. Jet grout columns were effective in mitigation of liquefactionand liquefaction-related settlements of the loose sand stratum.Seed, H.B., Idriss, I.M. and Arango, I. 1983. Evaluation of liquefactionpotential using field per<strong>for</strong>mance data, Journal of Geotechnical Eng.,ASCE, Vol.109, No.3, March.Stark, T. D. and Olson S.M. 1995. <strong>Liquefaction</strong> resistance using CPTand field case histories, Journal of Geotechnical Engineering, ASCE,Vol.121(12), pp.856-869.Suzuki, Y., Tokimatsu, K., Koyamada, K., Taya Y. and Kubota, Y. 1995.Field correlation of soil liquefaction based on CPT data. Proceedings,International Symposium on Cone Penetration Testing, CPT’95,Linköping, Sweden, Vol.2, pp.583-588.Tokimatsu, K. and Seed, H.B. 1987. Evaulation of settlements in sandsdue to earthquake shaking, Journal of Geotechnical Engineering,ASCE, Vol.113 (GT8), pp.861-78.Zetas Earth Technology Corp., 1998. Izmit Carrefoursa CommercialCenter soil investigations factual report-in Turkish.ACKNOWLEDGMENTSWe express our appreciation to Zetas Earth Technology Corp.and Geoteknik Corp. <strong>for</strong> providing the necessary data and in<strong>for</strong>mation<strong>for</strong> this paper. We are grateful to Professor Ertun Hizir o-glu, Mr. Adil Ersoy and Mr. Umit Turksoy from project managementteam of ERA <strong>for</strong> their kind collaboration. We alsothank to CARREFOURSA <strong>for</strong> their permission <strong>for</strong> the public a-tion of this paper.REFERENCESDurgunoglu, H.T., 1999. Izmit Carrefoursa site, evaluation of liquefactionpotential, Internal report, Zetas Earth Technology Corp.-in Turkish.Geoteknik Soil Investigation and Consultancy Corp., 1998. Izmit Carrefoursageotechnical evaluations report.Idriss, I.M., 1998. An Update of Simplified <strong>Liquefaction</strong> Evaluation Procedure,2nd Japan-Turkey Workshop on Earthquake Engineering, Istanbul,Turkey.Ishihara, K., 1985. Stability of Natural Deposits During Earthquakes,Proceedings, 11th International Conference on Soil Mechanics andFoundation Engineering, San Francisco, Vol.1, pp.321-376.Ishihara, K., 1993. <strong>Liquefaction</strong> and flow failure during earthquake, The33rd Rankine Lecture, Géotechnique, Vol.43 (3), pp.351-415.Kramer, S. L., 1996. Geotechnical Earthquake Engineering, PrenticeHall, Upper Saddle River, New Jersey 07458, 653pp.Lunne, T., P.K. Robertson and J.J.M. Powell, 1997. Cone PenetrationTesting in Geotechnical Practice, E & FN Spon, 312pp.Robertson, P.K. and R.G. Campanella, 1988. Guidelines <strong>for</strong> GeotechnicalDesign Using CPT and CPTU Data, Technical Report, Civil EngineeringDepartment, University of British Columbia, Vancouver,B.C., Canada.