Temperature Profiles for an Optimized Water Vapor Canopy.indd
Temperature Profiles for an Optimized Water Vapor Canopy.indd
Temperature Profiles for an Optimized Water Vapor Canopy.indd

You also want an ePaper? Increase the reach of your titles
YUMPU automatically turns print PDFs into web optimized ePapers that Google loves.
2 L. Vardim<strong>an</strong>complete treatment of the water vapor c<strong>an</strong>opy in, The<strong>Water</strong>s Above. He gathered supporting documentation<strong>for</strong> a vapor c<strong>an</strong>opy not only from Scripture, but alsofrom archeology, mythology, <strong>an</strong>d science. He beg<strong>an</strong> thefirst serious attempt at developing a numerical modelof the vapor c<strong>an</strong>opy. Dillow was able to maintain alivable surface temperature under a massive watervapor c<strong>an</strong>opy by assuming a high albedo at the top ofthe c<strong>an</strong>opy which reflected most of the incident solarradiation, a large infrared emission coefficient whichallowed a large amount of heat to escape back to space,<strong>an</strong>d a large flux of heat from the atmosphere to theoce<strong>an</strong> <strong>an</strong>d tr<strong>an</strong>sfer to the poles. These assumptionswere based on extensions of theoretical considerationsby Kondratyev (1965, 1969) but are not supported byobservation or current atmospheric modeling.Rush (1990) extended Dillow’s ef<strong>for</strong>ts by usinga widely accepted radiation code to model thetemperature profiles under a two-layer atmosphere,the upper layer of which was pure water vapor.Details of the model <strong>an</strong>d the results of the simulationsmay be found in Rush <strong>an</strong>d Rush & Vardim<strong>an</strong> (1990).C<strong>an</strong>opies r<strong>an</strong>ging in size from 10 to 1013 mb of watervapor (that is, 10 cm to 1013 cm of precipitable water)were found to produce temperatures in radiationalequilibrium at the c<strong>an</strong>opy base hot enough tomaintain water in the vapor phase. Un<strong>for</strong>tunately,except <strong>for</strong> the 10 mb (10 cm of precipitable water)c<strong>an</strong>opy, all modeled c<strong>an</strong>opies produced inhospitablyhigh surface temperatures. It was suggested thatthe addition of cirrus clouds at the top of the c<strong>an</strong>opywhere supersaturated vapor conditions had beennoted in the model might help reduce the extremelyhigh temperatures found at the surface.In Vardim<strong>an</strong> (1998) the solar const<strong>an</strong>t, surfacealbedo, solar zenith <strong>an</strong>gle, cirrus cloud thickness,<strong>an</strong>d cirrus cloud-base height were varied <strong>an</strong>d theeffect on vertical temperature distributions studied.It was found that ch<strong>an</strong>ges in the solar const<strong>an</strong>tmost strongly affected the surface temperature. Theaddition of a 4 km thick cirrus layer at the top of thevapor c<strong>an</strong>opy produced a completely isothermal layerfrom the bottom of the cirrus layer to the ground. Thishelped to reduce greatly the surface temperature butnone of the effects were so dramatic as to eliminatethe concern over limitations of water content in thec<strong>an</strong>opy on hot surface temperatures. It was suggestedthat optimum values of all five parameters should beintroduced into the same 10 mb (10 cm of precipitablewater) model simult<strong>an</strong>eously to minimize the surfacetemperature. This paper reports on the results ofconducting such a study.The one-dimensional model by Rush & Vardim<strong>an</strong>(1990) is used here to calculate the equilibriumvertical temperature profiles which result fromheating by solar <strong>an</strong>d infrared radiation at each of 20or more layers in a two-component atmosphere. Theheating was tabulated from radi<strong>an</strong>ce calculationsusing the atmospheric radi<strong>an</strong>ce <strong>an</strong>d tr<strong>an</strong>smissionprogram LOWTRAN 7 developed by the U.S. AirForce (Kneizyset al. (1988). The two-componentatmosphere was structured with <strong>an</strong> upper layer ofpure water vapor containing approximately 10 cmof precipitable water resting hydrostatically on alower layer of dry air identical to today’s atmosphere.The initial vertical temperature distribution wasisothermal at 170 K. Since this is a one-dimensionalradiation model, no heat is tr<strong>an</strong>sported by conductionor convection or north <strong>an</strong>d south. The solar const<strong>an</strong>t,the solar zenith <strong>an</strong>gle, the surface albedo, <strong>an</strong>d cloudgeometries <strong>an</strong>d properties could all be varied.Optimizing the C<strong>an</strong>opyIn Vardim<strong>an</strong> (1998) surface temperature <strong>an</strong>dlower atmospheric layer temperatures were shownas a function of five variables: (a) solar const<strong>an</strong>t, (b)solar zenith <strong>an</strong>gle, (c) surface albedo, (d) cirrus cloudthickness, <strong>an</strong>d (e) cirrus cloud base height. Surfacetemperature decreased strongly <strong>for</strong> lower values ofthe solar const<strong>an</strong>t. It was varied from 50% to 150%of today’s value <strong>an</strong>d exhibited the strongest effect onsurface temperature of all the variables.Surface temperature decreased moderately <strong>for</strong>larger values of the solar zenith <strong>an</strong>gle. The solarzenith <strong>an</strong>gle c<strong>an</strong> be thought of as the <strong>an</strong>gle the sun’srays make relative to the local zenith (vertical) at thetime of the year of the vernal or autumnal equinox(when the sun st<strong>an</strong>ds directly over the equator). Asolar zenith <strong>an</strong>gle of 15° represents a latitude of 15°,or the tropics. A solar zenith <strong>an</strong>gle of 75° representsa latitude of 75°, or the polar regions. So, as wouldbe expected, solar heating is the least in the polarregions <strong>an</strong>d greatest in the tropics.Surface temperature decreased weakly <strong>for</strong>larger values of surface albedo. The surfacealbedo is the fraction of short-wave solar radiationwhich is reflected by the earth’s surface. Since theequilibrium temperatures in the earth-atmospheresystem are dominated by infrared radiation underc<strong>an</strong>opy conditions, even large ch<strong>an</strong>ges in the surfacealbedo have a relatively small effect on surfacetemperature.It is generally accepted today, although just theopposite is sometimes reported, that low cloudsproduce surface warming <strong>an</strong>d high clouds producesurface cooling (Ram<strong>an</strong>ath<strong>an</strong> & Collins, 1991). In thissimulation surface temperature decreased weakly <strong>for</strong>larger values of cirrus cloud base height. Within theheight constraints of the model, surface temperaturereached a minimum <strong>for</strong> a cirrus cloud-base height of50 km.Surface temperature decreased moderately <strong>for</strong>
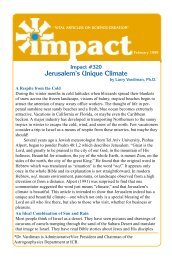
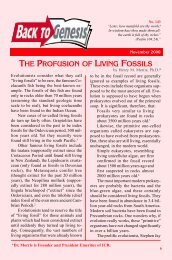
<strong>Temperature</strong> <strong>Profiles</strong> <strong>for</strong> <strong>an</strong> <strong>Optimized</strong> <strong>Water</strong> <strong>Vapor</strong> C<strong>an</strong>opy3larger values of cirrus cloud thickness. The thicker thecirrus clouds the greater the absorption <strong>an</strong>d scatteringof radiation, either solar or infrared. At 4 km thicknessthe cirrus cloud produced isothermal conditionsbetween the cloud base <strong>an</strong>d the earth’s surface. Thisis import<strong>an</strong>t <strong>for</strong> reducing the minimum equilibriumsurface temperature, because with no layer aloft ora thin layer, the temperature distribution near thesurface exhibited a “foot” of high temperatures atthe ground. The 4 km thick cirrus cloud creates <strong>an</strong>absorbing layer. Under such conditions convectivemotions will not occur <strong>an</strong>d conduction <strong>an</strong>d radiationtr<strong>an</strong>sfer will bring the lower atmosphere to <strong>an</strong>isothermal state, in accord<strong>an</strong>ce with S<strong>an</strong>dstrom’stheorem discussed in Houghton (1986).In <strong>an</strong> attempt to minimize the temperatures at theearth’s surface, the optimum values of the variablesabove were studied. Cirrus cloud thickness was setat 4 km. Cirrus cloud-base height was set at 50 km.Surface albedo was set at 30%. The solar zenith <strong>an</strong>glewas set at the two extreme values of 15° <strong>an</strong>d 75°. Thiswas done to simulate polar <strong>an</strong>d equatorial conditionssince both are present in the atmosphere at the sametime. This polar condition will actually constrain thepotential precipitation of oxygen, nitrogen, <strong>an</strong>d othergases from the atmosphere. If polar temperaturesfall below the boiling point of a gas (<strong>for</strong> example,90 K <strong>for</strong> oxygen) the gas will <strong>for</strong>m liquid droplets<strong>an</strong>d precipitate out of the atmosphere. Knowing bothpolar <strong>an</strong>d equatorial temperature distributions willalso allow pole-to-equator temperature gradients tobe estimated <strong>an</strong>d, consequently, pressure gradients<strong>an</strong>d wind fields. The solar const<strong>an</strong>t was varied from1% to 100% of today’s value.Twelve different model runs are reported here, sixat a solar zenith <strong>an</strong>gle of 15° representing conditionsin the tropics <strong>an</strong>d six at 75° representing the polarregions. The equilibrium temperature distributionsin the atmosphere will be displayed by altitude <strong>an</strong>das a function of the solar const<strong>an</strong>t, the independentvariable.ResultsFigures 1 <strong>an</strong>d 2 show the ch<strong>an</strong>ge in the verticaldistribution of temperature with time <strong>for</strong> a solarconst<strong>an</strong>t of 1% of today’s value in the polar regions<strong>an</strong>d 100% of today’s value in the tropics, respectively.These conditions are the extremes modeled in thispaper. The initial distribution of temperature in theatmosphere is set at a const<strong>an</strong>t 170 K with height inall simulations. This is done to follow the procedurefirst introduced in this type of modeling by M<strong>an</strong>abe& Strickler (1964) <strong>an</strong>d to avoid the possibility thatdifferent initial values would influence the finalresult. Time is shown in days after the simulation isbegun. Radiational equilibrium is reached when theHeight (km)80604020640 320160 80 40 20 10 01280050 100 150 200<strong>Temperature</strong> (K)Figure 1. The vertical distribution of temperature <strong>for</strong> 1%of today’s solar const<strong>an</strong>t in the polar regions. Each curveis <strong>for</strong> the time in days after the start of the simulation.vertical temperature distribution stops ch<strong>an</strong>ging withtime. Note, that equilibrium was not reached in thesimulation of Figure 1, but was reached in all others.For a solar const<strong>an</strong>t of 1% in the polar regions, shownin Figure 1, the amount of solar radiation entering theatmosphere is not sufficient to compensate <strong>for</strong> the lossto space by infrared radiation. The entire atmospherecools from its initial isothermal 170 K. It cools morestrongly in the upper atmosphere as shown by thebending to cold temperatures near the top of the plot.However, the entire atmosphere cools <strong>an</strong>d contractswith time, approaching absolute zero. It will not reachabsolute zero, but the simulation shows that sufficientcooling occurs that all the water vapor in the c<strong>an</strong>opywill be turned to ice <strong>an</strong>d fall out as snow.In addition, as the temperature falls below 90 K,the condensation point <strong>for</strong> oxygen is reached, so eventhe oxygen in the atmosphere will turn to a liquid<strong>an</strong>d precipitate out. The boiling point <strong>for</strong> nitrogen is77 K, so if the temperature continues to cool, even thenitrogen in the atmosphere will turn to a liquid. Atcolder temperatures oxygen <strong>an</strong>d nitrogen may eventurn to a solid.Height (km)8060402040201001608064032012800100 150 200 250 300 350 400<strong>Temperature</strong> (K)Figure 2. The vertical distribution of temperature <strong>for</strong>100% of today’s solar const<strong>an</strong>t in the tropics. Each curveis <strong>for</strong> the time in days after the start of the simulation.
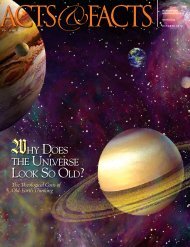
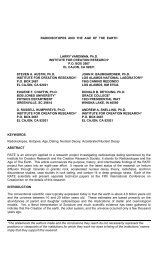
4 L. Vardim<strong>an</strong>This model does not account <strong>for</strong> heat flowing fromthe equator to polar regions. This heat flow polewardin the atmosphere <strong>an</strong>d oce<strong>an</strong>s is what causes the globalcirculation <strong>an</strong>d eddies which we know as weather. Wewill discuss below why these weather patterns mayhave been weakened under a c<strong>an</strong>opy. This model alsodoes not consider dynamic ch<strong>an</strong>ges in the total gaseousconcentration on radiation. All gas concentrations areinitially set at a fixed value. The gases are allowedto exp<strong>an</strong>d <strong>an</strong>d contract as the temperature ch<strong>an</strong>ges.The contraction of the atmosphere at the poles withtime c<strong>an</strong> be seen in the temperature distributions.Asthe atmosphere cools, the heights of the data points,which are shown at const<strong>an</strong>t pressure levels, decrease.This contraction is due to cooling, not the removal ofmass. The model treats radiation effects only. If thewater vapor was removed from the c<strong>an</strong>opy in themodel, the cooling would be even greater. For a solarconst<strong>an</strong>t of 100% at the equator shown in Figure 2,the atmosphere rapidly warms from the isothermal170 K to <strong>an</strong> equilibrium temperature distribution ofapproximately 400 K at the surface <strong>an</strong>d isothermal tothe base of the cirrus cloud deck above. The surfacetemperature is hotter th<strong>an</strong> the boiling point of water,making life as we know it on earth, impossible.The exp<strong>an</strong>sion of the atmosphere at the equatorwith time c<strong>an</strong> also be seen here in the temperaturedistributions. As the atmosphere warms, the heightsof the data points increase. This exp<strong>an</strong>sion is due towarming, not the addition of mass. In the real world,if the atmosphere were warmed, water vapor wouldbe evaporated from the oce<strong>an</strong>s <strong>an</strong>d the temperaturewould become even greater. This would be similarto the extreme surface temperatures in the carbondioxide atmosphere of Venus which has been giventhe name, “The Runaway Greenhouse.”Figures 3 <strong>an</strong>d 4 show the equilibrium temperaturedistributions in the polar regions <strong>an</strong>d at the equator,respectively, as a function of the percentage of the solarconst<strong>an</strong>t. Note first, that the depth of the atmosphere<strong>an</strong>d the equilibrium temperatures are directlyproportional to the magnitude of the solar const<strong>an</strong>t.Even with all the complexity of the absorption,scattering, <strong>an</strong>d re-emission of the radiation in theatmosphere, the final equilibrium temperature is afairly simple function of the amount of energy enteringthe system.Second, <strong>for</strong> the same percentage of solar const<strong>an</strong>t thetemperature distribution at all levels in the atmosphereis colder in the polar regions th<strong>an</strong> at the equator. Infact, the relative temperature differential betweenthe poles <strong>an</strong>d equator is similar to that of today. Thisis somewhat of a surprise, since Dillow (1981), Rush(1990), <strong>an</strong>d Rush & Vardim<strong>an</strong> (1990) had <strong>an</strong>ticipatedthe temperatures would be more uni<strong>for</strong>m from poleto equator th<strong>an</strong> today. This is signific<strong>an</strong>t becauseHeight (km)807060504030201050201051100050 100 150 200 250 300 350 400<strong>Temperature</strong> (K)Figure 3. Equilibrium temperature distributions in thepolar regions as a percentage of today’s solar const<strong>an</strong>t.the pole-to-equator temperature differential is whatdrives the general circulation of the atmosphere <strong>an</strong>d,in particular, the jet stream which circles the globe inboth hemispheres. This me<strong>an</strong>s that the intensity ofthe global circulation was probably about the same asthat of today. The jet stream probably had about thesame velocity <strong>an</strong>d barotropic instability as today. Abarotropic instability is the tendency to <strong>for</strong>m eddies inthe west-to-east flow patterns because of strong windshear at mid-latitudes. Baroclinic instabilities (thosecaused by temperature gradients) were probably alsoweaker because of increased convective stability, to bediscussed below.Third, <strong>for</strong> all simulations, particularly at highvalues of solar const<strong>an</strong>t <strong>an</strong>d at the equator, thevertical temperature distribution is isothermal inthe lower atmosphere. This me<strong>an</strong>s that vertical airmotions are suppressed. It is unlikely that convectionwill occur <strong>an</strong>d precipitation would be eliminated orgreatly reduced. Baroclinic instabilities would also beweaker because of little or no release of latent heat atfrontal boundaries. The net result of a similar pole-Height (km)8070605040302010201015010030050 100 150 200 250 300 350 400<strong>Temperature</strong> (K)Figure 4. Equilibrium temperature distributions in thetropics as a percentage of today’s solar const<strong>an</strong>t.
<strong>Temperature</strong> <strong>Profiles</strong> <strong>for</strong> <strong>an</strong> <strong>Optimized</strong> <strong>Water</strong> <strong>Vapor</strong> C<strong>an</strong>opy5to-equator temperature gradient with much greatervertical stability would probably be a world with muchless precipitation <strong>an</strong>d fewer clouds. The RichardsonNumber, a measure of dynamic instability wouldbe much less (see Hess, 1959, p. 290). Rossby waveswould probably be weaker (see Hess, pp. 253–256).Jetstream patterns with associated clouds, if <strong>an</strong>y,might be more similar to those on Venus <strong>an</strong>d Saturn.Clouds would probably girdle the earth as morecontinuous circular b<strong>an</strong>ds <strong>an</strong>d exhibit fewer waves<strong>an</strong>d eddies. This implies that less heat would probablybe tr<strong>an</strong>sported from the equator to the poles th<strong>an</strong>today, <strong>an</strong>d pole-to-equator temperature gradientsmight be even greater.Fourth, under a vapor c<strong>an</strong>opy containing 10 cmof precipitable water the solar const<strong>an</strong>t must liesomewhere between 1% <strong>an</strong>d 100% of today’s value <strong>for</strong>the mass of the atmosphere to remain in equilibrium.At 1% of today’s solar const<strong>an</strong>t all of the watervapor <strong>an</strong>d maybe even a part of the oxygen wouldprecipitate out at the poles. At 100% the oce<strong>an</strong>s wouldevaporate in the tropics. This doesn’t happen todaybecause the solar const<strong>an</strong>t is high enough to preventexcessive cooling at the poles <strong>an</strong>d there is relativelylittle water vapor in the atmosphere to produce suchhigh temperatures in the tropics. It appears that thesolar const<strong>an</strong>t needed to bal<strong>an</strong>ce these two extremesis about 25% of today’s value. At 25% the surfacetemperature at the poles stays above the boiling point<strong>for</strong> oxygen <strong>an</strong>d the surface temperature at the equatorstays below the boiling point <strong>for</strong> water.DiscussionThe earth’s atmosphere, oce<strong>an</strong>, <strong>an</strong>d cryosphericsystems are like a very complex still—<strong>an</strong> apparatus<strong>for</strong> distilling liquids. The sun is the heat source, thetropics is the firebox, <strong>an</strong>d the polar regions are thecondensers. Solar radiation is converted to sensible <strong>an</strong>dlatent heat in the tropics, tr<strong>an</strong>sported by the generalcirculation to the poles, <strong>an</strong>d emitted to space. <strong>Water</strong>plays a major role in this process because of its uniquecapacity to hold large qu<strong>an</strong>tities of heat in its variousstates <strong>an</strong>d to absorb <strong>an</strong>d release this heat during phasech<strong>an</strong>ges. In addition, water in vapor <strong>for</strong>m modulatesthe radiational properties of the atmosphere in majorways through its greenhouse properties.If, in addition to <strong>an</strong> initial vertical distribution ofwater vapor in the atmosphere, the solar const<strong>an</strong>thas varied in the past, it might be possible to discovervarious states in which this “atmospheric still”operates. It appears that we have now discovered someboundaries conditions which constrain a vapor c<strong>an</strong>opy<strong>an</strong>d lead to estimated conditions under which it couldfunction if, in fact, it existed. These conditions appearto require the magnitude of the solar const<strong>an</strong>t tohave varied in the past. It will be necessary to extendthese studies to explore thicker c<strong>an</strong>opies again as wasoriginally done by Dillow (1981) <strong>an</strong>d Rush (1990),however, these studies are beyond the scope of thispaper. In the me<strong>an</strong>time, it is instructive to discuss theimplications of a ch<strong>an</strong>ged solar const<strong>an</strong>t.Why would the solar const<strong>an</strong>t have been lower priorto the Flood? There are four possible sets of conditionswhich could have caused a lower effective solarconst<strong>an</strong>t: (1) the sun’s output was less, (2) the dist<strong>an</strong>cefrom the sun to the earth was greater, (3) some of theradiation from the sun was captured en route to theearth, or (4) a greater percentage of the solar radiationwas reflected from the top of the atmosphere.1. Reduced Solar OutputEven to suggest that the sun’s output has beensignific<strong>an</strong>tly different during past historical timeseems to be unimaginable to most people. However,both biblical <strong>an</strong>d scientific evidence lends supportto such <strong>an</strong> idea. The view that the sun has alwaysbeen the same brightness falls into the category ofuni<strong>for</strong>mitari<strong>an</strong>ism, except <strong>for</strong> one supposed longperiodtrend early in the old earth system. The “faintyoung sun paradox” seems to be one exception to thebelief that the present is the key to the past. But, Joshua10:12–14 speaks of the sun st<strong>an</strong>ding still <strong>for</strong> <strong>an</strong> entireday so that the Children of Israel could prevail overthe Amorites. Although this incident doesn’t involvethe darkening of the sun, which is harder <strong>for</strong> God todo, make the sun st<strong>an</strong>d still or reduce its output?Exodus 10:21–27 says that during the ninth plagueon Egypt the sun was darkened <strong>for</strong> three days. Thiswas not a slight dimming, but a complete darknesswhich could be felt. Luke 23:44–45 speaks of theSun being darkened <strong>for</strong> three hours during the timeof Christ’s crucifixion. It may be that God causedclouds or the moon to cover the sun, but the moststraight<strong>for</strong>ward interpretation of this passage is thatthe sun’s radiation was reduced or stopped.Evidence continues to mount that at some time inearth’s history increased concentrations of oxygen <strong>an</strong>dcarbon dioxide were present in the earth’s atmosphere(Graham, Dudley, Aguilar, & G<strong>an</strong>s, 1995, pp. 117–120).Carbon dioxide is almost as effective a greenhouse gasas water vapor, so if such high concentrations existed,similar simulations as conducted in this paper wouldrequire the solar output to also be reduced to avoidextreme surface temperatures. Nuclear models of theSun call <strong>for</strong> it to have had a reduced intensity earlyin its life (Sag<strong>an</strong> & Chyba, 1997, pp. 1217–1219). Ofcourse, early in its life me<strong>an</strong>s millions or even billionsof years ago according to the conventional scientificcommunity, but if nuclear processes were slower inthe past <strong>an</strong>d then accelerated, as some now suggest(Humphreys, 2000), then reduced solar output couldhave been present as well.
6 L. Vardim<strong>an</strong>One associated effect of a reduced solar const<strong>an</strong>twhich might be of interest to young earth creationists<strong>an</strong>d experts in radiocarbon dating, would be thereduction in 14 C <strong>an</strong>d the effect on radiocarbon dating.If the solar const<strong>an</strong>t in the early history of the earthwere 25% of today’s value, the production rate of 14 Cwould be 25% of today’s value as well, signific<strong>an</strong>tlyreducing the estimated age of buried org<strong>an</strong>ics. Forexample, if the equilibrium concentration of 14 C inthe atmosphere was 25% of that of today, assumingnothing else ch<strong>an</strong>ged, the estimated age of a bone orother once living org<strong>an</strong>ism would need to be reducedby about 11,500 years.The RATE project, a group of young-earthcreationists exploring the possibility that acceleratednuclear decay in earth’s early history could explainthe evidence <strong>for</strong> large qu<strong>an</strong>tities of nuclear daughterproducts (Vardim<strong>an</strong>, 2000; Vardim<strong>an</strong> et al., in press),has begun to collect evidence that nuclear processeswere, in fact, accelerated <strong>for</strong> periods of time in thehistorical past. This acceleration of nuclear processesdoesn’t appear to be limited to events on the earth,but may have been caused by cosmological effectswhich are universal in their extent. Such causeswould likely have produced m<strong>an</strong>y ch<strong>an</strong>ges, includingprocess rates in the sun. D. R. Humphreys, (2001) in apersonal communication suggests that these ch<strong>an</strong>geswould be consistent with a greater solar intensityduring these periods.2. Greater Dist<strong>an</strong>ce from the SunHumphreys (2001) has also suggested that thesame cosmological effects could possibly have affectedgravity. If, <strong>for</strong> example, the gravitational const<strong>an</strong>t werehalved, the orbit of the earth around the sun would betwice as large as be<strong>for</strong>e <strong>an</strong>d the solar const<strong>an</strong>t wouldbe one fourth as much. In other words, the solarconst<strong>an</strong>t would have been 25% of today’s value be<strong>for</strong>esuch a ch<strong>an</strong>ge in the cosmological const<strong>an</strong>ts. Thesehypotheses must be explored further be<strong>for</strong>e <strong>an</strong>ysignific<strong>an</strong>ce should be placed on these conjectures,but at least the possibilities are consistent.3. Solar Radiation Captured en route to EarthSuggestions have been made that early in earth’shistory a greater concentration of dust was present inintergalactic <strong>an</strong>d interpl<strong>an</strong>etary space (Zeilik, 1988,pp. 327–348). Depending upon the amount <strong>an</strong>d sizedistribution of the dust particles present, a portion ofthe solar radiation coming to earth could have beencaptured <strong>an</strong>d reradiated in all directions. A signific<strong>an</strong>tpercentage of the solar radiation could have beenprevented from reaching earth. If this dust was thenremoved, either slowly or in some catastrophic event,the percentage of solar radiation reaching the earthwould have increased.The mech<strong>an</strong>ism by which the dust was removedcould have been by simple pl<strong>an</strong>etary sweeping ofthe dust; removal by the Poynting-Robertson Effect,in which solar radiation produces a net <strong>for</strong>ce onthe particles; or by movement of our solar systeminto a clear region of our galaxy. Of course, theseconsiderations are normally suggested within <strong>an</strong>old universe, uni<strong>for</strong>mitari<strong>an</strong> model of the origin ofthe solar system. Most of these considerations wouldnot apply in a young universe, creationist frameworkunless there was some large scale, catastrophicprocess. We don’t propose such a mech<strong>an</strong>ism here.4. Reflection from the Top of the AtmosphereIn the upper layers of the atmosphere thetemperature is colder th<strong>an</strong> 0 °C <strong>an</strong>d water vapor c<strong>an</strong>freeze <strong>an</strong>d <strong>for</strong>m ice crystals. It is not sufficient thatthe temperature just be colder th<strong>an</strong> 0 °C, however.The vapor pressure must exceed the saturation vaporpressure, as well. If pure water vapor existed in theupper atmosphere, these conditions would be met,according to the modeling studies done by Rush (1990).When this condition was discovered he at first fearedthat <strong>an</strong>y ice crystals <strong>for</strong>med would precipitate entirelythrough the vapor c<strong>an</strong>opy to the base of the c<strong>an</strong>opy<strong>an</strong>d fall out of the c<strong>an</strong>opy as rain, slowly depletingthe water mass. However, upon closer investigation,it was found that below the upper layer of ice crystals,the c<strong>an</strong>opy was not saturated, so that ice crystalsfalling from above would sublimate <strong>an</strong>d replenishthe upper c<strong>an</strong>opy with vapor. The sublimating icecrystals below the cirrus layers cause this portion ofthe c<strong>an</strong>opy to exp<strong>an</strong>d as the molecules ch<strong>an</strong>ge statefrom a solid to a gas. The water vapor is then <strong>for</strong>cedto higher levels where it is again converted to icecrystals <strong>an</strong>d precipitates out. A type of convection celldriven by phase ch<strong>an</strong>ges recycles the upper portionsof the c<strong>an</strong>opy.The upper-most ice crystal layers of the c<strong>an</strong>opywould produce a reflective layer <strong>for</strong> solar radiation,preventing a portion of the incident radiation fromentering the atmosphere. This reflection of solarradiation at the very top of the atmosphere wouldreduce the solar const<strong>an</strong>t by some yet unknownfactor. By reflecting this radiation at the top ofthe atmosphere it would not become involved inthe complex absorption, scattering, <strong>an</strong>d emissionprocesses lower in the atmosphere. If this layer wasthin, relatively little incident radiation from thesun would be removed. However, if the layer wasthick, permitting greater amounts to be removed, itwould probably become less tr<strong>an</strong>sparent <strong>for</strong> viewingof the sun, moon, <strong>an</strong>d stars from the ground. It ispossible that the cirrus layer could also be “patchy” or“broken” giving intermittent visibility. The necessity<strong>for</strong> visibility to see the sun, moon, <strong>an</strong>d stars be<strong>for</strong>e the
<strong>Temperature</strong> <strong>Profiles</strong> <strong>for</strong> <strong>an</strong> <strong>Optimized</strong> <strong>Water</strong> <strong>Vapor</strong> C<strong>an</strong>opy7Flood is required from Genesis 1:14–19.For purposes of simulations reported in this paper,the solar extinction equation <strong>for</strong> cirrus developed bythe National Oce<strong>an</strong>ic <strong>an</strong>d Atmospheric Administration<strong>an</strong>d distributed by a commercial software comp<strong>an</strong>y(Ontar) was used. It calculates the extinction of solarradiation at 0.55 µm wavelength as:CEXT= 0.14 CTHIKwhere CEXT is the extinction of solar radiation <strong>an</strong>dCTHIK is the thickness of a cirrus cloud in kilometers.The optimum cooling <strong>for</strong> cirrus clouds in the c<strong>an</strong>opymodel occurred at a thickness of 4 km at <strong>an</strong> extinctionof just over 50%.Further studies need to conducted on the reflective,absorptive, <strong>an</strong>d tr<strong>an</strong>smission properties from the topof thin cirrus clouds. It would be helpful to determineif thin layers of cirrus clouds c<strong>an</strong> reflect largepercentages of solar radiation while at the same timepermitting pl<strong>an</strong>etary <strong>an</strong>d stellar objects to be seenthrough them. Obviously, much more work needs tobe done.ConclusionsIt appears then that if a more dynamic view ofsolar history is entertained, earth’s climate may notonly allow a thicker vapor c<strong>an</strong>opy, but may requireone. Evidence seems to exist that solar radiation wasmuch less in the past. The radiation reaching theatmosphere may have been as little as 25% of today’svalue. A thicker vapor c<strong>an</strong>opy <strong>an</strong>d weaker solarradiation could have bal<strong>an</strong>ced the rates of incoming<strong>an</strong>d outgoing radiation <strong>an</strong>d produce equable surfacetemperatures. A thicker vapor c<strong>an</strong>opy would probablyreduce the solar radiation reaching the surface atshort, ultraviolet wavelengths <strong>an</strong>d increase thesurface pressure. These effects would be expected tocreate healthier conditions on earth th<strong>an</strong> exist today.RecommendationsIt is recommended that further climate simulationsbe conducted with thicker vapor c<strong>an</strong>opies <strong>an</strong>d smallersolar const<strong>an</strong>ts. C<strong>an</strong>opies of 100 to 1000 millibarsshould be explored <strong>for</strong> solar const<strong>an</strong>ts of 25% or lessof today’s value. Effects of such thick c<strong>an</strong>opies <strong>an</strong>dhigh cirrus decks on visibility should be checked toensure that enough visible light reaches the groundto allow the sun, moon, <strong>an</strong>d stars to be seen. Thehealth benefits of reduced ultraviolet wavelengths<strong>an</strong>d increased pressure on pl<strong>an</strong>ts <strong>an</strong>d <strong>an</strong>imals shouldalso be verified.It would be useful if three dimensional globalatmospheric general circulation models with a coupledoce<strong>an</strong> model were used to test the vapor c<strong>an</strong>opy. Thiswould be much more suitable <strong>for</strong> testing polar <strong>an</strong>d(1)equatorial effects of radiation effects <strong>an</strong>d includingthe dynamics as well. Such models are now becomingavailable <strong>an</strong>d sufficiently economical that creationistsmay soon be able to utilize them. The vapor c<strong>an</strong>opymodel is still alive <strong>an</strong>d worth testing.AcknowledgmentsThe computers used in this study were provided byMr. Steve Low <strong>an</strong>d his associates <strong>an</strong>d matching giftsfrom the Hewlett-Packard Corporation. Software<strong>an</strong>d supplies were purchased from donations by Mr.<strong>an</strong>d Mrs. James Moyers <strong>an</strong>d matching gifts fromthe Mobil Oil Corporation. The ICC reviewers of thispaper made it better by their critiques.ReferencesDillow, J. C. (1981). The waters above (479 pp.) Chicago, Illinois:Moody Press.Graham, J. B., Dudley, R., Aguilar, N., & G<strong>an</strong>s, C.(1995). Implications of the late Palaeozoic oxygenpulse <strong>for</strong> physiology <strong>an</strong>d evolution. Nature, 375,117–120.Hess, S. L. (1959). Introduction to theoretical meteorology.Lalbar, Florida: Krieger Publishing Comp<strong>an</strong>y.Houghton, J. T. (1986). The physics of atmospheres (2nd ed.).Cambridge, Engl<strong>an</strong>d: Cambridge University Press.Humphreys, D. R. (1994). Starlight <strong>an</strong>d time (137 pp.) GreenForest, Arizona: Master Books.Humphreys, D. R. (2000). Accelerated nuclear decay: Aviable hypothesis? In L. Vardim<strong>an</strong>, A. A. Snelling, & E. F.Chaffin (Eds.), Radioisotopes <strong>an</strong>d the age of the earth: Ayoung-earth creationist initiative (pp. 333–379). El Cajon,Cali<strong>for</strong>nia: Institute <strong>for</strong> Creation Research & St. Joseph,Missouri: Creation Research Society.Kneizys, F. X., Shettle, E. P.. Abreu, L. W., Chetwynd, J. H.,Fenn, R. W., Gallery, W. O., Selby, J. E. A., & Clough, S.(1988). Atmospheric tr<strong>an</strong>smitt<strong>an</strong>ce/radi<strong>an</strong>ce: Computercode Lowtr<strong>an</strong> 6, AFGL-TR-83-0187. Air Force GeophysicalLaboratory, H<strong>an</strong>scom AFB, Massachusetts.Kondratyev, K. Y. (1965). Radiative heat exch<strong>an</strong>ge in theatmosphere. New York: Pergamon.Kondratyev, K. Y. (1969). Radiation in the atmosphere. NewYork: Academic Press.M<strong>an</strong>abe, S. & Strickler, R. F. (1964). Thermal equilibrium ofthe atmosphere with a convective adjustment. Journal ofthe Atmospheric Sciences, 21, 361.Ontar, Ontar Users M<strong>an</strong>ual <strong>for</strong> PC-TRAN 7, a personalcomputer version of the LOWTRAN 7 atmospheric modelversion (p. 127). Ontar Corporation, 129 UniversityRoad, Brookline, MA 02146, developed by the Air ForceGeophysics Laboratory, H<strong>an</strong>scom AFB, MA 01731.Ram<strong>an</strong>ath<strong>an</strong>, V. & Collins, W. (1991). Thermodynamicregulation of oce<strong>an</strong> warming by cirrus clouds deduced fromobservations of the 1987 El Nino. Nature, 351, 27–32.Rush, D.E. (1990). Radiative equilibrium temperatureprofiles under a vapor c<strong>an</strong>opy. Unpublished masters thesis,Institute <strong>for</strong> Creation Research Graduate School, S<strong>an</strong>Diego, Cali<strong>for</strong>nia.Rush, D. E. & Vardim<strong>an</strong>, L. (1990). Pre-Flood vapor c<strong>an</strong>opy
8 L. Vardim<strong>an</strong>radiative temperature profiles. In R. E. Walsh & C. L. Brooks(Eds.), Proceedings of the second international conferenceon creationism (pp. 231–245). Pittsburgh, Pennsylv<strong>an</strong>ia:Creation Science Fellowship.Sag<strong>an</strong>, C. & Chyba, C. (1997). The early faint sun paradox:Org<strong>an</strong>ic shielding of ultraviolet-labile greenhouse gases.Science, 276, 1217–1219.Vardim<strong>an</strong>, L. (1998). Sensitivity studies on vapor c<strong>an</strong>opytemperature profiles. In R. E. Walsh (Ed.), Proceedingsof the fourth international conference on creationism(pp. 607–618). Pittsburgh, Pennsylv<strong>an</strong>ia: Creation ScienceFellowship.Vardim<strong>an</strong>, L. (2000). Introduction. In L. Vardim<strong>an</strong>, A. A.Snelling, & E. F. Chaffin (Eds.), Radioisotopes <strong>an</strong>d the ageof the earth: A young-earth creationist initiative (pp. 1–25).El Cajon, Cali<strong>for</strong>nia: Institute <strong>for</strong> Creation Research & St.Joseph, Missouri: Creation Research Society.Vardim<strong>an</strong>, L., Austin, S. A., Baumgardner, J. R., Chaffin, E. F.DeYoung, D. B., Humphreys, D. R., & Snelling, A. A. (inpress). Radioisotopes <strong>an</strong>d the age of the earth. In R. L. Ivey(Ed.), Proceedings of the fifth international conference oncreationism. Pittsburgh, Pennsylv<strong>an</strong>ia: Creation ScienceFellowship.Whitcomb, J. C. & Morris, H. M. (1961). The Genesis Flood.Phillipsburg, New Jersey: Presbyteri<strong>an</strong> <strong>an</strong>d Re<strong>for</strong>medPublishing Comp<strong>an</strong>y.Zeilik, M. (1988). Astronomy: The evolving universe (8th ed.)(525 pp.). New York: Wiley & Son.