Tour-de-Force
Tour-de-Force
Tour-de-Force

You also want an ePaper? Increase the reach of your titles
YUMPU automatically turns print PDFs into web optimized ePapers that Google loves.
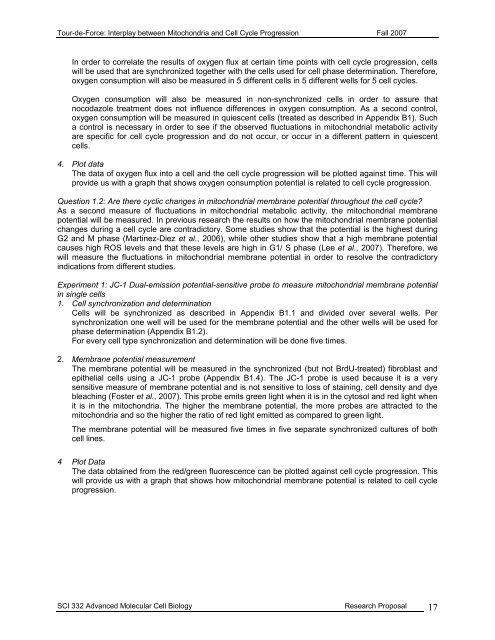
<strong>Tour</strong>-<strong>de</strong>-<strong>Force</strong>: Interplay between Mitochondria and Cell Cycle Progression Fall 2007In or<strong>de</strong>r to correlate the results of oxygen flux at certain time points with cell cycle progression, cellswill be used that are synchronized together with the cells used for cell phase <strong>de</strong>termination. Therefore,oxygen consumption will also be measured in 5 different cells in 5 different wells for 5 cell cycles.Oxygen consumption will also be measured in non-synchronized cells in or<strong>de</strong>r to assure thatnocodazole treatment does not influence differences in oxygen consumption. As a second control,oxygen consumption will be measured in quiescent cells (treated as <strong>de</strong>scribed in Appendix B1). Sucha control is necessary in or<strong>de</strong>r to see if the observed fluctuations in mitochondrial metabolic activityare specific for cell cycle progression and do not occur, or occur in a different pattern in quiescentcells.4. Plot dataThe data of oxygen flux into a cell and the cell cycle progression will be plotted against time. This willprovi<strong>de</strong> us with a graph that shows oxygen consumption potential is related to cell cycle progression.Question 1.2: Are there cyclic changes in mitochondrial membrane potential throughout the cell cycle?As a second measure of fluctuations in mitochondrial metabolic activity, the mitochondrial membranepotential will be measured. In previous research the results on how the mitochondrial membrane potentialchanges during a cell cycle are contradictory. Some studies show that the potential is the highest duringG2 and M phase (Martinez-Diez et al., 2006), while other studies show that a high membrane potentialcauses high ROS levels and that these levels are high in G1/ S phase (Lee et al., 2007). Therefore, wewill measure the fluctuations in mitochondrial membrane potential in or<strong>de</strong>r to resolve the contradictoryindications from different studies.Experiment 1: JC-1 Dual-emission potential-sensitive probe to measure mitochondrial membrane potentialin single cells1. Cell synchronization and <strong>de</strong>terminationCells will be synchronized as <strong>de</strong>scribed in Appendix B1.1 and divi<strong>de</strong>d over several wells. Persynchronization one well will be used for the membrane potential and the other wells will be used forphase <strong>de</strong>termination (Appendix B1.2).For every cell type synchronization and <strong>de</strong>termination will be done five times.2. Membrane potential measurementThe membrane potential will be measured in the synchronized (but not BrdU-treated) fibroblast an<strong>de</strong>pithelial cells using a JC-1 probe (Appendix B1.4). The JC-1 probe is used because it is a verysensitive measure of membrane potential and is not sensitive to loss of staining, cell <strong>de</strong>nsity and dyebleaching (Foster et al., 2007). This probe emits green light when it is in the cytosol and red light whenit is in the mitochondria. The higher the membrane potential, the more probes are attracted to themitochondria and so the higher the ratio of red light emitted as compared to green light.The membrane potential will be measured five times in five separate synchronized cultures of bothcell lines.4 Plot DataThe data obtained from the red/green fluorescence can be plotted against cell cycle progression. Thiswill provi<strong>de</strong> us with a graph that shows how mitochondrial membrane potential is related to cell cycleprogression.SCI 332 Advanced Molecular Cell Biology Research Proposal 17