River Boyne Water Quality Management Plan - EPA
River Boyne Water Quality Management Plan - EPA
River Boyne Water Quality Management Plan - EPA
Create successful ePaper yourself
Turn your PDF publications into a flip-book with our unique Google optimized e-Paper software.
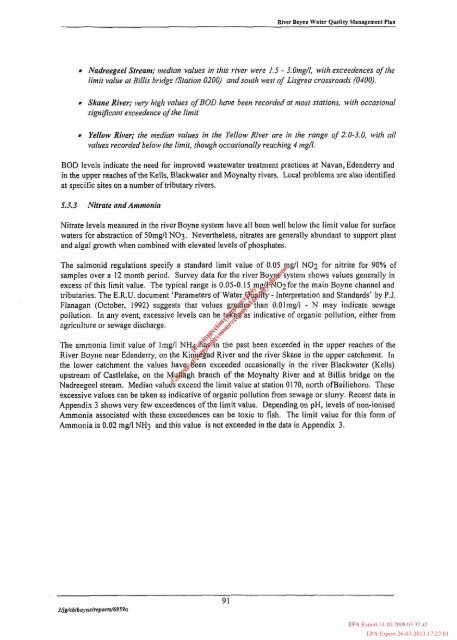
<strong>River</strong> Boync Waler <strong>Quality</strong> Msnagrrnmt <strong>Plan</strong>Nndreegeel Streant; median values in this river were 1.5 - S.Otng/l, with exceedences oflhelimit value at Billis bridge (Station 0200) andsouth west of Lisgrea crossroads (0400).Skane <strong>River</strong>; i~ery high values ojBOD have been recorded at nlost stations, wilh occasionalsign$carir e.rceedet~ce ofthe limitYellow <strong>River</strong>; the ntedian values in rhe Yellow <strong>River</strong> are in the range of 2.0-3.0, with 011values recorded below the limit, though occasionally reaching 4 mg/l.BOD levels indicate the need for improved wastewater treatment practices at Navan, Edenderry andin the upper reaches of the Kells, Blackwater and Moynalty rivers. Local problems are also identifiedat specific sites on a number of tributary rivers.5.3.3 Nitrate and AmmoniaNitrate levels measured in the river <strong>Boyne</strong> system have all been well below the limit value for surfacewaters for abstraction of 5Orng/l NO3 Nevertheless, nitrates are generally abundant to support plantand algal growth when combined with elevated levels of phosphates.The salmonid regulations specify a standard limit value of 0.05 ~ g/l NO2 for nitrite for 90% ofsamples over a 12 month period. Survey data for the river Bo ,$&system shows values generally inexcess of this limit value. The typical range is 0.05-0.15 mqb L 02for the main <strong>Boyne</strong> channel andtributaries. The E.R.U. document 'Parameters of water,@i&y - Interpretation and Standards' by P.J.Flanagan (October, 1992) suggests that values g@~'than O.Olmg/l - N may indicate sewagepollution. In any event, excessive levels can be tq-k'\@%s indicative of organic pollution, either from,X. "agriculture or sewage discharge.,a' ,G\.b -4',>\ L'The ammonia limit value of lmg/l NH+J?$~'S\ n the past been exceeded in the upper reaches of the<strong>River</strong> <strong>Boyne</strong> near Edenderry, on the ind dad <strong>River</strong> and the river Skane in the upper catchment. In\bthe lower catchment the values hav~+$.een exceeded occasionally in the river Blackwater (Kells)upstream of Castlelake, on the M.@gh branch of the Moynalty <strong>River</strong> and at Billis bridge on theNadreegeel stream. Median value$ exceed the limit value at station 0170, north ofBailieboro. Theseexcessive values can be taken as indicative of organic pollution from sewage or slurry. Recent data inAppendix 3 shows very few exceedences of the limit value. Depending on pH, levels of non-ionisedAmmonia associated with these exceedences can be toxic to fish. The limit value for this form ofAmmonia is 0.02 mg/l NH3 and this value is not exceeded in the data in Appendix 3.For inspection purposes only.Consent of copyright owner required for any other use.<strong>EPA</strong> Export 26-07-2013:17:27:01


