NEXT FUNDS Nikkei 225 Leveraged Index Exchange Traded Fund
NEXT FUNDS Nikkei 225 Leveraged Index Exchange Traded Fund
NEXT FUNDS Nikkei 225 Leveraged Index Exchange Traded Fund

You also want an ePaper? Increase the reach of your titles
YUMPU automatically turns print PDFs into web optimized ePapers that Google loves.
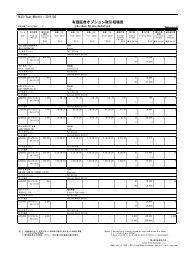
-*1*2*3*42. Performance(1570)<strong>NEXT</strong> <strong>FUNDS</strong> <strong>Nikkei</strong> <strong>225</strong> <strong>Leveraged</strong> <strong>Index</strong><strong>Exchange</strong> <strong>Traded</strong> <strong>Fund</strong>The <strong>Nikkei</strong> <strong>225</strong> <strong>Leveraged</strong> ETF's index volatility will be calculated as two times the multiple of the <strong>Nikkei</strong> <strong>225</strong>index' previous day volatility.1. <strong>Fund</strong> Outline As of 29-Nov-13<strong>Fund</strong> Name <strong>NEXT</strong> <strong>FUNDS</strong> <strong>Nikkei</strong> <strong>225</strong> <strong>Leveraged</strong> <strong>Index</strong> <strong>Exchange</strong> <strong>Traded</strong> <strong>Fund</strong>Underlying <strong>Index</strong> <strong>Nikkei</strong> <strong>225</strong> <strong>Leveraged</strong> <strong>Index</strong><strong>Fund</strong> Fiscal Year From 21 May of each year to 20 May of the next yearRecord Date for Dividend Payment 20 May of each yearManagement Company Nomura Asset ManagementCode1570 Market Price (*1) 10,940 JPYTrading Unit 1Unit Gross Dividend Paid (*2) 0 JPYTotal Expense Ratio 0.8% (With in tax; 0.84 %) 12 month Dividend Yield (*3) 0.00%ETF Net Assets 129,588 (mil JPY) Indicative NAV/PCF(*4) Not availableShares Outstanding 11,740 thous.units Investment Amount per Lot 10,940 JPY140001100080005000In cases of no executions on the above date, "Market Price (JPY)" and "Investment Amount per Lot" will display the most recent market prices.Dividends for the most recent 12 months will be displayed.The dividend yields displayed are calculated based on dividends for the most recent 12 months and the closing price on the date this document wascreated. Indicative NAV refers to the real-time estimated net assets (per unit) calculated by multiplying the PCF information by the current stock price. PCFrefers to the portfolio composition information file provided by the management company. This document indicates whether the Indicative NAV/PCFinformation is disclosed through TSE.<strong>Nikkei</strong><strong>225</strong> Market Price2000Dec-12 Feb-13 Apr-13 Jun-13 Aug-13 Oct-13(Note) <strong>Nikkei</strong><strong>225</strong> (price) calculation is reconverted based on the market price of 29-Nov-13Current Price of Underlying <strong>Index</strong> http://indexes.nikkei.co.jp/en/nkave3. Constituents As of 31-May-134. Ticker- Volatility (Market Price)Volatility (30D) 40.0%Volatility (90D) 46.9%(*)As of 29-Nov-13- Return on InvestmentMarket Price [Reference]<strong>Nikkei</strong><strong>225</strong>Past 3 months +36.58% +16.98%Past 6 months +25.32% +13.70%Past 1 year +158.32% +65.80%Past 3 years - +57.61%Past 5 years - +83.99%In cases where there were no executions for at least 13% ofthe days in the relevant period or where the period after listingis less than the described period, "-" will be displayed.12345Code-Name<strong>Index</strong> Futures5. Underlying <strong>Index</strong> OutlineWeight Market Data Providers ETF Underlying asset200.40% QUICK 1570/T S101♯LI/NKNJBloomberg 1570 JP Equity NKYLEVThomson Reuters 1570.T .N<strong>225</strong>LEVPublished by <strong>Nikkei</strong> Inc., the <strong>Nikkei</strong> <strong>225</strong> <strong>Leveraged</strong> <strong>Index</strong> doubles the performance of the <strong>Nikkei</strong> stock price average on a dailyreturn basis. (Base date/base value: December 28, 2001/ 10,000 points)(See here for details on the <strong>Nikkei</strong> <strong>225</strong> <strong>Leveraged</strong> <strong>Index</strong>.)http://indexes.nikkei.co.jp/nkave/index/profile?idx=nk<strong>225</strong>le
6. List of ETF Information Sources--Detailed Product OutlineNomura Asset Management http://www.nomura-am.co.jp/english/nextfunds/Current Price/Trading Volume/PCF Information/Indicative NAV/Dividend/Distribution for ETFshttp://www.tse.idmanagedsolutions.com/iopv/table?language=en&iopv=17. Disclaimer------This document was created for the sole purpose of providing an outline explanation for ETFs. It is not intended forsolicitation for investment, nor a disclosure document pursuant to the Financial Instruments and <strong>Exchange</strong> Act.Because ETFs invest in securities whose prices fluctuate, the market price or base value may decrease due to shifts inthe underling index or foreign exchange market, fluctuations in the price of constituent securities, bankruptcy ordeterioration in the financial conditions of constituent securities of issuers, or other market causes. Losses may arise fromthese factors. As such, invested capital is not guaranteed. Additionally, in cases of margin trading, losses may occur inexcess of the deposited margin.When trading ETFs, please fully read the documents distributed before concluding a contract with a financial instrumentsbusiness operator, etc. Trading should be conducted on one's own judgment and responsibility, with sufficientunderstanding of the product's attributes, trading mechanism, existence of risk, sales commissions, Total Expense Ratio,etc. The contents of this document are current as of November 2013Following such date, there may be changes to the details of this document due to rule revisions and other factors withoutprior notification. Additionally, the information contained within this document has been prepared with the utmost care.However, the completeness of such information is not guaranteed. Osaka Securities <strong>Exchange</strong> Co.,Ltd. assumes noresponsibility or liability for costs, osses, etc. arising from the use of this document and the information it contains.Tokyo Stock <strong>Exchange</strong> Co.,Ltd. retains all rights related to this document and does not permit the reproduction orreprinting of this document in any circumstances without prior approval.Tokyo Stock <strong>Exchange</strong> Market Business Development Department | 2-1 Nihombashi Kabutocho, Chuo-ku, Tokyo 103-8220Tel:03-3666-0141 Mail: mkt-biz@tse.or.jpCopyright (c) 2012-2013 Tokyo Stock <strong>Exchange</strong>, Inc. All rights reserved.