AVO Percentile Class
AVO Percentile Class
AVO Percentile Class

Create successful ePaper yourself
Turn your PDF publications into a flip-book with our unique Google optimized e-Paper software.
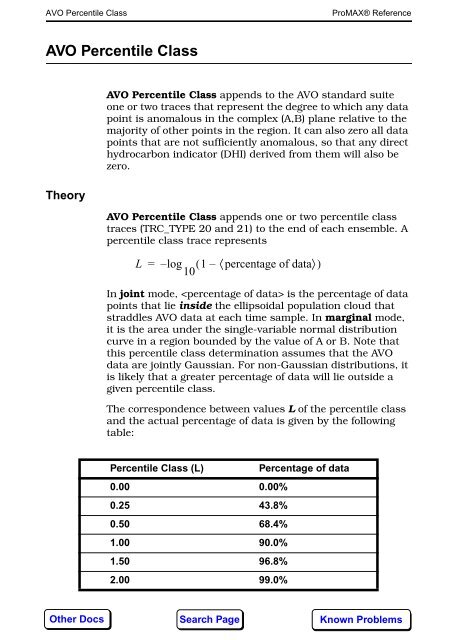
<strong>AVO</strong> <strong>Percentile</strong> <strong>Class</strong>2279ProMAX® Reference<strong>AVO</strong> <strong>Percentile</strong> <strong>Class</strong>Theory<strong>AVO</strong> <strong>Percentile</strong> <strong>Class</strong> appends to the <strong>AVO</strong> standard suiteone or two traces that represent the degree to which any datapoint is anomalous in the complex (A,B) plane relative to themajority of other points in the region. It can also zero all datapoints that are not sufficiently anomalous, so that any directhydrocarbon indicator (DHI) derived from them will also bezero.<strong>AVO</strong> <strong>Percentile</strong> <strong>Class</strong> appends one or two percentile classtraces (TRC_TYPE 20 and 21) to the end of each ensemble. Apercentile class trace representsL=–log 1 percentage of data10 ( – 〈 〉)In joint mode, is the percentage of datapoints that lie inside the ellipsoidal population cloud thatstraddles <strong>AVO</strong> data at each time sample. In marginal mode,it is the area under the single-variable normal distributioncurve in a region bounded by the value of A or B. Note thatthis percentile class determination assumes that the <strong>AVO</strong>data are jointly Gaussian. For non-Gaussian distributions, itis likely that a greater percentage of data will lie outside agiven percentile class.The correspondence between values L of the percentile classand the actual percentage of data is given by the followingtable:<strong>Percentile</strong> <strong>Class</strong> (L)Percentage of data0.00 0.00%0.25 43.8%0.50 68.4%1.00 90.0%1.50 96.8%2.00 99.0%Other DocsSearch PageKnown Problems
<strong>AVO</strong> <strong>Percentile</strong> <strong>Class</strong>2280ProMAX® Reference<strong>Percentile</strong> <strong>Class</strong> (L)Percentage of data2.50 99.7%3.00 99.9%UsagePrimary sort key of input ensembles must be CDP. Eachinput ensemble must contain a standard suite of <strong>AVO</strong> traces.ParametersDescriptionStandard SuiteReal <strong>AVO</strong> “A” trace 43Real <strong>AVO</strong> “B” trace 44Imag <strong>AVO</strong> “A” trace 17Imag <strong>AVO</strong> “B” trace 18Standard deviation “A” 45Standard deviation “B” 47Real AB* correlation 48Imag AB* correlation 41Use <strong>AVO</strong> Standard Suite to create the standard suites.Velocity and prestack traces are output unchanged.Probability distributionSelect one of the following choices:TRC_TYPE• Joint to use the joint distribution between A and B. Asingle percentile-class trace is output for each ensemble.This trace (TRC_TYPE 20) represents the overall probabilityof an event occurring when taking the amplitudesof both A and B into account.• Marginal to use the distributions of A and B independently.Two percentile-class traces are output for eachensemble. The first trace (TRC_TYPE 20) represents theOther DocsSearch PageKnown Problems
<strong>AVO</strong> <strong>Percentile</strong> <strong>Class</strong>2281ProMAX® Referenceprobability of an event occurring with that particular Avalue while ignoring the value of B. The second trace(TRC_TYPE 21) represents the probability of an eventoccurring with that particular B value while ignoring thevalue of A.Percentage of data to nullEnter the percentage of data to zero. The percentage isconverted to a percentile-class L value threshold. Data with Lvalues below the threshold are zeroed.When the right percentage is entered, only the dataanomalies should remain, regardless of where they lie in thecomplex (A,B) plane.Null A as well as B?This appears if Percentage of data to null > 0. Select Yes tonull both A and B traces. Select No to null B traces only.Selecting No enables you to overlay a complete A section witha colored <strong>AVO</strong> attribute section that contains only anomalousevents. When No is selected, the AB* correlation traces arenulled instead of the A traces. Nulling the AB* correlationtraces ensures that any DHI product indicators are also nullfor non anomalous events.Other DocsSearch PageKnown Problems
<strong>AVO</strong> <strong>Percentile</strong> <strong>Class</strong>2282ProMAX® ReferenceOther DocsSearch PageKnown Problems