HOW GREEN IS MY BUDGET? - Instituto de Economia da UFRJ
HOW GREEN IS MY BUDGET? - Instituto de Economia da UFRJ
HOW GREEN IS MY BUDGET? - Instituto de Economia da UFRJ

You also want an ePaper? Increase the reach of your titles
YUMPU automatically turns print PDFs into web optimized ePapers that Google loves.
<strong>HOW</strong> <strong>GREEN</strong> <strong>IS</strong> <strong>MY</strong> <strong>BUDGET</strong>? PUBLIC ENVIRONMENTALEXPENDITURES IN BRAZILAuthors: YOUNG, C.E.F.;ROCHA, E.R.P.; DE BAKKER, L.B.; SANTORO, A.F.Carlos Eduardo Frickmann Young: Associate Professor (Professor Associado), Instituteof Economics, Fe<strong>de</strong>ral University of Rio <strong>de</strong> Janeiro – IE/<strong>UFRJ</strong>. Ph.D., Economics,University College London, 1997. Head of the Research Group on EnvironmentalEconomics and Sustainable Development. IE/<strong>UFRJ</strong>. Email: young@ie.ufrj.brÉrico Rial Pinto Rocha: Graduate Stu<strong>de</strong>nt of Graduate Program in Economics, Instituteof Economics, Fe<strong>de</strong>ral University of Rio <strong>de</strong> Janeiro (<strong>UFRJ</strong>/IE/PPGE). Researcher of theResearch Group on Environmental Economics and Sustainable Development, IE/<strong>UFRJ</strong>.Email: ericorrocha@gmail.comLeonardo Barcellos <strong>de</strong> Bakker: Graduate Stu<strong>de</strong>nt of Graduate Program in Public Policy,Strategy and Development, Institute of Economics, Fe<strong>de</strong>ral University of Rio <strong>de</strong> Janeiro(<strong>UFRJ</strong>/IE/PPED). Researcher of the Research Group on Environmental Economics andSustainable Development, IE/<strong>UFRJ</strong> and Researcher of National Institute of Science andTechology (INCT/PPED). Email: leonardo.bakker@gmail.comAndré Falkenbach Santoro: Un<strong>de</strong>rgraduate Stu<strong>de</strong>nt of Economics, Institute ofEconomics, Fe<strong>de</strong>ral University of Rio <strong>de</strong> Janeiro (<strong>UFRJ</strong>/IE). Researcher of the ResearchGroup on Environmental Economics and Sustainable Development, IE/<strong>UFRJ</strong>.Email: santoro8121@gmail.comAddress:Fe<strong>de</strong>ral University of Rio <strong>de</strong> Janeiro (UFJ/IE), Av. Pasteur, 250, BotafogoRio <strong>de</strong> Janeiro – RJ – 22290 – 240 – BrazilTel: (55) (21) 3873-5284Fax: (55) (21) 2541-8148Email: young@ie.ufrj.brWebsite: http://www.ie.ufrj.br/gema/
<strong>HOW</strong> <strong>GREEN</strong> <strong>IS</strong> <strong>MY</strong> <strong>BUDGET</strong>? PUBLIC ENVIRONMENTAL EXPENDITURESIN BRAZILAbstractThis paper analyses Brazilian spending on environmental protection, including fe<strong>de</strong>ral,state and municipal levels, in the 2003-2010 period. Results confirmed previous studiesthat suggested a <strong>de</strong>clining trend of public expenditures (in % terms) on environmentalexpenditures at the fe<strong>de</strong>ral level, but an increasing trend at the state level. This showsthat (a) the fe<strong>de</strong>ral government is perceiving an “anti-green” growth strategy, increasingactivities that pressure the environment (especially infrastructure investment), while thespending on environmental protection remains relatively stagnated, and (b) there is animportant change in political distribution of environmental protection, with growingparticipation of state and municipal governments. It was also shown that increasingexpenditures on environmental protection do not harm social and economic<strong>de</strong>velopment, confirming the main “green economy” hypothesis.Key Words: public expenditures on environmental protection; <strong>de</strong>velopment; human<strong>de</strong>velopment in<strong>de</strong>x; <strong>de</strong>forestationHighlights: Declining trend of public expenditures on environmental expenditures at thefe<strong>de</strong>ral level. Since 2007, state governments are spending more than the Fe<strong>de</strong>ral Governmentin environmental conservation. Correlation between public expenditures on environmental conservation andHDI is positive. Correlation between <strong>de</strong>forestation and HDI is negative
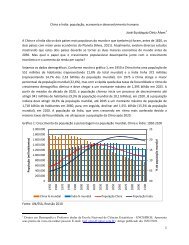
1. IntroductionOne of the pillars of greening the economy is the increase of public expendituresin activities that are associated to sustainable <strong>de</strong>velopment. Even though environmentalprotection is not the only concern for a “green” economy, it can only make sense ifthere is an improvement of the efforts in the public sector associated with environmentalprotection.The literature is relatively poor in empirical assessments of “public greenbudgets”, especially in <strong>de</strong>veloping countries. Previous studies have suggested that inBrazil, in spite of the rhetorical concern with sustainability, there was a trend of<strong>de</strong>creasing participation of environmental expenditure in the public budget 1 . However,these studies are relatively out<strong>da</strong>ted, and mostly restricted to the Fe<strong>de</strong>ral Government.The objective of this paper is to expand the empirical analysis of the publicexpenditures on environmental protection in Brazil, extending the analysis to the statelevel and consi<strong>de</strong>ring a longer period (2003-2010), in or<strong>de</strong>r to enable the <strong>de</strong>velopmentof more <strong>de</strong>tailed analysis on the subject.The analysis of public expenditure is substantially important in the Braziliancontext, because the country experiences a cycle of expansion in economic activity,strengthened after 2006. The main characteristic of this cycle is the expansion of stateintervention in the economy, with growth of public investment (specially in energy andinfrastructure areas) and the return of long term planning (Barbosa, 2010). So, the1 See, for example, Young and Roncisvalle (2002) and Young (2005).
analysis of the environmental budget is relevant to check if sustainability is a concernon this new <strong>de</strong>velopment mo<strong>de</strong>l which is been implemented.Another objective of this study is to analyse if the myths that economic<strong>de</strong>velopment and environmental conservation are concurrent goals, and that<strong>de</strong>forestation is necessary to increase employment and income and improve socialconditions, have any empirical support. A statistical analysis was elaborated to estimate(i) the correlation between public expenditures and human <strong>de</strong>velopment, at the state andmunicipal (local) levels, to check if increasing expenditures on environmentalprotection really harm social and economic <strong>de</strong>velopment and (ii) the correlationbetween <strong>de</strong>forestation and human <strong>de</strong>velopment, at the state level, to check if high levelsof <strong>de</strong>forestation are associated with increases in the economic <strong>de</strong>velopment.2. Material and methodsData on public spending was obtained from public <strong>da</strong>tabasis, open to publicaccess (Secretaria do Orçamento Fe<strong>de</strong>ral – SOF/Ministério do Planejamento, andSecretaria do Tesouro Nacional – STN/Ministério <strong>da</strong> Fazen<strong>da</strong>), referring to the Fe<strong>de</strong>ralGovernment, 26 States plus the Fe<strong>de</strong>ral District, and 5,558 municipalities.In or<strong>de</strong>r to make possible the comparison of the public expenditure <strong>da</strong>ta alongthe time in real terms, it was used the GDP <strong>de</strong>flator calculated by the Brazilian Instituteof Geography and Statistics (IBGE), consi<strong>de</strong>ring prices at 2010 Brazilian Reais (R$)(<strong>de</strong>flators are presented in Appendix 1).Development at municipal level was estimated using the FIRJAN MunicipalDevelopment In<strong>de</strong>x calculated by the Fe<strong>de</strong>ration of Industries of Rio <strong>de</strong> Janeiro(FIRJAN). IFDM is a proxy for HDI and is based on indicators of employment and
income, education and health, giving the municipality a gra<strong>de</strong> from zero to one (ascloser to one, the better the results are). The most recent <strong>da</strong>ta provi<strong>de</strong>d by IFDM waspublished in 2010, but it refers to <strong>da</strong>ta collected in 2007 – the time lag is due to the<strong>de</strong>pen<strong>de</strong>nce of external <strong>da</strong>ta for the consoli<strong>da</strong>tion of the in<strong>de</strong>x.The proxy used for measuring the threat/pressure on the environment was<strong>de</strong>forestation. This choice is justified not only by the lack of environmental indicators inthe sub national level, but also because it allows the analysis to test if <strong>de</strong>forestation isreally a necessary condition for economic <strong>de</strong>velopment. The <strong>de</strong>forestation <strong>da</strong>ta usedrefer to the period 2002-2008, and the source of the <strong>da</strong>ta varies according to the region’sbiome.Deforestation <strong>da</strong>ta were obtained at the municipal level. For the Atlantic Forest,the source was the “Atlas dos Remanescentes Florestais <strong>da</strong> Mata Atlântica”, producedby the National Spatial Research Institute (INPE) in association with the NGO SOSMata Atlântica. For the Amazon biome, <strong>de</strong>forestation <strong>da</strong>ta is provi<strong>de</strong>d by INPE. For theother biomes (“Pampa”, “Cerrado” and “Caatinga”), <strong>da</strong>ta were obtained from theMinistry of the Environment (MMA). 2008 was chosen as the base year since it was themost recent year with <strong>da</strong>ta available for all biomes.State level <strong>de</strong>forestation was obtained by adding <strong>da</strong>ta from the respectivemunicipalities. Besi<strong>de</strong>s, because of the huge disparity between state’s sizes in Brazil, itwas taken into account the percentage of <strong>de</strong>forested area, instead of its absolute value.After the formulation of the <strong>da</strong>tabase, the statistics software SPSS was used inor<strong>de</strong>r to check the proposed correlation tests. Pearson Correlation Coefficients wereused to calculate the correlation between variables. However, it is important to notice
that in the correlation analysis there is no distinction between <strong>de</strong>pen<strong>de</strong>nt an<strong>de</strong>xplanatory variable; in this sense, the correlation only measure the linear associationbetween two variables, and do not allow any causality inference between then.The first test was about the correlation between the public environmentalexpenditure and HDI levels, in or<strong>de</strong>r to try to prove that there is no conflict betweenspending in environmental issues and improving human <strong>de</strong>velopment, at both state andmunicipal level. The variable used for public expenditure was the average of thepercentage of the budget which was spent on environmental programs during 2003-2010 – this amount appears in the budget allocation un<strong>de</strong>r the subscript EnvironmentalManagement. The average was used in or<strong>de</strong>r to try to mitigate the huge oscillation ofbudget <strong>da</strong>ta, what is quite common, specially in small municipalities.Secondly, we tested the correlation between HDI levels and <strong>de</strong>forestation, inor<strong>de</strong>r to clarify if <strong>de</strong>forestation actually leads to improvement in the socio-economicconditions – this test was carried out only at the state level. The variable used for<strong>de</strong>forestation was the average percentage of <strong>de</strong>forested area between 2002-2008, perstate. After that, a double tailed t test was carried out to verifiy the statistic significanceof the coefficients.3. Results3.1 Fe<strong>de</strong>ral budgetThe recent expansion of economic activity on Brazil is strongly associated withthe growth of public investment, specially in energy and infrastructure areas. Thecornerstone of this strategy was the promulgation of the Program for GrowthAcceleration (PAC) in January 2007, in the beginning of Presi<strong>de</strong>nt Lula’s second term.
The program predicted more than five hundred billions of Brazilian Reais in publicinvestment between 2007 and 2010, divi<strong>de</strong>d in three main areas: energy, logistic andsocial infrastructure.Besi<strong>de</strong>s that, in the end of Lula’s second term, the government launched PAC 2,which continues as a very important program of Roussef’s current government, showingthe maintenance of the state-driven strategy; the program predicts more than ninehundred billions of Brazilian Reais in public investment between 2011 and 2014,mainly in the infrastructure area.The analysis of SOF <strong>da</strong>ta confirms that, together with the objectives of the PAC,the public expenditure in infra-structure projects sky-rocketed in the last few years.From 2003 to 2010, the fe<strong>de</strong>ral government expenditure in infra-structure raised anastonishing 295%; the bigger part of this growth occurred after 2007, due to theimplementation of PAC projects. Figure 1 shows the evolution of the Fe<strong>de</strong>ralGovernment expenditure in the infrastructure area between 2003 and 2010, in millionsof Brazilian Reais (R$).
Figure 1 – Fe<strong>de</strong>ral Government discretionary 2 expenditure on infrastructure (2010R$ Millions)Source: Own elaboration through <strong>da</strong>tabase provi<strong>de</strong>d by SOF.The practical result of this process was the increase of infrastructureinvestments, with the counterpart of higher pressure on the environmental authorities,both for the emission of licences and for the supervision of the implementation of theseprojects. However, since expenditures on infrastructure projects were not beingmatched-up with an increase on the budget of public environmental agencies, theconsequence was the poor environmental management of these new projects.The Ministry of the Environment (MMA) is the main institution regardingenvironmental management at the fe<strong>de</strong>ral level. So, the MMA budget was used toanalyze the evolution of the fe<strong>de</strong>ral expenditure in environmental issues. The results2 Discretionary expenses refer to expenditures directly related to the main purpose of the activity, notincluding public spending on wages, pensions and interests.
shows that the MMA budget remained almost stagnated between 2003 and 2010, whilethe budgets of the Ministries of Transport and Cities had a significant rise.The Ministry of Transport budget rose from R$ 3,467 million in 2003 to R$15,665 million in 2010 (growth of 351.8% over the period), while the Ministry of Citiesbudget grew 863.8% over the same period. On the other hand, the MMA’s budget grewonly of 13.1% between 2003-2010, and had never surpassed R$ 700 million over theseyears.Figure 2 – Discretionary expenditure of the Fe<strong>de</strong>ral Government for selectedministries (2010 R$ Millions)Source: Own elaboration through SOF <strong>da</strong>ta.
So, it is clear that <strong>de</strong>spite being an important actor in the management ofinfrastructure projects, the Ministry of the Environment has not being properly treatedin the redistribution and allocation within the fe<strong>de</strong>ral budget (Figure 3).Figure 3 – Ministry of Environment share over Fe<strong>de</strong>ral Government discretionaryexpenditure in infrastructure areaSource: Own elaboration through SOF <strong>da</strong>taThe other <strong>da</strong>ta source for the Fe<strong>de</strong>ral Government expenditure (BrazilianNational Treasury - STN) classifies the expenditures according to functions. The results,nevertheless, remained the same: environmental related expenditures have beenstagnated, while expenditure in infra-structure is growing at fast rates. For example,expenditures un<strong>de</strong>r the subscript “Transport” rose 128,9% between 2003-2010, whileexpenditures un<strong>de</strong>r the subscript “Environmental Management” grew only 20,8% overthe same period.
This discrepancy is even bigger if analysis is restricted to 2006-2010: whileenvironmental related programs budget only rose by 0.7% (reduced to 0.19% of thefe<strong>de</strong>ral budget in 2010), transport expenditures rose 33.1% (Figure 4).Figure 4 – Fe<strong>de</strong>ral Budget – expenses classified by their function (2010 R$Millions)Source: Own elaboration through STN <strong>da</strong>ta3.2 States budgetThe following functions were analyzed on state level budgets: Transport,Environmental Management, Housing, Sanitation and Urban Affairs. Again, valueswere converted to 2010 prices using the GDP <strong>de</strong>flator and then aggregated over theperiod 2003-2010.
Table 2 and Figure 5 show that, differently from the fe<strong>de</strong>ral government,spending on environmental management remained relatively stable, with a light risingtrend in 2003-2010 periodTable 2 – Average share of selected functions on the total of discretionaryaggregate state expenditures (2003-2010)Environmental Management 0.8%Transportation 3.1%Urban affairs 11.1%Housing 0.9%Sanitation 2.8%Source: Own elaboration through STN <strong>da</strong>ta
Figure 5 – Relative share of the total of discretionary aggregate state expendituresper selected functions (2003-2010)Source: Own elaboration through STN <strong>da</strong>taDue to the huge disparity between Brazilian states in terms of their absolutebudgets, we used the average share of expenditure in the function EnvironmentalManagement over the period 2003-2010 for the comparison between states. Table 3shows that the average share of the function Environmental Management in total statepublic budgets is around 0.8% over the period 2003-2010. However, there is a wi<strong>de</strong>range between individual states, oscillating between 0.20% and 1.17%.
Table 3 – Average share of the total budget for function EnvironmentalManagement (2003-2010)Amapá 1.17% São Paulo 0.80% Piauí 0.47%Paraná 1.17% Sergipe 0.77% Pernambuco 0.37%Ceará 1.15% Acre 0.74% Roraima 0.33%Espírito Santo 1.11% Santa Catarina 0.72% Alagoas 0.24%Paraíba 1.11% Goiás 0.67%MatoGrosso 0.24%Tocantins 1.02%Mato Grosso doSul 0.54% Maranhão 0.23%Rio Gran<strong>de</strong> doSul 0.97% Pará 0.53% Bahia 0.22%Minas Gerais 0.94%Rio Gran<strong>de</strong> doNorte 0.52% Roraima 0.20%Rio <strong>de</strong> Janeiro 0.90% Amazonas 0.47% ‐ ‐Source: Own elaboration through STN <strong>da</strong>ta3.3 Comparison States x Fe<strong>de</strong>ral BudgetThe analysis of the Fe<strong>de</strong>ral Budget showed a stagnation of the budget of theMinistry of Environment, while the budget of both Ministries of Transport and Citiesgrew substantially over the period 2003-2010. On the other hand, at the state level, theanalysis of aggregate state budget showed that, <strong>de</strong>spite having different patterns of shareover the total budget, none of the analyzed functions had a huge increase over the sameperiod, with relative stability of their share.One of the results of this process can be seen in Figure 6: since 2007, theaggregate environmental spending by states surpassed fe<strong>de</strong>ral governmentenvironmental expenditures.
Figure 6 – Expenditures in function Environmental Management in the period2003-2010 (2010 R$ Millions)Source: Own elaboration through STN <strong>da</strong>taThe analysis in terms of percentages also confirms that, when it comes to budgetallocation, environmental issues have a more relevant role on the state policy incomparison to the fe<strong>de</strong>ral policy (Figure 7). While expenditures in the functionEnvironmental Management represented about 0.8% of the total state expenditure along2003-2010, this share is reduced to about 0.2% for the fe<strong>de</strong>ral budget – so, inpercentage terms, environmental spending by the Fe<strong>de</strong>ral Government is about the sameas the Roraima State, the one with the smallest value in Table 3.
Figure 2 – Evolution of the relative share of expenditures in functionEnvironmental Management (2003-2010)Source: Own elaboration through STN <strong>da</strong>ta3.4. Correlation testsIf expenditures in environmental conservation were an obstacle to economic<strong>de</strong>velopment, thus states that <strong>de</strong>stine bigger shares of their budgets to environmentalconservation should present lower levels of HDI. However, the statistical analysiscarried out in this study shows that this myth has no empirical support – in fact, thecorrelation between these variables is positive. As explained in section 2, we used theaverage share of expenditure in function Environmental Management over the period2003-2010, both for state and municipal levels, and FIRJAN Human DevelopmentIn<strong>de</strong>x as a proxy for human <strong>de</strong>velopment.
At the state level (26 observations), the correlation coefficient was 0.423,statistically significant at 5%, and at the municipal level (5,558 observations), thecorrelation coefficient was 0.129, statistically significant at 1%. The lower statisticsignificance found for the states is due to the small sample, while the lower coefficientfound for municipalities can be explained by the huge presence of outliers(municipalities with 0% of public spending over the analyzed period) in the sample. 3Figures 8 and 9 show the dispersion between average environmental expenditureand HDI, and after their analysis, it is clear that the relation between these variable ispositive. As discussed before, since we only did a correlation test, it is not possible tomake any further comment about the causality between these variables – nevertheless,the trend line presented in the graphs suggests that they are positive related. Forinstance, the existence of positive correlation between these variables is sufficient torefute the analyzed myth.3 From the 5,558 municipalities analyzed, 2.388 (about 43% of the sample) had average expenditure infunction Environmental Management for the period 2003-2010 lower than 0.05% of their budget, and1,535 (about 27.5% of the sample) showed average environmental expenditure equal to zero for the sameperiod.
Figure 8 – Average expenditure in Environmental Management (2003-2010) versusIFDM 2010 at state levelSource: Own elaboration through STN and FIRJAN <strong>da</strong>ta.
Figure 9 - Average expenditure in Environmental Management (2003-2010) versusIFDM 2010 at municipal levelSource: Own elaboration through STN and FIRJAN <strong>da</strong>ta.One interesting aspect of the municipal level <strong>da</strong>ta is that the averageenvironmental expenditure also presents positive correlation with the Employment andIncome component of the IFDM. The correlation coefficient between the variables was0.167, statistically significant at 1%, suggesting that spending in the environmental areacan stimulate job creation and income generation, instead of harming economic<strong>de</strong>velopment.
One possible counter-argument is that higher economic activity levels,associated with higher HDI levels, would represent higher pressure on natural resources,thus increasing the need of environmental protection efforts. To test this hypothesis, it isnecessary to i<strong>de</strong>ntify <strong>da</strong>ta for environmental stress that are comparable at state ormunicipal levels, a very difficult task consi<strong>de</strong>ring the lack of information onenvironmental conditions at the sub-national level.The chosen variable was the average <strong>de</strong>forested area between 2002-2008 at thestate level, and if the argument cited above was right, the correlation between theaverage <strong>de</strong>forested area and the HDI should be positive – bigger <strong>de</strong>velopment levelsshould come together with bigger losses of forested area.However, the results showed that states that presented higher forest lossespresented lower HDI levels – the correlation coefficient was -0.418, statisticallysignificant at 5%. Again, even without a linear regression, the trend line presented inFigure 10 suggests that the relation between the analyzed variables is negative andsignificant.In addition, the relation between the average <strong>de</strong>forested area and theEmployment and Income component of the IFDM is also negative, with a biggercorrelation coefficient (-0.461), also statistically significant at 5%. This resultsconfirmed previous studies 4that argued that allowing more <strong>de</strong>forestation do notimprove <strong>de</strong>velopment conditions, and, at least for the <strong>de</strong>forestation problem, higherhuman <strong>de</strong>velopment do not represent a higher pressure on natural resources than in asituation of worse economic or social conditions.4 See, for example, Young (2006) and Young and Neves (2009).
Figure 10 - Average <strong>de</strong>forested area (2002-2008) versus IFDM 2010 at state levelSource: Own elaboration through FIRJAN, SOS Mata Atlântica, PMDBBS and INPE <strong>da</strong>ta.4. Discussion and conclusionsThis study provi<strong>de</strong>s several conclusions. First of all, the analysis of the Fe<strong>de</strong>ralBudget confirmed the <strong>de</strong>clining trend of public expenditures (in percentage terms) onenvironmental expenditures. Despite the huge growth of the budget for theinfrastructure area, the budget for the environmental area remained stagnated over theperiod 2003-2010 – this situation became more explicit after 2007, with theimplementation of PAC. This shows that the Fe<strong>de</strong>ral Government is following an “antigreen”growth strategy, in the sense that activities that pressure the environment(especially infrastructure investment, such as <strong>da</strong>ms and road building) are receivingmore resources, while the expenditure on environmental protection remains relativelystagnated.
Another negative consequence of this strategy is the worsening of environmentalmanagement of infrastructure projects in Brazil, since the implementation of newprojects amplifies the <strong>de</strong>mand for licensing and supervision from the environmentalauthorities, but these authorities does not have an increase on their budgets as acounterpart to enable the realization of this extra <strong>de</strong>mand.Besi<strong>de</strong>s, it is important to point out that environmental authorities in Brazilalready suffer from lack of material and human resources – for example, analysing theNational System of Conservation Units, Me<strong>de</strong>iros and Young (2011) showed that theproportion between area inclu<strong>de</strong>d in the environmental conservation system and officialemployee on supervision of the area in Brazil is one of the worst in the world. While inSouth Africa and the United States this proportion is, respectively, of one employee foreach 1,176 ha and 2,125 ha, in Brazil the proportion is of one employee for 18,600 ha –an area that, in practical terms, corresponds to approximately the area of 20,000 officialfootball fields per one person.The comparison between the fe<strong>de</strong>ral and the state budgets for environmentalconservation showed that there is an important change in the political distribution ofenvironmental policy: since 2007, state governments are spending more (in absoluteterms) than the Fe<strong>de</strong>ral government in the area, thus playing a major role in themanagement of natural resources in Brazil.Additionally, the statistical test carried out on this study proved that the myththat environmental conservation is an obstacle to economic <strong>de</strong>velopment does not haveempirical sustenance. If this myth was right, the correlation between publicenvironmental spending and human <strong>de</strong>velopment levels should be negative; however,
esults showed that the correlation between these two variables is positive, both for stateand municipal levels.However, it is important to point out that the focus of the analysis was not theabsolute value of the coefficient, but the direction of the correlation – since it ispositive, the result is sufficient to refute the myth. Even though no causality tests weretaken, these results suggest that increasing expenditures on environmental protection donot harm social and economic <strong>de</strong>velopment, confirming the main hypothesis of the“green economy” strategy.One possible counter-argument is that higher economic activity levels,associated with higher HDI levels, would represent higher pressure on natural resources,thus increasing the need of environmental protection efforts. To test this hypothesis, it isnecessary to i<strong>de</strong>ntify <strong>da</strong>ta for environmental stress that are comparable at state ormunicipal levels, a very difficult task consi<strong>de</strong>ring the lack of information onenvironmental conditions at the sub-national level. As discussed in section 2, the chosenvariable was <strong>de</strong>forestation, and the results showed that states with higher forest lossespresented lower HDI levels: the coefficient correlation was – 0.418, statisticallysignificant at 5%.To sum up, this paper shows that, <strong>de</strong>spite the fact that the myths opposingenvironmental protection and <strong>de</strong>velopment do not survive to a statistic analysis, it seemsthat they are not totally overwhelmed by public authorities in budget <strong>de</strong>cisions,especially at the fe<strong>de</strong>ral level, which persist in the conventional view that increases inenvironmental protection harm (instead of improve) the economy and <strong>de</strong>velopment.
As a result, unfortunately, the amount of public resources allocated on theenvironmental area is <strong>de</strong>risive if compared to the economic potential of activities thatconjugate environmental conservation and economic growth. What policy makersshould take in consi<strong>de</strong>ration is that these two objectives are not antagonists – in fact,environmental conservation can be an stimulus to economic growth, specially in poorareas.Public policies have a major role on the implementation of these activities, toguarantee that the environmental aspect is effectively incorporated on the Brazilian<strong>de</strong>velopment trajectory for the next years. Conciliate environmental conservation an<strong>de</strong>conomic <strong>de</strong>velopment guarantees not only more growth, but essentially, better growth.
Appendix 1GDP <strong>de</strong>flator calculated by the Brazilian Institute of Geography and Statistics(IBGE), consi<strong>de</strong>ring prices at 2010 Brazilian Reais (R$)DEFLATOR2002 1,8747122003 1,6958052004 1,491082005 1,3801182006 1,2873042007 1,2127212008 1,1454812009 1,05742010 1Source: Own elaboration through the Brazilian Institute of Geography and Statistics (IBGE)
ReferencesBARBOSA, N.; SOUZA, J. A. P. A inflexão do governo Lula: política econômica,crescimento e distribuição <strong>de</strong> ren<strong>da</strong>. In: SADER, E.; GARCIA, M. A. (Orgs.).Brasil:entre o passado e o futuro. 1. ed, São Paulo: Editora Boitempo, 2010.MEDEIROS, R.; YOUNG, C. E. F. (eds.). Contribuição <strong>da</strong>s uni<strong>da</strong><strong>de</strong>s <strong>de</strong> conservaçãobrasileiras para a economia nacional: Relatório Final. Brasília: UNEP-WCMC,120p., 2011.MIN<strong>IS</strong>TÉRIO DO MEIO AMBIENTE. Projeto <strong>de</strong> Monitoramento doDesmatamento dos Biomas Brasileiros por Satélite (PMDBBS). Disponível em:.SECRETARIA DO TESOURO NACIONAL (STN). Finanças do Brasil: Dadoscontábeis dos municípios. Disponível em:.FEDERAÇÃO DAS INDÚSTRIAS DO ESTADO DO RIO DE JANEIRO (Firjan).Índice Firjan <strong>de</strong> Desenvolvimento Municipal. Edição 2010, ano base 2007.Disponível em: .FUNDAÇÃO SOS MATA ATLÂNTICA. Atlas <strong>da</strong> evolução dos remanescentesflorestais e ecossistemas associados no domínio <strong>da</strong> mata atlântica no período 2000-2005 e 2005-2008.São Paulo: SOS Mata Atlântica.MOORE, D. S. The basic practice of statistics. New York: Freeman, 2007.
SECRETARIA DO TESOURO NACIONAL (STN). Finanças do Brasil: Dadoscontábeis dos municípios. Disponível em:. YOUNG, C. E. F.(2005). “Financial Mechanisms for Conservation in Brazil”. Conservation Biology:v.19, n.3 (June), p.756-761.YOUNG, C. E. F., RONC<strong>IS</strong>VALLE, C. A. Expenditures, investment and financingfor sustainable <strong>de</strong>velopment in Brazil. U.N. Comisión Económica para AméricaLatina y el Caribe (CEPAL), Santiago, 2002.______; NEVES, A. C. M. Destroying the myth: <strong>de</strong>forestation, rural employmentand human <strong>de</strong>velopment in the Brazilian Atlantic forest. IV Congreso <strong>de</strong> laAsociación Latinoamericana y <strong>de</strong>l Caribe <strong>de</strong> Economistas Ambientales y <strong>de</strong> RecursosNaturales. Heredia: UNA – Universi<strong>da</strong>d Nacional Costa Rica, 2009.______; Desenvolvimento e meio ambiente: uma falsa incompatibili<strong>da</strong><strong>de</strong>. RevistaCiência Hoje, v. 36, n. 211, p. 30-34, 2004.______;. “Financial Mechanisms for Conservation in Brazil”. Conservation Biology:v.19, n.3 (June), p.756-761, 2005.______; LUSTOSA, M. C .J. A questão ambiental no esquema centro-periferia.Revista Anpec, v. 4, n.2, 2003.