Miller & Levine Biology - Pearson
Miller & Levine Biology - Pearson
Miller & Levine Biology - Pearson
Create successful ePaper yourself
Turn your PDF publications into a flip-book with our unique Google optimized e-Paper software.
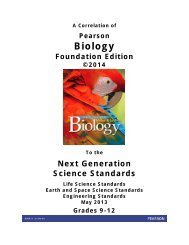
HS-ESS3 Earth and Human ActivityA Correlation of<strong>Miller</strong> & <strong>Levine</strong> <strong>Biology</strong>, ©2014to the Next Generation Science Standards, May 2013Grades 9-12HS-ESS3 Earth and Human ActivityStudents who demonstrate understanding can:HS-ESS3-1. Construct an explanation based on evidence for how the availability of natural resources, occurrence of naturalhazards, and changes in climate have influenced human activity. [Clarification Statement: Examples of key natural resources include access to freshwater (such as rivers, lakes, and groundwater), regions of fertile soils such as river deltas, and high concentrations of minerals and fossil fuels. Examples of natural hazards can befrom interior processes (such as volcanic eruptions and earthquakes), surface processes (such as tsunamis, mass wasting and soil erosion), and severe weather (such as hurricanes,floods, and droughts). Examples of the results of changes in climate that can affect populations or drive mass migrations include changes to sea level, regional patterns oftemperature and precipitation, and the types of crops and livestock that can be raised.]MILLER & LEVINE BIOLOGY: Lesson 5.2 (pp. 140–141) explains how natural disasters are a limiting factor for population growth. Lesson6.2 (pp. 160–162) discusses the importance of freshwater for humans. Lesson 24.4 (pp. 715–718) focuses on the effect of agriculture onhuman civilizations.Students construct an explanation for how natural resources, natural hazards, or climate influence human activity: Students explore howthe presence or absence of trees affected the inhabitants of Easter Island (pp. 153 and 183). Students explain how the domestication of acrop contributed to the rise of civilization in a specific region (p. 719).HS-ESS3-3. Create a computational simulation to illustrate the relationships among management of natural resources, thesustainability of human populations, and biodiversity. [Clarification Statement: Examples of factors that affect the management of natural resources includecosts of resource extraction and waste management, per-capita consumption, and the development of new technologies. Examples of factors that affect human sustainability includeagricultural efficiency, levels of conservation, and urban planning.] [Assessment Boundary: Assessment for computational simulations is limited to using provided multi-parameterprograms or constructing simplified spreadsheet calculations.]MILLER & LEVINE BIOLOGY: Chapter 6 (pp. 154–172) discusses the effect of human activity on the environment.Students create a computational simulation to illustrate the relationship between management of natural resources and biodiversity:Students use mathematical and computational tools to analyze data about the genetic decline of alpine chipmunks due to climate changecaused by human activities (pp. 447a–447b).HS-ESS3-4. Evaluate or refine a technological solution that reduces impacts of human activities on natural systems.*[Clarification Statement: Examples of data on the impacts of human activities could include the quantities and types of pollutants released, changes to biomass and species diversity,or areal changes in land surface use (such as for urban development, agriculture and livestock, or surface mining). Examples for limiting future impacts could range from local efforts(such as reducing, reusing, and recycling resources) to large-scale geoengineering design solutions (such as altering global temperatures by making large changes to the atmosphereor ocean).]MILLER & LEVINE BIOLOGY: Lessons 6.1, 6.2, and 6.3 (pp. 156–172) focus on the impact of humans on the environment.Students evaluate or refine a technological solution that reduces impacts of human activities on natural systems: Students evaluateways to reduce dry trash (Quick Lab, p. 155). Students design a green roof system for a building (pp. 571a–571b).HS-ESS3-5. Analyze geoscience data and the results from global climate models to make an evidence-based forecast of thecurrent rate of global or regional climate change and associated future impacts to Earth systems. [Clarification Statement: Examples ofevidence, for both data and climate model outputs, are for climate changes (such as precipitation and temperature) and their associated impacts (such as on sea level, glacial icevolumes, or atmosphere and ocean composition).] [Assessment Boundary: Assessment is limited to one example of a climate change and its associated impacts.]MILLER & LEVINE BIOLOGY: Case Study #3 in lesson 6.4 (pp. 177–179) addresses the causes and effects of climate change.Students analyze geoscience data about global climate change: Students analyze data on air temperature, sea ice, sea level, andgreenhouse gas emissions (pp. 177–178).HS-ESS3-6. Use a computational representation to illustrate the relationships among Earth systems and how thoserelationships are being modified due to human activity. [Clarification Statement: Examples of Earth systems to be considered are the hydrosphere,atmosphere, cryosphere, geosphere, and/or biosphere. An example of the far-reaching impacts from a human activity is how an increase in atmospheric carbon dioxide results in anincrease in photosynthetic biomass on land and an increase in ocean acidification, with resulting impacts on sea organism health and marine populations.] [Assessment Boundary:Assessment does not include running computational representations but is limited to using the published results of scientific computational models.]MILLER & LEVINE BIOLOGY: Lesson 3.4 (pp. 79–85) describes biogeochemical cycles. Lessons 6.1, 6.2, 6.3, and 6.4 (pp. 152–179)address ways humans modify Earth’s systems.Students use computational representations to illustrate relationships among Earth’s systems: Students interpret data about the effect ofrainfall on plant productivity (p. 92). Students interpret data on air pollution trends (Analyzing Data, p. 164). Students compare data onland-surface air temperature, global sea ice, and global sea level (p. 177).The performance expectations above were developed using the following elements from the NRC document A Framework for K-12 Science Education:SE = Student Edition; TE = Teacher’s Edition; LMA = Lab Manual A 21


