On the Characteristics of Fires in Tunnels
On the Characteristics of Fires in Tunnels
On the Characteristics of Fires in Tunnels

You also want an ePaper? Increase the reach of your titles
YUMPU automatically turns print PDFs into web optimized ePapers that Google loves.
<strong>On</strong> <strong>the</strong> <strong>Characteristics</strong> <strong>of</strong> <strong>Fires</strong> <strong>in</strong> <strong>Tunnels</strong>Doctoral ThesisAnders LönnermarkSubmitted for <strong>the</strong> degree <strong>of</strong> Doctor <strong>of</strong> Philosophyat <strong>the</strong>Department <strong>of</strong> Fire Safety Eng<strong>in</strong>eer<strong>in</strong>gLund Institute <strong>of</strong> TechnologyLund UniversityLund 2005
Department <strong>of</strong> Fire Safety Eng<strong>in</strong>eer<strong>in</strong>gLund Institute <strong>of</strong> TechnologyLund UniversityBox 118, SE-221 00 LundSwedenReport 1033ISSN 1402-3504ISRN LUTVDG/TVBB--1033--SEISBN 91-628-6637-0© Anders Lönnermark, 2005Pr<strong>in</strong>ted by Tryckeriet i E-huset, Lund University, Lund, SwedenSeptember 2005Front page photo: Large-scale fire test carried out <strong>in</strong> <strong>the</strong> Runehamar tunnel, Norway,2003 (photo by Haukur Ingason)
“I will tell you what knowledge is.To know when you know someth<strong>in</strong>g,and to know when you do not,that is knowledge.”Konfucius
AbstractImportant phenomena related to tunnel fires are presented <strong>in</strong>clud<strong>in</strong>g both experimentaland <strong>the</strong>oretical work. The ma<strong>in</strong> focus is on <strong>the</strong> large-scale fire tests performed<strong>in</strong> 2003, <strong>in</strong> <strong>the</strong> Runehamar tunnel <strong>in</strong> Norway. Dur<strong>in</strong>g <strong>the</strong>se tests heat release rate(HRR), temperatures, gas concentrations (O 2 , CO 2 , CO, HCN, and H 2 O), velocities,radiation, and smoke were measured. Four tests with a set-up simulat<strong>in</strong>g HGV cargoswere performed with fuel loads constitut<strong>in</strong>g <strong>of</strong> different mixtures <strong>of</strong> cellulose andplastic. The fuel load ranged from 2850 kg to 11010 kg giv<strong>in</strong>g maximum HRRsbetween 66 MW and 202 MW.The results showed that ord<strong>in</strong>ary (non-hazardous) cargo can give HRRs andtemperatures normally expected to be related only to hazardous goods (e.g. tankerfires). Thus, <strong>the</strong> highest HRR and gas temperature were far higher than thatsuggested by most tunnel design guidel<strong>in</strong>es. A close correlation between <strong>the</strong>maximum HRR and energy content is presented for passenger cars and HGVs. It hasalso been shown <strong>in</strong> <strong>the</strong> Runehamar tests that <strong>the</strong> fire <strong>in</strong> an HGV can spread a longdistance downstream <strong>in</strong> a tunnel, <strong>of</strong> <strong>the</strong> order <strong>of</strong> 100 m. Based on <strong>the</strong> test results andreal <strong>in</strong>cidents one must emphasize <strong>the</strong> importance <strong>of</strong> <strong>the</strong> <strong>in</strong>cident operation dur<strong>in</strong>g<strong>the</strong> first five to ten m<strong>in</strong>utes <strong>of</strong> <strong>the</strong> fire. The actions <strong>of</strong> <strong>the</strong> people <strong>in</strong>side <strong>the</strong> tunnel and<strong>the</strong> rescue personnel dur<strong>in</strong>g this time period can be crucial to <strong>the</strong> outcome.Dur<strong>in</strong>g two <strong>of</strong> <strong>the</strong> fire tests, large pulsations <strong>of</strong> <strong>the</strong> gas flow <strong>in</strong>side <strong>the</strong> tunnel wereobserved. These pulsations were registered only when <strong>the</strong> measured heat release ratewas higher than 125 MW - 135 MW. Two different periods <strong>of</strong> pulsations wereregistered, short periods <strong>of</strong> approximately 4 s and longer periods <strong>of</strong> approximately18 s. The pulsations are presented and explanations are given, us<strong>in</strong>g two differentapproaches: an acoustic approach and a frequency response analysis based on animpedance approach. The <strong>in</strong>tr<strong>in</strong>sic resonances <strong>of</strong> <strong>the</strong> system proved to be close to <strong>the</strong>periods found <strong>in</strong> <strong>the</strong> experiments. Several factors can affect <strong>the</strong> pulsations, but <strong>the</strong>calculations show that <strong>the</strong> oscillation periods are properties <strong>of</strong> <strong>the</strong> system.O<strong>the</strong>r issues discussed <strong>in</strong>clude backlayer<strong>in</strong>g and <strong>the</strong> effect <strong>of</strong> <strong>the</strong> ventilation on <strong>the</strong>HRR, flame length, and <strong>the</strong> conditions <strong>in</strong> <strong>the</strong> tunnel. Literature data are, whererelevant, compared with <strong>the</strong> results from <strong>the</strong> Runehamar tests. In this analysistoxicity and <strong>the</strong> effect <strong>of</strong> <strong>the</strong> ventilation conditions on <strong>the</strong> gas composition <strong>in</strong> <strong>the</strong>tunnel are also <strong>in</strong>cluded. Special attention was paid to <strong>the</strong> CO/CO 2 ratio and itsdependence on <strong>the</strong> ventilation and combustion conditions. In this context resultsfrom a detailed study <strong>of</strong> <strong>the</strong> emissions from an enclosure fire under varied ventilationconditions are used as <strong>the</strong> basis for a discussion <strong>of</strong> <strong>the</strong> impact <strong>of</strong> ventilation on <strong>the</strong>acute toxicity <strong>of</strong> <strong>the</strong> fire gases.Key words: tunnel fire, experiments, heat release rate, temperature, fire spread,ventilation, backlayer<strong>in</strong>g, pulsations, <strong>the</strong>rmoacoustic <strong>in</strong>stability,equivalence ratio, emissions, gas concentrations, toxicity.i
<strong>On</strong> <strong>the</strong> <strong>Characteristics</strong> <strong>of</strong> <strong>Fires</strong> <strong>in</strong> <strong>Tunnels</strong>AcknowledgementsFirst <strong>of</strong> all I would like to thank my colleague and friend Dr Haukur Ingason at SPFire Technology, who acted as deputy supervisor and has <strong>in</strong>spired me dur<strong>in</strong>g <strong>the</strong>work with guidance, collaboration, and <strong>in</strong>terest<strong>in</strong>g discussions. His hard work dur<strong>in</strong>g<strong>the</strong> <strong>in</strong>itial phase was essential for mak<strong>in</strong>g it possible to perform <strong>the</strong> tests <strong>in</strong> <strong>the</strong>Runehamar tunnel.I would also like to thank my supervisor Pr<strong>of</strong>essor Göran Holmstedt at <strong>the</strong> Department<strong>of</strong> Fire Safety Eng<strong>in</strong>eer<strong>in</strong>g, Lund University for advices and SP, Pr<strong>of</strong>essor UlfWickström, and Dr Margaret Simonson for mak<strong>in</strong>g it possible for me to perform myPhD studies. Dr Bror Persson is acknowledged for be<strong>in</strong>g <strong>the</strong> person who made mestart with <strong>the</strong> studies <strong>in</strong> <strong>the</strong> first place and also for <strong>in</strong>terest<strong>in</strong>g discussions regard<strong>in</strong>g<strong>the</strong> pulsations <strong>in</strong> <strong>the</strong> Runehamar tunnel.Special thanks go to Mr Henry Persson who was my first head <strong>of</strong> section at SP ands<strong>in</strong>ce <strong>the</strong>n has been a partner <strong>in</strong> many research project and a good friend and mentor.Per Blomqvist is <strong>the</strong> co-author <strong>of</strong> two <strong>of</strong> <strong>the</strong> papers <strong>in</strong> this <strong>the</strong>sis. In addition to thiswork, we have collaborated <strong>in</strong> a number <strong>of</strong> research projects, both experimental ando<strong>the</strong>rwise. I would like to thank him for an <strong>in</strong>terest<strong>in</strong>g journey <strong>of</strong> collaboration so farand I hope for more co-operation <strong>in</strong> <strong>the</strong> future.Much <strong>of</strong> <strong>the</strong> work has been experimental and would not have been possible without<strong>the</strong> fantastic technicians at SP Fire Technology. They always see <strong>the</strong> solutions<strong>in</strong>stead <strong>of</strong> <strong>the</strong> problems <strong>in</strong> <strong>the</strong>ir work and <strong>the</strong>reby have always managed toaccomplish my requests regard<strong>in</strong>g experimental set-ups. Therefore, Joel Blom,Michael Magnusson, Joel Blom, Markus Lönnmark, and Ari Palo-Oja are acknowledgedfor <strong>the</strong>ir <strong>in</strong>valuable help. The rest <strong>of</strong> my colleagues at SP Fire Technology areacknowledged for be<strong>in</strong>g a part <strong>of</strong> <strong>the</strong> nice and <strong>in</strong>spir<strong>in</strong>g atmosphere, mak<strong>in</strong>g <strong>the</strong>work easier to perform. I am also <strong>in</strong>debted to SP’s librarian Helene Ekström, who <strong>in</strong>a nice and quick manner has helped me to obta<strong>in</strong> copies <strong>of</strong> different k<strong>in</strong>ds <strong>of</strong>literature, stretch<strong>in</strong>g back to <strong>the</strong> 19 th century. Dr Sven-Inge Möller at CombustionPhysics, Lund University is acknowledged for describ<strong>in</strong>g <strong>the</strong> use <strong>of</strong> pulse combustorstoday.All <strong>the</strong> papers, upon which this <strong>the</strong>sis is based, conta<strong>in</strong> large experimental parts. Thiswork would not have been possible without fund<strong>in</strong>g. The follow<strong>in</strong>g organizations aregratefully acknowledged for <strong>the</strong> f<strong>in</strong>ancial support and co-operation: <strong>the</strong> SwedishRescue Services Agency, <strong>the</strong> Swedish Fire Research Board, <strong>the</strong> Swedish RoadAdm<strong>in</strong>istration, <strong>the</strong> Swedish Rail Adm<strong>in</strong>istration, <strong>the</strong> European Commission, PromatInternational, Gerco Beveilig<strong>in</strong>gen B.V., B I G Brandschutz Innovationen, and <strong>the</strong>Norwegian Road Adm<strong>in</strong>istration.F<strong>in</strong>ally, my special thanks go to my wonderful wife Anne who has supported me allthrough this work and for hav<strong>in</strong>g patience with me cover<strong>in</strong>g <strong>the</strong> d<strong>in</strong>ner table withpapers and hav<strong>in</strong>g <strong>the</strong> lap top on <strong>the</strong> c<strong>of</strong>fee table, and to my son Andreas anddaughter Johanna who have been understand<strong>in</strong>g when <strong>the</strong>ir fa<strong>the</strong>r has been abroad orgenerally absent-m<strong>in</strong>ded.ii
List <strong>of</strong> publicationsThis <strong>the</strong>sis is based on <strong>the</strong> follow<strong>in</strong>g papers:I. Lönnermark, A. and Ingason, H., “Gas Temperatures <strong>in</strong> Heavy GoodsVehicle <strong>Fires</strong> <strong>in</strong> <strong>Tunnels</strong>”, Fire Safety Journal, 40, 506-527, 2005.II.III.IV.Ingason, H. and Lönnermark, A., “Heat Release Rates from Heavy GoodsVehicle Trailer <strong>Fires</strong> <strong>in</strong> <strong>Tunnels</strong>”, Fire Safety Journal, (<strong>in</strong> press).Blomqvist, P. and Lönnermark, A., “Characterization <strong>of</strong> <strong>the</strong> CombustionProducts <strong>in</strong> Large-scale Fire Tests: Comparison <strong>of</strong> Three Experimental Configurations”,Fire and Materials, 25, 71-81, 2001.Lönnermark, A. and Blomqvist, P., “Emissions from an Automobile Fire”,Chemosphere, (<strong>in</strong> press).V. Lönnermark, A. and Ingason, H., “Acoustic Considerations Regard<strong>in</strong>gPulsations dur<strong>in</strong>g Large-Scale Fire Tests <strong>in</strong> a Tunnel”, Fire Safety Science -Proceed<strong>in</strong>gs <strong>of</strong> <strong>the</strong> Eighth International Symposium, Beij<strong>in</strong>g, Ch<strong>in</strong>a, 18-23September, 2005, (<strong>in</strong> press).VI.VII.Lönnermark, A., Persson, B., and Ingason, H., “Pulsations dur<strong>in</strong>g Large-Scale Fire Tests <strong>in</strong> <strong>the</strong> Runehamar Tunnel”, (submitted to Fire SafetyJournal).Lönnermark, A. and Ingason, H., “Fire Spread and Flame Length <strong>in</strong> Large-Scale Tunnel <strong>Fires</strong>”, Fire Technology, (<strong>in</strong> press).In addition to <strong>the</strong> papers <strong>in</strong>cluded <strong>in</strong> <strong>the</strong> <strong>the</strong>sis <strong>the</strong> author has also contributed to <strong>the</strong>follow<strong>in</strong>g publications:VIII.IX.Blomqvist, P., Lönnermark, A., Månsson, M., and Persson, H., “Fire<strong>Characteristics</strong> and Detailed Smoke Gas Analyses <strong>in</strong> Controlled Under-Ventilated Large-Scale Combustion Experiments”, Proceed<strong>in</strong>gs <strong>of</strong> <strong>the</strong>INDUSTRIAL FIRES III Workshop, Risø, Denmark, pp. 7-16, 1996.Blomqvist, P., Lönnermark, A., Månsson, M., and Persson, H., “Methodologyfor Measurements <strong>of</strong> Fire <strong>Characteristics</strong> and Smoke Gas Composition <strong>in</strong>Controlled Under-ventilated Large-scale Combustion Experiments”, Proceed<strong>in</strong>gs<strong>of</strong> <strong>the</strong> Second International Conference on Fire Research and Eng<strong>in</strong>eer<strong>in</strong>g,Gai<strong>the</strong>rsburg, Maryland, USA, pp. 314-324, 1997.X. Blomqvist, P., Lönnermark, A., Månsson, M., and Persson, H. “Chemicalcharacterization <strong>of</strong> <strong>the</strong> smoke gases <strong>in</strong> large-scale combustion experiments”,Proceed<strong>in</strong>gs <strong>of</strong> <strong>the</strong> 8th International Fire Science & Eng<strong>in</strong>eer<strong>in</strong>g Conference(Interflam ‘99), Ed<strong>in</strong>burgh, Scotland, Volume 1, pp. 143-153, 1999.iii
<strong>On</strong> <strong>the</strong> <strong>Characteristics</strong> <strong>of</strong> <strong>Fires</strong> <strong>in</strong> <strong>Tunnels</strong>XI.XII.XIII.XIV.XV.XVI.Lönnermark, A., Persson, B., and Persson, H., “Modell<strong>in</strong>g <strong>of</strong> Foam Spreadon a Burn<strong>in</strong>g Liquid”, Proceed<strong>in</strong>gs <strong>of</strong> <strong>the</strong> 9th International Fire Science &Eng<strong>in</strong>eer<strong>in</strong>g Conference (Interflam 2001), 291-302, Ed<strong>in</strong>burgh, Scotland, 17-19 September, 2001.Axelsson, J., Andersson, P., Lönnermark, A., Van Hees, P., and Wetterlund,I., “Uncerta<strong>in</strong>ty <strong>of</strong> HRR and SPR Measurements <strong>in</strong> SBI and Room/cornerTest”, 9th International Fire Science & Eng<strong>in</strong>eer<strong>in</strong>g Conference (Interflam2001), 507-518, Ed<strong>in</strong>burgh, Scotland, 17-19 September, 2001.Lönnermark, A., “CFD Modell<strong>in</strong>g <strong>of</strong> Small Biomass-Fired Boilers”, Thesisfor <strong>the</strong> degree <strong>of</strong> licentiate <strong>of</strong> eng<strong>in</strong>eer<strong>in</strong>g, Department <strong>of</strong> Energy Conversion,Chalmers University <strong>of</strong> Technology, Göteborg, Sweden, 2002.Persson, B., Lönnermark, A., and Persson, H., “Modell<strong>in</strong>g <strong>of</strong> Foam Spreadon a Burn<strong>in</strong>g Liquid Fuel Surface”, Fire Safety Science - Proceed<strong>in</strong>gs <strong>of</strong> <strong>the</strong>Seventh International Symposium, 667-678, Worcester, USA, 16-21 June,2002.Persson, B., Lönnermark, A., and Persson, H., “FOAMSPEX: Large ScaleFoam Application - Modell<strong>in</strong>g <strong>of</strong> Foam Spread and Ext<strong>in</strong>guishment”, FireTechnology, 39, 4, 347-362, 2003.Ingason, H. and Lönnermark, A., “Large-scale Fire Tests <strong>in</strong> <strong>the</strong> Runehamartunnel - Heat Release Rate (HRR)”, International Symposium on CatastrophicTunnel <strong>Fires</strong> (CTF), SP Report 2004:05, p.81-92, Borås, Sweden, 2003.XVII. Lönnermark, A. and Ingason, H., “Large Scale Fire Tests <strong>in</strong> <strong>the</strong> RunehamarTunnel - Gas Temperature and Radiation”, International Symposium onCatastrophic Tunnel <strong>Fires</strong> (CTF), SP Report 2004:05, p. 93-103, Borås,Sweden, 20-21 November, 2003.XVIII. Ingason, H. and Lönnermark, A., “Recent Achievements Regard<strong>in</strong>g Measur<strong>in</strong>g<strong>of</strong> Time-heat and Time-temperature Development <strong>in</strong> <strong>Tunnels</strong>”, 1st InternationalSymposium on Safe & Reliable <strong>Tunnels</strong>, Prague, Czech Republic, 4-6 February, 2004.XIX.XX.XXI.Lönnermark, A. and Ingason, H., “<strong>Fires</strong> <strong>in</strong> Heavy Goods Vehicle (HGV)Cargos <strong>in</strong> <strong>Tunnels</strong>”, 10th International Fire Science & Eng<strong>in</strong>eer<strong>in</strong>g Conference(Interflam 2004), 1529-1540, Ed<strong>in</strong>burgh, Scotland, 5-7 July, 2004.Ingason, H. and Lönnermark, A., “Fire development <strong>of</strong> Large Vehicles <strong>in</strong>Road <strong>Tunnels</strong>”, Proceed<strong>in</strong>gs <strong>of</strong> <strong>the</strong> Fifth International Conference on Tunnel<strong>Fires</strong>, 203-212, London, UK, 25-27 October, 2004.Lönnermark, A. and Ingason, H., “Recent Achievements Regard<strong>in</strong>g HeatRelease and Temperatures dur<strong>in</strong>g <strong>Fires</strong> <strong>in</strong> <strong>Tunnels</strong>”, Safety <strong>in</strong> Infrastructure -Svédületes!, Budapest, Hungary, 20-21 October 2004, 2004.iv
Nomenclaturea Correlation constant (see Eq. (5.17)) [depends on b]A Area [m 2 ]A i Constants <strong>in</strong> <strong>the</strong> exponential expression <strong>of</strong> <strong>the</strong> general natural fire curve(Eq. (3.5)) [-]b Correlation constant (see Eq. (5.17)) [-]Distance [m]B Buoyancy factor [m/s]c Correlation constant (see Equation (5.3)) [-]Speed <strong>of</strong> sound [m/s]C Concentration (by voulume) [%]c p Specific heat capacity [kJ/(K kg)]D Diameter [m]D H Hydraulic diameter [m]E Amount <strong>of</strong> energy developed per consumed kilogram <strong>of</strong> oxygen [kJ/kg]f Frequency [1/s]F I Fraction <strong>of</strong> an <strong>in</strong>capoacitat<strong>in</strong>g dose [-]FI Total fraction <strong>of</strong> an <strong>in</strong>capacitat<strong>in</strong>g dose [-]FwsView factor between <strong>the</strong> walls and <strong>the</strong> fire source [-]Fr Froude number [-]g Acceleration <strong>of</strong> gravity [m/s 2 ]h Convective heat transfer coefficient [kW/(m 2 K)]h b Beam depth [m]h f Flame height <strong>of</strong> free burn<strong>in</strong>g flame [m]h r Radial extension <strong>of</strong> flame beneath a ceil<strong>in</strong>g [m]Δh c Heat <strong>of</strong> combustion per unit mass [kJ/kg]H Height [m]H f Distance between top <strong>of</strong> fuel and ceil<strong>in</strong>g [m]I COHb concentration at <strong>in</strong>capacitation [%]k Time width coefficient (<strong>in</strong> Equation (3.3)) [1/m<strong>in</strong>]Correlation constant (see Equation (5.2)) [-]Wave number [1/m]K Correlation constant (see Equation (5.3)) [-]K g Grade factor [-]L Length [m]L b Half <strong>the</strong> width between two beams [m]L f Flame length [m]m& Mass flow rate [kg/s]M Molecular weight [g/mol]n Retard <strong>in</strong>dex (<strong>in</strong> Equation (3.3)) [-]Acoustic mode [-]Time step number [-]N A non-dimensional group (see Equation (4.1) [-]p Pressure [Pa]P Perimeter [m]Q Energy [GJ]Q & Heat release rate [kW] <strong>in</strong> most equations, but [MW] <strong>in</strong> some relationshipsv
<strong>On</strong> <strong>the</strong> <strong>Characteristics</strong> <strong>of</strong> <strong>Fires</strong> <strong>in</strong> <strong>Tunnels</strong>*Q & Non-dimensional heat release rate [-]Q &′Heat release rate divided by plan area <strong>of</strong> <strong>the</strong> fire [kW/m 2 ]Heat flux [kW/m 2 ]r Amplitude coefficient (<strong>in</strong> Equation (3.3)) [ºC]Stoichimetric mass ratio <strong>of</strong> air to volatiles [-]Radius [m]R Correlation coefficient [-]Re Reynolds number [-]Ri Richardson number [-]RMV Breath<strong>in</strong>g rate [L/m<strong>in</strong>]St Strouhal number [-]t Time [s] or [m<strong>in</strong>] (depend<strong>in</strong>g on specific application)T Temperature [K] or [ºC] (depend<strong>in</strong>g on specific application)Period [s]*Δ T 0Dimensionless constant (see Eq. (5.8))Tr Heat transfer function [-]u Velocity [m/s]*ucrNon-dimensional critical velocity [-]V &′Volumetric surface burn<strong>in</strong>g rate [m 3 /(m 2 s)]VCO 2Multiply<strong>in</strong>g factor for <strong>the</strong> enhanced uptake <strong>of</strong> asphyxiant gases due tohyperventilation [-]W Width [m]x Distance [m]X Mole fraction [-]y Yield [g/g]Y Concentration [ppm]Greek symbolsαα iRatio between <strong>the</strong> number <strong>of</strong> moles <strong>of</strong> combustion products <strong>in</strong>clud<strong>in</strong>gnitrogen and <strong>the</strong> number <strong>of</strong> moles <strong>of</strong> reactants <strong>in</strong>clud<strong>in</strong>g nitrogen (expansionfactor) [-]Blockage ratio [-]Thermal diffusivity [m 2 /s]Constants <strong>in</strong> <strong>the</strong> exponential expression <strong>of</strong> <strong>the</strong> general natural fire curve(Eq. (3.5)) [1/m<strong>in</strong>]Correlation constant <strong>in</strong> Eq. (5.15) [-]β Correlation constant <strong>in</strong> Eq. (5.15) [-]Correlation coefficient <strong>in</strong> Eq. (6.2)γ Specific heat ratio [-]ε Emissivity [-]ν K<strong>in</strong>ematic viscosity [m 2 /s]η w Ratio between <strong>the</strong> temperature rise <strong>of</strong> <strong>the</strong> surface and <strong>the</strong> fire [-]η x Ratio between <strong>the</strong> temperature rise <strong>of</strong> an <strong>in</strong>terior po<strong>in</strong>t and <strong>the</strong> surface [-]ρ Density [kg/m 3 ]σ Stefan-Boltzmann constant (kW/(m 2 K 4 ))τ Time delay (s)vi
ϕ Phase [rad]φ Equivalence ratio [-]χ Combustion efficiency [-]ξ Correlation coefficient <strong>in</strong> Eq. (6.2) [-]ψ Downhill slope <strong>of</strong> <strong>the</strong> tunnel [%]ϖ Angular frequency [rad/s]Subscripts0 Referr<strong>in</strong>g to ambient conditions or to <strong>the</strong> Runehamar tunnel without protection1 Referr<strong>in</strong>g to <strong>the</strong> protection tunnel near <strong>the</strong> fire <strong>in</strong> <strong>the</strong> Runehamar testsb Beat<strong>in</strong>gB Flame holderc Convectivecr Criticalf Fire, flameg Gasl Lossr RadiationRest<strong>in</strong>gsl Smoke layert Tunnelw Wallwv Well ventilatedx Referr<strong>in</strong>g to a certa<strong>in</strong> distanceAbbreviationsBA Breath<strong>in</strong>g apparatusCFD Computational fluid dynamicsHC HydrocarbonHGV Heavy goods vehicleHRR Heat release rateimp Imp<strong>in</strong>gementITA International Tunnell<strong>in</strong>g AssociationNA Not availableOD Optical densityPAH Polycyclic aromatic hydrocarbonsPBDD/F Polybrom<strong>in</strong>ated dibenzo-p-diox<strong>in</strong>s and -furansPCDD/F Polychlor<strong>in</strong>ated dibenzo-p-diox<strong>in</strong>s and -furansPE Polye<strong>the</strong>nePS PolystyrenePUR PolyurethaneRABT Richtl<strong>in</strong>ien für die Ausstattung und den Betrieb von StraßentunnelnRWS RijkswaterstaatTHC Total hydrocarbon contentZTV Zusätzliche Technische Vertragsbed<strong>in</strong>gungen und Richtl<strong>in</strong>ien für den Bauvon Straßentunnelnvii
<strong>On</strong> <strong>the</strong> <strong>Characteristics</strong> <strong>of</strong> <strong>Fires</strong> <strong>in</strong> <strong>Tunnels</strong>viii
Table <strong>of</strong> contentsAbstractAcknowledgementsList <strong>of</strong> publicationsNomenclatureTable <strong>of</strong> contentsiiiiiivix1 Introduction 11.1 Aim <strong>of</strong> this <strong>the</strong>sis 11.2 The outl<strong>in</strong>e <strong>of</strong> <strong>the</strong> <strong>the</strong>sis 22 Background 32.1 Tunnel accidents 32.2 Guidel<strong>in</strong>es 72.2.1 Heat release rate 72.2.2 Temperature 93 Fire experiments <strong>in</strong> tunnels 133.1 Different methods <strong>of</strong> estimat<strong>in</strong>g <strong>the</strong> HRR and some factors<strong>in</strong>fluenc<strong>in</strong>g <strong>the</strong> results 133.2 Summary <strong>of</strong> experiments 163.3 Summary <strong>of</strong> results from fire experiments 194 Flame length and fire spread <strong>in</strong> a tunnel 295 Ventilation 415.1 Different types <strong>of</strong> ventilation 415.2 Effects <strong>of</strong> ventilation on <strong>the</strong> fire 425.3 Backlayer<strong>in</strong>g 475.4 Pulsations 536 Gas concentrations <strong>in</strong> <strong>the</strong> tunnel 656.1 Emissions from fires 656.2 Influence <strong>of</strong> ventilation on <strong>the</strong> gas composition 676.3 Toxicity 767 Application <strong>of</strong> <strong>the</strong> results 837.1 Effects on <strong>the</strong> tunnel structure 837.2 Rescue operations 837.3 Spr<strong>in</strong>kler and o<strong>the</strong>r water-based ext<strong>in</strong>guishment systems 858 Conclusions 879 Future work 8910 References 91ix
<strong>On</strong> <strong>the</strong> <strong>Characteristics</strong> <strong>of</strong> <strong>Fires</strong> <strong>in</strong> <strong>Tunnels</strong>x
1 Introduction1 Introduction1.1 Aim <strong>of</strong> this <strong>the</strong>sisThe author <strong>of</strong> this <strong>the</strong>sis has dur<strong>in</strong>g his employment at SP Swedish National Test<strong>in</strong>gand Research Institute (1995-) been <strong>in</strong>volved <strong>in</strong> a number <strong>of</strong> research project, bothnational and <strong>in</strong>ternational (f<strong>in</strong>anced by <strong>the</strong> European Commission). Most <strong>of</strong> thiswork has been experimental, but several <strong>of</strong> <strong>the</strong> projects have also <strong>in</strong>volved ma<strong>the</strong>maticaland numerical modell<strong>in</strong>g (e.g. computational fluid dynamics, CFD).Regard<strong>in</strong>g <strong>the</strong> articles <strong>in</strong>cluded <strong>in</strong> this <strong>the</strong>sis (I-VII): <strong>in</strong> those cases where <strong>the</strong> author<strong>of</strong> this <strong>the</strong>sis appears as <strong>the</strong> first name, he was responsible for writ<strong>in</strong>g <strong>the</strong> article,with help and <strong>in</strong>put from <strong>the</strong> co-authors. In those cases where <strong>the</strong> author <strong>of</strong> this<strong>the</strong>sis does not appear as first name, he took an active part <strong>in</strong> <strong>the</strong> writ<strong>in</strong>g process andwrote selected parts <strong>of</strong> <strong>the</strong> articles.Papers I, II, V, VI, and VII concern <strong>the</strong> large-scale fire tests performed <strong>in</strong> <strong>the</strong> Runehamartunnel <strong>in</strong> Norway. In this test series, <strong>the</strong> author <strong>of</strong> <strong>the</strong> <strong>the</strong>sis took an activepart <strong>in</strong> <strong>the</strong> plann<strong>in</strong>g <strong>of</strong> <strong>the</strong> tests toge<strong>the</strong>r with <strong>the</strong> <strong>in</strong>itiator and project leaderDr Haukur Ingason. The author was responsible for <strong>the</strong> preparation, perform<strong>in</strong>g, andevaluation <strong>of</strong> <strong>the</strong> tests <strong>in</strong> close collaboration with Dr Ingason. In Papers V and VI,<strong>the</strong> author has performed <strong>the</strong> calculations, although Dr Bror Persson developed <strong>the</strong><strong>the</strong>ory beh<strong>in</strong>d <strong>the</strong> calculations presented <strong>in</strong> Paper VI. In Paper III and IV, <strong>the</strong> authorwas responsible for plann<strong>in</strong>g, perform<strong>in</strong>g, and evaluat<strong>in</strong>g <strong>the</strong> tests. He was alsoresponsible for <strong>the</strong> measurements <strong>of</strong> physical properties (e.g. mass loss rate, heatrelease rate, mass flow, temperature etc.), while Per Blomqvist was responsible for<strong>the</strong> sampl<strong>in</strong>g <strong>of</strong> gases and gas analyses. In <strong>the</strong> work presented <strong>in</strong> Paper III, <strong>the</strong> authorwas responsible for <strong>the</strong> construction, calibration, and use <strong>of</strong> <strong>the</strong> phi meter.The aim <strong>of</strong> this <strong>the</strong>sis is to describe different phenomena that can be observed <strong>in</strong>connection with fires <strong>in</strong> tunnels. Some features are common to o<strong>the</strong>r types <strong>of</strong> fires orfires <strong>in</strong> o<strong>the</strong>r situations than tunnels, while some are specific to fires <strong>in</strong> tunnels. Thelatter will obta<strong>in</strong> <strong>the</strong> most attention.Much <strong>of</strong> <strong>the</strong> <strong>in</strong>formation concerns all types <strong>of</strong> fires <strong>in</strong> tunnels, although <strong>the</strong> focus ison fires <strong>in</strong> heavy goods vehicles (HGV), s<strong>in</strong>ce several <strong>of</strong> <strong>the</strong> papers, upon which this<strong>the</strong>sis is based, concern <strong>the</strong> results from <strong>the</strong> large-scale fire tests performed <strong>in</strong> <strong>the</strong>Runehamar tunnel <strong>in</strong> 2003. As will be discussed, HGVs have had a very importantrole <strong>in</strong> determ<strong>in</strong><strong>in</strong>g <strong>the</strong> ultimate outcome <strong>of</strong> <strong>the</strong> fire <strong>in</strong> all <strong>the</strong> major tunnel firesdur<strong>in</strong>g recent years. Previously, <strong>the</strong>re has also been a lack <strong>of</strong> <strong>in</strong>formation regard<strong>in</strong>g<strong>the</strong> magnitude and effect <strong>of</strong> fires <strong>in</strong> HGVs <strong>in</strong> tunnels. The cargo <strong>in</strong> <strong>the</strong> HGVs is <strong>of</strong>special <strong>in</strong>terest, s<strong>in</strong>ce it is this cargo that constitutes <strong>the</strong> majority <strong>of</strong> <strong>the</strong> fire load.This <strong>the</strong>sis will show that <strong>the</strong>re have previously been some misconceptions concern<strong>in</strong>g<strong>the</strong> size and nature <strong>of</strong> fires <strong>in</strong> loads <strong>of</strong> seem<strong>in</strong>gly <strong>in</strong>nocuous goods.The <strong>the</strong>sis focuses on <strong>the</strong> physical (and to some extent chemical) processes <strong>in</strong>connection with fires <strong>in</strong> tunnels. Many <strong>of</strong> <strong>the</strong> properties found and effects discussedcan be very important for <strong>the</strong> evacuation <strong>of</strong> people and <strong>the</strong> ability <strong>of</strong> <strong>the</strong> rescueservice to help people or to come close enough to <strong>the</strong> fire to make ext<strong>in</strong>guishment1
<strong>On</strong> <strong>the</strong> <strong>Characteristics</strong> <strong>of</strong> <strong>Fires</strong> <strong>in</strong> <strong>Tunnels</strong>feasible. The processes <strong>of</strong> evacuation and ext<strong>in</strong>guishment are, however, not discussed<strong>in</strong> detail, but are only mentioned to illustrate <strong>the</strong> importance <strong>of</strong> different parametersMuch <strong>in</strong>terest with<strong>in</strong> <strong>the</strong> field <strong>of</strong> tunnel fires is focused on <strong>the</strong> smoke movement andverification <strong>of</strong> <strong>the</strong> ability <strong>of</strong> different <strong>in</strong>stallations to evacuate smoke or to meetcerta<strong>in</strong> conditions. Some specific aspects <strong>of</strong> ventilation and smoke (e.g. backlayer<strong>in</strong>g)are discussed, but ventilation <strong>of</strong> smoke is not a focal po<strong>in</strong>t <strong>of</strong> this <strong>the</strong>sis.The importance <strong>of</strong> <strong>the</strong> <strong>the</strong>rmal <strong>in</strong>sult on <strong>the</strong> structure (e.g. spall<strong>in</strong>g) will be discussedbriefly, although <strong>the</strong> factors beh<strong>in</strong>d <strong>the</strong> response <strong>of</strong> <strong>the</strong> structure to <strong>the</strong> high temperaturesassociated with fires <strong>in</strong> tunnels are outside <strong>the</strong> scope <strong>of</strong> this <strong>the</strong>sis.1.2 The outl<strong>in</strong>e <strong>of</strong> <strong>the</strong> <strong>the</strong>sisThis <strong>the</strong>sis is based on seven papers (see list above). These papers are not presentedseparately, but <strong>the</strong> results are described and discussed <strong>in</strong> <strong>the</strong> different sections <strong>of</strong> <strong>the</strong><strong>the</strong>sis when suitable. Below follows a description <strong>of</strong> <strong>the</strong> different chapters <strong>in</strong> <strong>the</strong><strong>the</strong>sis.Chapter 2 provides <strong>the</strong> background and <strong>the</strong> reason for perform<strong>in</strong>g <strong>the</strong> large-scale firetests <strong>in</strong> <strong>the</strong> Runehamar tunnel <strong>in</strong> 2003. The Runehamar tests are a central part <strong>of</strong> <strong>the</strong><strong>the</strong>sis and <strong>the</strong> results from <strong>the</strong>se tests will be compared with <strong>the</strong> <strong>in</strong>formationpresented <strong>in</strong> Chapter 2.Chapter 3 provides an overview <strong>of</strong> results from fire experiments <strong>in</strong> tunnels or firetests with vehicles. The focus is on <strong>the</strong> heat release rate (HRR) and temperature and<strong>in</strong> this chapter <strong>the</strong> ma<strong>in</strong> results from Papers I and II are presented and compared wi<strong>the</strong>xperimental results from o<strong>the</strong>r test series.Chapter 4 gives <strong>in</strong>formation on flame lengths and fire spread <strong>in</strong> tunnels. The resultfrom Paper VII are summarized and compared with results from models and experimentsfound <strong>in</strong> <strong>the</strong> literature.In Chapter 5 different types <strong>of</strong> ventilation strategies are discussed briefly. The ma<strong>in</strong>focus <strong>of</strong> <strong>the</strong> chapter is on <strong>the</strong> pulsations observed <strong>in</strong> <strong>the</strong> Runehamar tests (Paper Vand VI) and on <strong>the</strong> effect <strong>the</strong> ventilation has on <strong>the</strong> fire. The phenomenon backlayer<strong>in</strong>gis discussed and <strong>the</strong> results from <strong>the</strong> Runehamar tests are compared to somecorrelations found <strong>in</strong> <strong>the</strong> literature.In Chapter 6 different factors affect<strong>in</strong>g <strong>the</strong> production <strong>of</strong> different gases are discussed,<strong>in</strong> particular <strong>the</strong> effect <strong>of</strong> ventilation and <strong>the</strong> equivalence ratio, φ. The combustiongases produced <strong>in</strong> a fire are important for <strong>the</strong> severity <strong>of</strong> <strong>the</strong> hazard to people <strong>in</strong>a tunnel dur<strong>in</strong>g a fire.In Chapter 7 how <strong>the</strong> results presented <strong>in</strong> this <strong>the</strong>sis correlate with different applications<strong>in</strong> a real fire situation, is discussed briefly.2
2 Background2 BackgroundThis chapter conta<strong>in</strong>s background <strong>in</strong>formation on which <strong>the</strong> decision to perform <strong>the</strong>tests <strong>in</strong> <strong>the</strong> Runehamar tunnel <strong>in</strong> 2003 was based. In Section 2.1 selected tunnelaccidents are presented and discussed while <strong>in</strong> Section 2.2 some exist<strong>in</strong>g guidel<strong>in</strong>esregard<strong>in</strong>g tunnel fire safety are presented and how <strong>the</strong>re content correlate withoccurred accidents, especially those <strong>in</strong>volv<strong>in</strong>g HGVs.2.1 Tunnel accidents<strong>Fires</strong> <strong>in</strong> tunnels have obta<strong>in</strong>ed special attention dur<strong>in</strong>g recent years due to severalcatastrophic fires <strong>in</strong> alp tunnels. There were, however, fires <strong>in</strong> tunnels also prior to<strong>the</strong>se accidents. In Table 2.1 a summary is given <strong>of</strong> fires <strong>in</strong> road tunnels <strong>of</strong> special<strong>in</strong>terest. A more extensive list is given by Carvel and Marlair [1].Table 2.1 Summary <strong>of</strong> fires <strong>in</strong> road tunnels [1, 2]Year1949,13 May1978,11 Aug1979,11 July1980,17 Apr.1982,7 Apr.1983,3 Feb.Tunnel,lengthHollandL = 2 550 mVelsenL = 770 mNihonzakaL = 2 045 mKajiwaraL = 740 mCaldecottL = 1 083 mFréjusL = 12 868 m1986, L’Arme9 Sept. L=1100 m1987, Gumefens18 Feb. L = 340 m1993 Serra a RipoliL=442 m1993 FréjusL=12870 mLocationNew York,USAVelsen,Ne<strong>the</strong>rlandsShizuoka,JapanVehicle atorig<strong>in</strong> <strong>of</strong> <strong>the</strong>fire1 HGVloaded with11 toncarbonbisulfur2 HGVsand 4 cars4 HGVsand 2 carsJapan 1 truck (4 t)with 3600 Lpa<strong>in</strong>t and 1truck (10 t)Oakland,USAModane,France-Italy1 car ,1 bus,1 tanker with33 000 Lpetrol1 HGVloaded withplasticmaterialCause <strong>of</strong>fireLoad fall<strong>in</strong>g<strong>of</strong> HGVFront-backcollisionFront-backcollisionCollisionwith sidewall andover-turn<strong>in</strong>gFront-backcollisionGear boxbreak<strong>in</strong>gDuration4 h 66 <strong>in</strong>jured(smoke)1 h 20m<strong>in</strong>Consequences forpeople vehicles structure10 HGVs13 cars5 dead5 <strong>in</strong>jured4 days 7 dead2 <strong>in</strong>jured1 h 20m<strong>in</strong>2 h 40m<strong>in</strong>1 h 50m<strong>in</strong>2 HGVs4 cars127 HGVs,46 carsSeriousdamage200 mSeriousdamage30 mSeriousdamage1100 m1 dead 2 trucks Damage280 m7 dead2 <strong>in</strong>jured3 HGV1 bus4 carsSeriousdamage580 mnone 1 HGV Seriousdamage200 mFrance Collision 3 dead5 <strong>in</strong>juredBern, 1 HGV Mass 2 h 2 dead 2 HGVSwitzerlandcollision on1 vanslipperyroadBologna,ItalyCar andHGV withrolls <strong>of</strong> paperVehicle out<strong>of</strong> controlandcollision2 h 30m<strong>in</strong>4 dead4 <strong>in</strong>jured4 HGV11 carsFrance 1 HGV Eng<strong>in</strong>e fire 2 h none 1 HGVSlightdamageSeriousdamage tol<strong>in</strong><strong>in</strong>g3
<strong>On</strong> <strong>the</strong> <strong>Characteristics</strong> <strong>of</strong> <strong>Fires</strong> <strong>in</strong> <strong>Tunnels</strong>Year1994,5 JulyTunnel,lengthSt. GotthardL=16322 m1994, Huguenot27 Feb. L=4000 m1996, Isola delle18 Mar. Femm<strong>in</strong>eL=150 m1997,31 Oct.1999,24 Mar.1999,29 May2000,14 July2001,24 Oct.2003,10 Nov.2005,4 JuneSt. GotthardL=16322 mMont BlancL=11 600 mTauernL=6400 mLocationSouthAfricaSicilia,ItalyDurationGoeschenen,SwitzerlandSwitzerlandFrance-ItalyAustriaSeljestads-tunn NorwayL=1272 mSt. Gotthard a)L=16322Flöfjell3100 mFréjus12900 mDiesel fire<strong>in</strong> eng<strong>in</strong>ecompartmentSwitzerlandNorwayFrance/ItalyVehicle atorig<strong>in</strong> <strong>of</strong> <strong>the</strong>fire1 HGV withtrailer loadedwith 750bicycleswrapped <strong>in</strong>carton andplasticsBus1 tanker withliquid gas +1 small bus1HGVloaded withcarsFire starts <strong>in</strong>a HGVMultiplecollision duetoma<strong>in</strong>tenanceworkMultiplecollisionCollisionbetween twoHGVsFire <strong>in</strong> carspread to <strong>the</strong>tunnel l<strong>in</strong><strong>in</strong>g1 HGVcarry<strong>in</strong>gtyresCause <strong>of</strong>fireFrictionwheelFire <strong>in</strong>gearboxBus crashed<strong>in</strong>to back <strong>of</strong>tanker(stoppeddue topreviouscollision)Fire <strong>in</strong>eng<strong>in</strong>eConsequences forpeople vehicles structure2 h none 1 HGV Serious(with trailer) damage toceil<strong>in</strong>g,pavementandequipment50 m, tunnelclosed for2.5 days1 h 1 dead bus Damage to28 <strong>in</strong>jured<strong>in</strong>stallations1 h 20m<strong>in</strong>5 dead34 <strong>in</strong>jured1 tanker1 bus18 carsDamage tol<strong>in</strong><strong>in</strong>g andlight<strong>in</strong>gnone 1 HGV Seriousdamage 100mSevereNot known 53 h 39 dead 23 HGVsLeakage <strong>of</strong>pa<strong>in</strong>ts andvarnishes1 small truck9 cars1 motorcycle15 h 12 dead 16 HGVs24 cars45 m<strong>in</strong> 6 <strong>in</strong>jured 1 lorry6 cars 1 MCCollision 2 days 11 dead 13 HGVs10 carsCollisionbetween carand wallEng<strong>in</strong>e fire1 dead 1 car2 dead,21 <strong>in</strong>jureddamage (900m), <strong>the</strong>tunnelclosed forthree yearsClosed forthree monthsSeveredamageSeveredamage230 m,additionallydamage 700m, closed fortwo months4 HGV 10 km <strong>of</strong>equipment tobe repaireda) The actual tunnel length is 16322 m, but ano<strong>the</strong>r 596 m is motorway protected by an enclos<strong>in</strong>ggallery giv<strong>in</strong>g a total length <strong>of</strong> 16918 m.Not all tunnel fires reach catastrophic proportions. As shown <strong>in</strong> Table 2.1 <strong>the</strong>re havebeen fires <strong>in</strong> both <strong>the</strong> St. Gotthard tunnel and <strong>the</strong> Fréjus tunnel prior to <strong>the</strong> mostrecent ones. The same is true for <strong>the</strong> Mont Blanc tunnel (not reported <strong>in</strong> <strong>the</strong> table).The question rema<strong>in</strong>s: when will a fire spread to o<strong>the</strong>r vehicles, result<strong>in</strong>g <strong>in</strong> a majorhazard for occupants and <strong>the</strong> tunnel structure? The aim <strong>of</strong> this <strong>the</strong>sis is to spread4
2 Backgroundsome light on some <strong>of</strong> <strong>the</strong> important parameters and phenomena govern<strong>in</strong>g <strong>the</strong>passage from a “benign” fire to a catastrophe.Table 2.2 Summary <strong>of</strong> fires <strong>in</strong> rail tunnels [1, 3].YearTunnel,lengthLocation1903, Couronnes Paris,10 Aug underground France1921, Batignolles, Paris,21 Oct L = 1000 m France1958,28 July1971,14 Feb.1972,6 Nov.1979,17 Jan.1987,18 NovLondonundergroundHollandParkWranduk,L=1500 mVehicle atorig<strong>in</strong> <strong>of</strong><strong>the</strong> fireCause <strong>of</strong> fireElectrical faultCollisionresult<strong>in</strong>g <strong>in</strong> alarge fire;discharg<strong>in</strong>ggases from <strong>the</strong>gaslightsystemDurationConsequences forpeople vehicles structure≥84 dead≥28 dead,most due to<strong>the</strong> fire1 dead,51 <strong>in</strong>juredYugoslavia Fire <strong>in</strong> eng<strong>in</strong>e 34 dead,120 <strong>in</strong>juredHokoriku Japan Restaurant30 dead,car690 <strong>in</strong>juredSan USA underneath Short circuit1 dead,Fransiscoa metro car58 <strong>in</strong>juredundergroundK<strong>in</strong>gs CrossStationLondon,UK1990,28 DecNew YorkundergroundUSA1991, Moscow Russia1 June underground1995, Baku Azerbaijan28 Oct. underground1996,18 NovChanneltunnelL=50 000 m1998, Gueizhou,10 July L=800 m1999, Salerno,23 May L = 9000 m2000, Kitzste<strong>in</strong>horn11 Novfuniculartunnel2003,18 FebJungangnoundergroundUK tra<strong>in</strong> Sparkover <strong>in</strong>electrotechnicalequipmentEngland-FranceEscilator 4(wooden)Cable <strong>in</strong>tunnelUnder atra<strong>in</strong>At <strong>the</strong> rear<strong>of</strong> <strong>the</strong>fourth car(out <strong>of</strong>five)Electrical fireElectrical fault1 HGV Suspectedarson6 h 31 dead,many<strong>in</strong>jured2 dead,200 <strong>in</strong>jured7 dead,≥10 <strong>in</strong>jured289 dead(245 <strong>in</strong>tra<strong>in</strong>, 40 <strong>in</strong>tunnel), 265<strong>in</strong>jured2.5 h 30 <strong>in</strong>juredby <strong>the</strong>smoke2 carriages2 rail carscompletelydamagedCables;Novisibledamageto <strong>the</strong>structure10 HGVs Severedamageto <strong>the</strong>tunnelceil<strong>in</strong>gCh<strong>in</strong>a Tra<strong>in</strong> Explosion <strong>in</strong>gas canisters≥80 deadItaly Tra<strong>in</strong> Smoke bomb 4 deaths,9 <strong>in</strong>juredAustria The rear Hydraulic oil 3 h 155 dead tra<strong>in</strong>driver’s leakage <strong>in</strong>tocompletelycab <strong>the</strong> heaterburnt outDaego,SouthKoreaPetrol andcigarette <strong>in</strong>tra<strong>in</strong>Arson 3.75 h 198 dead,146 (+ 20firefighters)<strong>in</strong>jured5
<strong>On</strong> <strong>the</strong> <strong>Characteristics</strong> <strong>of</strong> <strong>Fires</strong> <strong>in</strong> <strong>Tunnels</strong>In Table 2.2, a summary <strong>of</strong> selected fires <strong>in</strong> rail tunnels is presented. More comprehensivelists <strong>of</strong> fires <strong>in</strong> rail tunnels have been published by Carvel [1] and Andersenand Paaske [3].As can be seen from <strong>the</strong> Tables 2.1 and 2.2, <strong>the</strong>re is a larger risk for fatalities <strong>in</strong>accidents <strong>in</strong> rail tunnels/metros than <strong>in</strong> road tunnels, <strong>the</strong> reason for this be<strong>in</strong>g <strong>the</strong>large number and concentration <strong>of</strong> people be<strong>in</strong>g transported. <strong>On</strong> <strong>the</strong> o<strong>the</strong>r hand onecan also see <strong>the</strong> pattern that more recent fire <strong>in</strong>cidents <strong>in</strong> road tunnels have <strong>in</strong>volvedan <strong>in</strong>creased number <strong>of</strong> fatalities compared to previous events. This is no doubt due,at least <strong>in</strong> part, to <strong>the</strong> <strong>in</strong>creas<strong>in</strong>g transportation <strong>of</strong> goods on roads and through roadtunnels. It is expected that <strong>the</strong> heavy goods transport on roads and through roadtunnels will <strong>in</strong>crease with between 40 % and 60 % over <strong>the</strong> period between 2000 and2010 [4].A common factor for catastrophic fires is <strong>the</strong> fire spread to a large number <strong>of</strong>vehicles, mak<strong>in</strong>g it very difficult for firefighters to reach <strong>the</strong> seat <strong>of</strong> <strong>the</strong> fire or evento come close enough to ext<strong>in</strong>guish <strong>the</strong> fire. The heat release rate (HRR) is commonlyused to describe <strong>the</strong> size <strong>of</strong> a fire (most <strong>of</strong>ten presented <strong>in</strong> kW or MW).Ingason estimated <strong>the</strong> heat release rates (based on available <strong>in</strong>formation) from some<strong>of</strong> <strong>the</strong> more recent large fires <strong>in</strong> European tunnels [5]. A summary <strong>of</strong> <strong>the</strong> results arepresented <strong>in</strong> Table 2.3 toge<strong>the</strong>r with estimations made by Bettel<strong>in</strong>i for <strong>the</strong>St. Gotthard fire [6]. AThe estimates range from more than 100 MW to 400 MW. Inall <strong>the</strong>se fires at least 10 HGVs were <strong>in</strong>volved.Table 2.3 Summary <strong>of</strong> estimated energy content and peak HRR <strong>in</strong> tunnel fires<strong>in</strong>volv<strong>in</strong>g HGVs [5, 6].Accident Vehicle type Estimatedheat content[GJ]Estimatedpeak HRR[MW]Conseq. forpeopleConseq. fortunnelEurotunnel 10 HGV 2200 370 30 <strong>in</strong>jured Damage toceil<strong>in</strong>gMont Blanc 14 HGV, 9 cars 5000-7000 380 39 deaths Closed for 3yearsTauern 16 HGV, 24carsSt Gotthard 13 HGV, 10cars1400-2700 a) ”More than100”a) Assumption: 100 GJ - 200 GJ per HGV and 5 GJ per car.4000-4500 300-400 12 deaths Closed for 3months11 deaths Closed for 2monthsFrom <strong>the</strong> above summary <strong>of</strong> <strong>the</strong> recent fires with fatalities <strong>in</strong> road tunnels it isobvious that HGVs play an important role <strong>in</strong> determ<strong>in</strong><strong>in</strong>g <strong>the</strong> outcome <strong>of</strong> a fire <strong>in</strong> atunnel. This becomes even more significant when one considers that road transportation<strong>of</strong> goods through road tunnels will <strong>in</strong>crease <strong>in</strong> <strong>the</strong> future. Indeed, <strong>the</strong> trafficthrough <strong>the</strong> Mont Blanc tunnel is <strong>in</strong>creas<strong>in</strong>g and will soon be back at <strong>the</strong> same levelas it was at <strong>the</strong> time for <strong>the</strong> latest accident <strong>in</strong> 1999. The fire <strong>in</strong> <strong>the</strong> Fréjus tunnel on 4June, 2005, has put <strong>the</strong> spotlight on traffic across <strong>the</strong> Alps and <strong>the</strong> EU sees <strong>the</strong>transferr<strong>in</strong>g part <strong>of</strong> <strong>the</strong> traffic on roads to railways as one solution [7], potentiallysignificantly <strong>in</strong>creas<strong>in</strong>g <strong>the</strong> fire load on railways.6
2 BackgroundFrom Table 2.1 it can be seen that HGVs <strong>of</strong>ten are <strong>in</strong>volved <strong>in</strong> <strong>the</strong> fires and <strong>of</strong>tenlead to fatalities if two or more HGVs are <strong>in</strong>volved. The importance <strong>of</strong> <strong>the</strong> HGVs ledto <strong>the</strong> need for a comparison with different exist<strong>in</strong>g guidel<strong>in</strong>es (see below) and adecision to study <strong>the</strong> potential size <strong>of</strong> fires <strong>in</strong> HGVs with ord<strong>in</strong>ary cargos. This led to<strong>the</strong> decision to perform <strong>the</strong> tests <strong>in</strong> <strong>the</strong> Runehamar tunnel, <strong>the</strong> results <strong>of</strong> which aresummarized <strong>in</strong> Section 3.3 toge<strong>the</strong>r with results from o<strong>the</strong>r tests series.2.2 Guidel<strong>in</strong>esAn important step towards safety <strong>in</strong> tunnels <strong>in</strong> Europe was <strong>the</strong> tunnel directive(2004/54/EC) from <strong>the</strong> European Parliament which has recently entered <strong>in</strong>to force(30 April 2004) [8]. <strong>On</strong>e can argue that <strong>the</strong> directive has not gone far enough and isnot as detailed as many <strong>of</strong> <strong>the</strong> exist<strong>in</strong>g guidel<strong>in</strong>es. However, <strong>the</strong>se guidel<strong>in</strong>es arerecommendations and not b<strong>in</strong>d<strong>in</strong>g. The strength <strong>of</strong> <strong>the</strong> directive is that it is mandatorythrough legislation. The directive applies to all tunnels <strong>in</strong> <strong>the</strong> Trans-EuropeanRoad Network with lengths <strong>of</strong> over 500 m. The directive states requirements <strong>of</strong>m<strong>in</strong>imum safety, but cannot be used for design<strong>in</strong>g <strong>of</strong> safety measures (except form<strong>in</strong>imum requirements, e.g. for emergency exits) dur<strong>in</strong>g <strong>the</strong> construction or designstage <strong>of</strong> <strong>the</strong> tunnel. For this task different types <strong>of</strong> guidel<strong>in</strong>es and standards are <strong>of</strong>more use and <strong>the</strong>refore some <strong>of</strong> <strong>the</strong>se will be discussed below.A number <strong>of</strong> standards and guidel<strong>in</strong>es exist, both national and <strong>in</strong>ternational,regard<strong>in</strong>g transportation and construction <strong>of</strong> safe tunnels. <strong>On</strong>e can say that <strong>the</strong>re aretwo ma<strong>in</strong> issues to be resolved when design<strong>in</strong>g a safe tunnel. <strong>On</strong>e is <strong>the</strong> safety <strong>of</strong> <strong>the</strong>people <strong>in</strong>side <strong>the</strong> tunnel, where <strong>the</strong> hot smoke <strong>in</strong> <strong>the</strong> tunnel is <strong>of</strong> great concern. Thedesign<strong>in</strong>g <strong>of</strong> ventilation as perta<strong>in</strong>s to smoke movement, for example, is based on <strong>the</strong>HRR <strong>of</strong> <strong>the</strong> fire. The second ma<strong>in</strong> issue is <strong>the</strong> endurance <strong>of</strong> <strong>the</strong> structure under <strong>the</strong>effect <strong>of</strong> a fire. In this case <strong>the</strong> temperature is important and different types <strong>of</strong> temperature-timecurves (see below) are used to represent <strong>the</strong> potential heat load on <strong>the</strong>structure. The temperature curves and HRR values chosen are, however, not alwaysdirectly related to each o<strong>the</strong>r. Note that guidel<strong>in</strong>es and requirements exist for a largevariety <strong>of</strong> parts <strong>of</strong> a tunnel construction, <strong>in</strong>clud<strong>in</strong>g <strong>in</strong>stallations, but <strong>the</strong> <strong>in</strong>formationgiven below focuses ma<strong>in</strong>ly on <strong>the</strong> HRR and <strong>the</strong> expected maximum temperaturefrom fires <strong>in</strong> different types <strong>of</strong> vehicle fires <strong>in</strong> tunnels. Summaries <strong>of</strong> <strong>the</strong> variousrequirements <strong>in</strong> different countries are available for road tunnel [9], rail tunnels [10],and metros [11]. When it comes to <strong>the</strong> ventilation <strong>in</strong> particular, Bendelius haspresented lists and <strong>in</strong>formation on handbooks and guidel<strong>in</strong>es [12].2.2.1 Heat release rateHeselden assumed HRR for different design fires as a basis for calculations <strong>of</strong>smoke and fire spread <strong>in</strong> tunnels [13, 14]. He used fires <strong>of</strong> <strong>the</strong> sizes 3, 10, 20, 50,and 100 MW and referred to <strong>the</strong>se as motor car, van, lorry, coach, and large petrolspill fires, respectively. The value for a lorry (20 MW) has long been thought to berepresentative for HGVs and has even been <strong>in</strong>cluded <strong>in</strong> several guidel<strong>in</strong>es. In Table2.4 recommended design values for <strong>the</strong> HRR from different types <strong>of</strong> vehicle fires arepresented and some <strong>of</strong> <strong>the</strong> values assumed by Heselden can still be recognized. Notethat <strong>the</strong> values <strong>in</strong> Table 2.4 are those which were valid at <strong>the</strong> time when <strong>the</strong> tests <strong>in</strong><strong>the</strong> Runehamar tunnel were performed <strong>in</strong> 2003. S<strong>in</strong>ce <strong>the</strong>n some guidel<strong>in</strong>es havebeen updated, e.g. NFPA 502 where a value for HGV (<strong>in</strong> <strong>the</strong> NFPA standard called7
<strong>On</strong> <strong>the</strong> <strong>Characteristics</strong> <strong>of</strong> <strong>Fires</strong> <strong>in</strong> <strong>Tunnels</strong>heavy goods truck) has been <strong>in</strong>cluded, 20 MW to 30 MW [15]. The next version <strong>of</strong>NFPA 502 is scheduled to 2009 and a call for comments has already been released.PIARC (Technical Committee C3.3, Work<strong>in</strong>g group 6) has also prepared an updatedversion on <strong>the</strong>ir guidel<strong>in</strong>es (System and Equipment for Fire and Smoke Control <strong>in</strong>Road <strong>Tunnels</strong>). This is still to be published. The design values for <strong>the</strong> maximumHRR are <strong>the</strong> same as <strong>in</strong> Table 2.4, with <strong>the</strong> exception <strong>of</strong> fires <strong>in</strong>volv<strong>in</strong>g dangerousgoods, which are estimated to range from 200 MW to 300 MW [16].Table 2.4 Design values for HRR for tunnel fires accord<strong>in</strong>g to different guidel<strong>in</strong>es(<strong>in</strong> 2003). The HRR values are given <strong>in</strong> MW.Type <strong>of</strong> vehicle PIARC [2] French rules [17] NFPA [18]1 small car 2.5 2.5 -1 large car 5 5 52 to 3 cars 8 8 -Van 15 15 -Bus 20 20 20HGV 20-30 20-30 -Tanker 100 100 100The catastrophic fires <strong>in</strong> European tunnels <strong>in</strong> recent years show that fires <strong>in</strong>volv<strong>in</strong>gseveral HGVs, even those with “non-hazardous” cargo, produce a great deal <strong>of</strong>smoke and heat and are extremely difficult to combat. The tunnel fires describedabove, all gave HRR well over 100 MW. In three cases <strong>the</strong> HRR was estimated to bebetween 300 MW and 400 MW [5] (see Table 2.3). In contrast, regulations and recommendationsfor design <strong>of</strong> safety systems <strong>in</strong> tunnels, assume that HGVs withord<strong>in</strong>ary cargos (not liquid fuels or o<strong>the</strong>r hazardous products) to give relatively lowHRR <strong>in</strong> <strong>the</strong> event <strong>of</strong> a fire (see Table 2.4).In light <strong>of</strong> <strong>the</strong> conclusions drawn from catastrophic fires, <strong>the</strong> HRR values for HGVspresented <strong>in</strong> Table 2.4 seem low. This was one <strong>of</strong> <strong>the</strong> reasons which prompted SPFire Technology to <strong>in</strong>itiate a project where <strong>the</strong> HRRs from HGV loads, consist<strong>in</strong>g <strong>of</strong>typical, non-hazardous commodity mixtures, were measured. The set-up <strong>of</strong> andresult from <strong>the</strong>se tests are summarized <strong>in</strong> <strong>the</strong> follow<strong>in</strong>g sections. <strong>On</strong>e <strong>of</strong> <strong>the</strong> ma<strong>in</strong>results from <strong>the</strong> Runehamar tests was that HGV trailers with ord<strong>in</strong>ary cargoes(mixtures <strong>of</strong> cellulose and plastics) can give very high peak HRR, 66 MW – 202MW, i.e. far above <strong>the</strong> assumed value <strong>in</strong> <strong>the</strong> guidel<strong>in</strong>es and <strong>of</strong> <strong>the</strong> same order <strong>of</strong>magnitude as for tanker fires. These values have already been discussed byauthorities and representatives for standardization (e.g. for NFPA 502 at <strong>the</strong> firstInternational Symposium on Tunnel Safety and Security <strong>in</strong> Greenbelt, MD, USA <strong>in</strong>November 2004). The standards and guidel<strong>in</strong>es are cont<strong>in</strong>uously revised and it isanticipated that <strong>the</strong> maximum value for typical HGVs will <strong>in</strong>crease over time.When it comes to railways a number <strong>of</strong> <strong>in</strong>ternational groups <strong>of</strong> experts exist, whosefocus is on <strong>the</strong> harmonization <strong>of</strong> <strong>the</strong> railway <strong>in</strong>frastructure and operation, and an<strong>in</strong>crease <strong>in</strong> safety. Examples <strong>of</strong> such groups are <strong>the</strong> International Union <strong>of</strong> Railways(Union Internationale des Chem<strong>in</strong>s de fer, UIC), <strong>the</strong> UN ECE group <strong>of</strong> experts, and<strong>the</strong> European Association for Railway Interoperability (Association Européennepour l’Interopérabilité Ferroviaire, AEIF) [19]. For <strong>the</strong> fire resistance <strong>of</strong> roll<strong>in</strong>g8
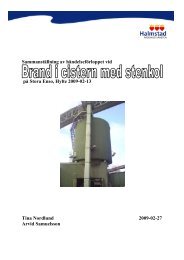
2 Backgroundstock, a new European standard is on its way [20]. The aim <strong>of</strong> <strong>the</strong> standard is that“<strong>the</strong> design <strong>of</strong> roll<strong>in</strong>g stock and <strong>the</strong> materials used shall be aimed at limit<strong>in</strong>g firedevelopment should an ignition event occur”. This is an important aim s<strong>in</strong>ce an earlyphase <strong>of</strong> slow fire development is essential to escape a fire. As soon as <strong>the</strong> rate <strong>of</strong>fire/flame spread <strong>in</strong>creases beyond a certa<strong>in</strong> level <strong>the</strong> situation becomes more severe.The standard for roll<strong>in</strong>g stock, prEN45545-2, is a complex document with requirementson different objects found <strong>in</strong> roll<strong>in</strong>g stock, where <strong>the</strong> specific requirementsdepend on <strong>the</strong> object, material, orientation and size. The standard does not, however,give any guidance on design fires for tunnels. The standard was also recently voteddown and will <strong>the</strong>refore be revised and delayed. <strong>On</strong>e standard giv<strong>in</strong>g <strong>in</strong>formation onheat release per object is <strong>the</strong> NFPA 130 standard [21]. Aga<strong>in</strong>, <strong>the</strong> document does notgive any guidance on <strong>the</strong> time evolution <strong>of</strong> <strong>the</strong> fire and maximum HRR.Due to <strong>the</strong> overall <strong>in</strong>crease <strong>of</strong> cargo transportation, <strong>the</strong> need for transportation <strong>of</strong>cargo on rail will also <strong>in</strong>crease. There are, however, no standards, similar to thosefor passenger transportation, for cargo tra<strong>in</strong>s. This issue is presently under discussionand some suggestions for values <strong>of</strong> design fires for this type <strong>of</strong> ‘vehicle’ (e.g. seereference [22]), have also been proposed, especially after <strong>the</strong> Runehamar tests.2.2.2 TemperatureRoad tunnels are <strong>of</strong>ten covered with some type <strong>of</strong> l<strong>in</strong><strong>in</strong>g, but <strong>the</strong> purpose <strong>of</strong> thisl<strong>in</strong><strong>in</strong>g can vary from one tunnel application to ano<strong>the</strong>r. In some cases <strong>the</strong> l<strong>in</strong><strong>in</strong>g is ath<strong>in</strong> layer <strong>of</strong> concrete to prevent dripp<strong>in</strong>g water, which both causes mechanical wearon <strong>the</strong> road and can cause problems with ice. There are also aes<strong>the</strong>tical issues andissues regard<strong>in</strong>g <strong>the</strong> perception <strong>of</strong> a driver <strong>in</strong> a tunnel. In o<strong>the</strong>r cases <strong>the</strong> l<strong>in</strong><strong>in</strong>g is<strong>in</strong>stalled to protect <strong>the</strong> construction or <strong>in</strong>stallations <strong>in</strong> <strong>the</strong> case <strong>of</strong> a fire. <strong>On</strong>e problemhas, however, been to decide which fire load to use for <strong>the</strong> eng<strong>in</strong>eer<strong>in</strong>g <strong>of</strong> <strong>the</strong> tunnelconstruction. This <strong>in</strong>volves both <strong>the</strong> type <strong>of</strong> fire and <strong>the</strong> distribution (both <strong>in</strong> timeand space) <strong>of</strong> <strong>the</strong> temperature exposure to <strong>the</strong> construction. A standard curve usedwhen test<strong>in</strong>g <strong>the</strong> temperature exposure is <strong>the</strong> cellulose curve def<strong>in</strong>ed <strong>in</strong> severalstandards, e.g. ISO 834 [23]. This curve applies to materials found <strong>in</strong> typicalbuild<strong>in</strong>gs. This has been used for many years, also for tunnels, but it is clear that thiscurve does not represent all materials, e.g. petrol, chemicals, etc., and <strong>the</strong>refore aspecial curve, <strong>the</strong> hydrocarbon curve (<strong>the</strong> HC curve) [24], which was developed <strong>in</strong><strong>the</strong> 1970s for use <strong>in</strong> <strong>the</strong> petrochemical and <strong>of</strong>f-shore <strong>in</strong>dustries, has been applied totunnels. The ma<strong>in</strong> difference between <strong>the</strong>se two curves is that <strong>the</strong> HC curve exhibitsa much faster fire development and consequently is associated with a faster temperature<strong>in</strong>crease than <strong>the</strong> standard ISO 834 fire curve and has traditionally been seen tobe more relevant for a petroleum fire.Specific temperature curves have been developed <strong>in</strong> some countries to simulatehydrocarbon fires <strong>in</strong> tunnels. Examples <strong>of</strong> such curves are <strong>the</strong> RABT/ZTV TunnelCurve <strong>in</strong> Germany [25] and <strong>the</strong> Rijkswaterstaat Tunnel Curve (RWS curve) <strong>in</strong> TheNe<strong>the</strong>rlands (based on laboratory scale tunnel tests performed by TNO <strong>in</strong> 1979 [26,27]). In connection with <strong>the</strong> RWS curve, <strong>the</strong> Dutch authorities require that <strong>the</strong>temperature <strong>of</strong> <strong>the</strong> <strong>in</strong>terface between <strong>the</strong> concrete and <strong>the</strong> protective cover<strong>in</strong>g doesnot exceed 380 °C and that <strong>the</strong> temperature <strong>of</strong> <strong>the</strong> re<strong>in</strong>forcement does not exceed250 °C. In France a modified version <strong>of</strong> <strong>the</strong> hydrocarbon curve is used9
<strong>On</strong> <strong>the</strong> <strong>Characteristics</strong> <strong>of</strong> <strong>Fires</strong> <strong>in</strong> <strong>Tunnels</strong>(HCmod), which is <strong>the</strong> traditional hydrocarbon curve <strong>in</strong>creased by a factor1300/1100.In Figure 2.1 <strong>the</strong> five, above mentioned, fire temperature curves are presentedgraphically (<strong>the</strong> first two hours).14001200Temperature [ o C]1000800600400200T Standard[ o C]T Hydrocarbon[ o C]T [ o C]RWST [ o C]RABT/ZTVT HC,mod[ o C]00 20 40 60 80 100 120Time [m<strong>in</strong>]Figure 2.1 Fire temperature curves used for test<strong>in</strong>g reaction <strong>of</strong> structures to heatexposure (<strong>the</strong> first two hours).PIARC recommends <strong>the</strong> use <strong>of</strong> <strong>the</strong> ISO 834 curve (60 m<strong>in</strong>) for cars and vans and <strong>the</strong>RWS curve or <strong>the</strong> modified HC curve (120 m<strong>in</strong>) for trucks and tankers [28, 29]. Therecommendations are particularly for tunnels that are immersed, under/<strong>in</strong>sidesuperstructures, or <strong>in</strong> unstable ground. For cut and cover tunnels or tunnels <strong>in</strong> stableground <strong>the</strong> recommendations can be decreased depend<strong>in</strong>g on <strong>the</strong> situation, but <strong>in</strong>most cases <strong>the</strong> same curves are used. These recommendations are agreed on toge<strong>the</strong>rwith <strong>the</strong> International Tunnell<strong>in</strong>g Association, ITA [30]. Accord<strong>in</strong>g to NFPA 502,<strong>the</strong> follow<strong>in</strong>g maximum temperatures are assumed for different types <strong>of</strong> vehiclefires: Passenger car = 400 ºC, Bus = 700 ºC, Heavy goods truck = 1000 ºC, andTanker = 1200 °C – 1400 ºC. In Swedish guidel<strong>in</strong>es for road tunnels <strong>the</strong> gas temperature<strong>in</strong> <strong>the</strong> tunnel is assumed to follow <strong>the</strong> HC curve [31]. The different fire curvesand <strong>the</strong>ir expressions are fur<strong>the</strong>r discussed <strong>in</strong> Section 3.3, where <strong>the</strong>y are comparedto <strong>the</strong> results from <strong>the</strong> Runehamar tests.It should be noted that temperature measurements are asscosiated with measurementuncerta<strong>in</strong>ties as o<strong>the</strong>r types <strong>of</strong> measurement. In fire experiments <strong>the</strong>rmocouples arecommonly used. In addition to ord<strong>in</strong>ary sensor uncerta<strong>in</strong>ties, <strong>the</strong>rmocouples can beaffected by radiation. The significance <strong>of</strong> this effect varies between situations depend<strong>in</strong>gon several conditions, e.g dimension and position <strong>of</strong> <strong>the</strong>rmocouple, temperaturedistribution, conditions <strong>of</strong> <strong>the</strong> flames and smoke, temperature <strong>of</strong> <strong>the</strong> surround<strong>in</strong>gs,etc. This means that that it can be difficult to compare temperature meas-10
2 Backgroundurements not corrected for radiation effects. In many cases <strong>the</strong> description <strong>of</strong> <strong>the</strong>conditions for a certa<strong>in</strong> test series is such that a correction <strong>of</strong> <strong>the</strong> measurementresults is difficult to perform. This should be kept <strong>in</strong> m<strong>in</strong>d when compar<strong>in</strong>g <strong>the</strong>temperature measurements from different test series and dur<strong>in</strong>g <strong>the</strong> discussion <strong>of</strong>flame lengths presented <strong>in</strong> this <strong>the</strong>sis. Reference to this type <strong>of</strong> uncerta<strong>in</strong>ty is notmade <strong>in</strong> each specific case. Some fur<strong>the</strong>r details on this problem and <strong>the</strong> <strong>in</strong>fluenceon <strong>the</strong> measurements <strong>in</strong> <strong>the</strong> Runehamar tunnel are, however, given <strong>in</strong> Paper I.11
<strong>On</strong> <strong>the</strong> <strong>Characteristics</strong> <strong>of</strong> <strong>Fires</strong> <strong>in</strong> <strong>Tunnels</strong>12
3 Fire experiments <strong>in</strong> tunnels3 Fire experiments <strong>in</strong> tunnels3.1 Different methods <strong>of</strong> estimat<strong>in</strong>g <strong>the</strong> HRR and some factors<strong>in</strong>fluenc<strong>in</strong>g <strong>the</strong> resultsThe Heat Release Rate (HRR) is a very central and important parameter whenstudy<strong>in</strong>g and def<strong>in</strong><strong>in</strong>g safety <strong>in</strong> connection with tunnel fires. In fact it is seen as <strong>the</strong>most important parameter used to def<strong>in</strong>e fire hazard [32]. It relates to several <strong>of</strong> <strong>the</strong>o<strong>the</strong>r parameters <strong>of</strong> importance, i.e. temperature, ventilation <strong>of</strong> smoke (e.g. <strong>the</strong> criticalvelocity that will be discussed below), flame length, radiation, fire spread etc.Therefore, different methods have been used to determ<strong>in</strong>e <strong>the</strong> HRR from tunnel fireexperiments. These methods can be summarized as:1. Extrapolation from values <strong>of</strong> <strong>the</strong> HRR from free burn<strong>in</strong>g tests, to tunnelconditions.2. Measur<strong>in</strong>g <strong>of</strong> <strong>the</strong> mass loss rate, ei<strong>the</strong>r by load cells (or scales <strong>of</strong> some k<strong>in</strong>d)or for liquid fires determ<strong>in</strong><strong>in</strong>g <strong>the</strong> flow <strong>of</strong> fuel needed to keep <strong>the</strong> liquidsurface at a certa<strong>in</strong> def<strong>in</strong>ed level.3. Calorimetry by measur<strong>in</strong>g ei<strong>the</strong>r <strong>the</strong> consumption <strong>of</strong> oxygen [33, 34] (see Eq.(3.1)) or <strong>the</strong> production <strong>of</strong> carbon dioxide and carbon monoxide [35]. If <strong>the</strong>fire is under-ventilated and significant amounts <strong>of</strong> o<strong>the</strong>r carbon conta<strong>in</strong><strong>in</strong>gcompounds are generated, <strong>the</strong>se can also be <strong>in</strong>cluded <strong>in</strong> <strong>the</strong> analyses [36].The advantage <strong>of</strong> <strong>the</strong> method based on <strong>the</strong> production <strong>of</strong> CO and CO 2 is that<strong>the</strong> changes <strong>in</strong> concentration <strong>of</strong> <strong>the</strong>se species is relatively large compared to<strong>the</strong> decrease <strong>in</strong> oxygen concentration. The disadvantage is that it is more fueldependent than <strong>the</strong> method based on oxygen consumption.A common way to express <strong>the</strong> heat release rate based on oxygen consumptioncalorimetry is by <strong>the</strong> follow<strong>in</strong>g expression:0O20O20( MOM ) ( )2 air⋅ 1−XH 2O1−( XO( 1−X)2CO20− ( X ⋅ ( 1−X ) ( 1−X)E ⋅ m&⋅Q& = (3.1)α −1+X XO2CO2CO2whereQ & = <strong>the</strong> heat release rate from <strong>the</strong> fire, HRR [kW]E = amount <strong>of</strong> energy developed per consumed kilogram <strong>of</strong> oxygen [kJ/kg]m& = mass flow <strong>in</strong> exhaust duct [kg/s]M = molecular weight for oxygen [g/mol]O 2M air = molecular weight for <strong>the</strong> gas flow <strong>in</strong> <strong>the</strong> duct, [g/mol]α = ratio between <strong>the</strong> number <strong>of</strong> moles <strong>of</strong> combustion products <strong>in</strong>clud<strong>in</strong>gnitrogen and <strong>the</strong> number <strong>of</strong> moles <strong>of</strong> reactants <strong>in</strong>clud<strong>in</strong>g nitrogen (expansionfactor) [-]X = mole fraction for O 2 <strong>in</strong> <strong>the</strong> ambient air, measured on dry gases [-]0O 20X CO 2= mole fraction for CO 2 <strong>in</strong> <strong>the</strong> ambient air, measured on dry gases [-]13
<strong>On</strong> <strong>the</strong> <strong>Characteristics</strong> <strong>of</strong> <strong>Fires</strong> <strong>in</strong> <strong>Tunnels</strong>0X = mole fraction for H H 2 O2 O <strong>in</strong> <strong>the</strong> ambient air [-]XO 2= mole fraction for O 2 <strong>in</strong> <strong>the</strong> flue gases, measured on dry gases [-]XCO 2= mole fraction for CO 2 <strong>in</strong> <strong>the</strong> flue gases, measured on dry gases [-]All methods are assigned different uncerta<strong>in</strong>ties. Us<strong>in</strong>g free burn<strong>in</strong>g results can leadto an underestimation <strong>of</strong> <strong>the</strong> HRR, s<strong>in</strong>ce both <strong>the</strong> fire growth and fire spread rate and<strong>the</strong> maximum HRR can <strong>in</strong>crease <strong>in</strong> a tunnel, relative to free-burn<strong>in</strong>g, due to <strong>the</strong><strong>in</strong>creased feedback from <strong>the</strong> flames and <strong>the</strong> hot smoke layer. This is a well knownphenomenon from enclosure fires [37], but has also been seen <strong>in</strong> tunnel fire tests[38]. Takeda and Akita studied this phenomenon and showed that it is also related to<strong>the</strong> ventilation factor [39]. Carvel et al. have studied both <strong>the</strong> effect <strong>of</strong> <strong>the</strong> tunnel on<strong>the</strong> HRR [40] and <strong>the</strong> effect <strong>of</strong> <strong>the</strong> ventilation on <strong>the</strong> HRR from a fire <strong>in</strong> a tunnel.The former is fur<strong>the</strong>r discussed <strong>in</strong> this section, while <strong>the</strong> effect <strong>of</strong> <strong>the</strong> ventilation isdiscussed <strong>in</strong> Section 5.2.Saito et al. showed that <strong>the</strong> mass loss rate for liquid fires <strong>in</strong>creased <strong>in</strong> a tunnelcompared to free-burn<strong>in</strong>g conditions [41]. The tests were performed with pool fireswith methanol (0.1 m, 0.15 m, 0.2 m, and 0.25 m <strong>in</strong> diameter) and heptane (0.15 m<strong>in</strong> diameter). For <strong>the</strong> two smallest pools <strong>the</strong> effect <strong>of</strong> <strong>the</strong> tunnel (with an air velocity0.08 m/s) on <strong>the</strong> mass loss rate <strong>of</strong> methanol was only a few percent, while for <strong>the</strong>0.25 m diameter pool <strong>the</strong> mass loss rate <strong>in</strong> <strong>the</strong> tunnel was <strong>in</strong>creased by a factor 2.7compared to free-burn<strong>in</strong>g conditions. For heptane, <strong>the</strong> tunnel (with an air velocity <strong>of</strong>0.43 m/s) <strong>in</strong>creased <strong>the</strong> mass loss rate approximately by a factor 4. For both fuels <strong>the</strong>mass loss rate was significantly decreased with <strong>in</strong>creas<strong>in</strong>g air velocity. This illustrates<strong>the</strong> importance <strong>of</strong> <strong>the</strong> heat feed back from <strong>the</strong> flames, hot gases, and tunnelstructure on <strong>the</strong> mass loss rate. This issue is fur<strong>the</strong>r discussed <strong>in</strong> Section 5.2.Ingason performed pool fire tests <strong>in</strong> a model scale tunnel, us<strong>in</strong>g heptane, methanol,and xylene as fuels [42, 43]. For methanol <strong>the</strong> free burn<strong>in</strong>g mass loss rate was0.017 kg/s/m 2 . This value should be compared to 0.015 kg/s/m 2 for a natural ventilatedtest <strong>in</strong> a tunnel and 0.020 kg/s/m 2 for a test with forced ventilation (4.8 m/s). If<strong>the</strong> forced ventilated case is considered (an <strong>in</strong>crease <strong>of</strong> 18 %), <strong>the</strong> result iscomparable to <strong>the</strong> results <strong>of</strong> Saito et al. (for <strong>the</strong> case 0.20 m diameter pool and an airvelocity <strong>of</strong> 0.2 m/s; or 0.25 m diameter pool and an air velocity <strong>of</strong> 0.39 m/s orhigher). In <strong>the</strong> test with natural ventilation <strong>the</strong> mass loss rate, however, decreasedcompared to <strong>the</strong> free-burn<strong>in</strong>g case. For heptane, <strong>the</strong> maximum <strong>in</strong>crease due to <strong>the</strong>tunnel was by a factor <strong>of</strong> 3.3 (0.13 kg/s/m 2 (u = 1 m/s) compared to 0.04 kg/s/m 2(free-burn<strong>in</strong>g)).Carvel et al. performed an analysis <strong>of</strong> different experiments <strong>in</strong> tunnels and showedthat <strong>the</strong> width <strong>of</strong> <strong>the</strong> tunnel has a significant <strong>in</strong>fluence on <strong>the</strong> HRR from a fire <strong>in</strong> atunnel [40]. This result can be expla<strong>in</strong>ed by <strong>the</strong> radiation to <strong>the</strong> pool (from walls andfrom <strong>the</strong> ceil<strong>in</strong>g layer), <strong>the</strong> temperature <strong>in</strong>side <strong>the</strong> tunnel, and also <strong>the</strong> flow patternnear <strong>the</strong> fire. The work <strong>in</strong>cludes an extensive summary <strong>of</strong> experiments <strong>in</strong>volv<strong>in</strong>gliquid pool, wood cribs, and cars and how <strong>the</strong> HRR from <strong>the</strong>se tests <strong>in</strong> tunnels iscompared to similar free burn<strong>in</strong>g tests. The same authors gave a relationship for <strong>the</strong><strong>in</strong>fluence <strong>of</strong> <strong>the</strong> width <strong>of</strong> <strong>the</strong> tunnel on <strong>the</strong> HRR [44], i.e.:14
3 Fire experiments <strong>in</strong> tunnelsQ &tunnel3⎛ W ⎞⎜ ⎛ f ⎞= 1 + 24 ⎟Q&open⎜⎜W⎟(3.2)⎟t⎝ ⎝ ⎠ ⎠where W f is <strong>the</strong> width <strong>of</strong> <strong>the</strong> fire and W t is <strong>the</strong> width <strong>of</strong> <strong>the</strong> tunnel. It should be notedthat <strong>the</strong>re were some restrictions <strong>in</strong> <strong>the</strong> development <strong>of</strong> <strong>the</strong> equation. The first is thatit is not valid for methanol fires. The ma<strong>in</strong> reasons for this is that methanol burnsdifferently, with lower HRR, than o<strong>the</strong>r liquid fuels and that it produces much lesssmoke (which means both less radiation to <strong>the</strong> walls and less radiation to <strong>the</strong> fuel)than o<strong>the</strong>r fuels. The effect <strong>of</strong> <strong>the</strong> walls comes first when <strong>the</strong> width <strong>of</strong> <strong>the</strong> methanolpool constitute a larger part <strong>of</strong> <strong>the</strong> tunnel width (start<strong>in</strong>g when W f / W t > 0.5 and <strong>the</strong>enhancement factor passes 2 when W f / W t is approximately 0.75) [45]. <strong>On</strong> <strong>the</strong> o<strong>the</strong>rhand this might also mean that methanol is not as relevant as o<strong>the</strong>r fuels whenstudy<strong>in</strong>g safety <strong>in</strong> tunnels. The o<strong>the</strong>r restriction is that <strong>the</strong> relationship does not holdwhen <strong>the</strong> fire becomes so large that <strong>the</strong> ventilation can be said to be limited and<strong>the</strong>reby <strong>the</strong> HRR is not develop<strong>in</strong>g <strong>in</strong> <strong>the</strong> same way. This is an important restrictions<strong>in</strong>ce this means that o<strong>the</strong>r parameters also need to be <strong>in</strong>cluded <strong>in</strong> <strong>the</strong> analyses todeterm<strong>in</strong>e whe<strong>the</strong>r <strong>the</strong> relationship holds for <strong>the</strong> situation <strong>of</strong> <strong>in</strong>terest. The generalconclusion was, however, that for <strong>the</strong> same type <strong>of</strong> fire, a wider tunnel is safer than anarrower one.The same analysis showed that <strong>the</strong> tunnel height is not significant. However, <strong>the</strong> use<strong>of</strong> some <strong>of</strong> <strong>the</strong> experimental results to support this statement is questionable. In onecase [41], <strong>the</strong> HRR <strong>in</strong> <strong>the</strong> tunnel tests compared to open air tests <strong>in</strong>creased significantlywith pool dimensions. This is expected s<strong>in</strong>ce <strong>the</strong> radiation impact will belarger as <strong>the</strong> temperature is <strong>in</strong>creased. The distance to <strong>the</strong> ceil<strong>in</strong>g was not changeddur<strong>in</strong>g this test series. Despite this, <strong>the</strong> result was taken as evidence contradict<strong>in</strong>g <strong>the</strong>hypo<strong>the</strong>sis <strong>of</strong> <strong>the</strong> <strong>in</strong>fluence <strong>of</strong> <strong>the</strong> ceil<strong>in</strong>g height. This <strong>in</strong>terpretation is not correct,however; <strong>in</strong>stead a value correspond<strong>in</strong>g to “no <strong>in</strong>formation” should be used.In ano<strong>the</strong>r test series [46], <strong>the</strong> <strong>in</strong>crease <strong>in</strong> HRR for pool fires <strong>in</strong> <strong>the</strong> tunnel comparedto open air tests was approximately <strong>the</strong> same as <strong>the</strong> <strong>in</strong>crease <strong>in</strong> HRR for wood cribfires compared to open air tests. Aga<strong>in</strong> this was taken as evidence that <strong>the</strong> ceil<strong>in</strong>gheight is not important. This is, however, for several reasons also a mislead<strong>in</strong>g conclusion.First, one cannot compare pool fires with wood crib fires <strong>in</strong> this way s<strong>in</strong>ce<strong>the</strong>y burn very differently and <strong>the</strong>reby react very differently to radiation. Second, <strong>the</strong>top <strong>of</strong> <strong>the</strong> wood crib was at a higher level than <strong>the</strong> pool fire, but a wood crib is notsolely burn<strong>in</strong>g on <strong>the</strong> upper surface but is burn<strong>in</strong>g three-dimensionally and <strong>the</strong> position<strong>of</strong> <strong>the</strong> lower level <strong>of</strong> <strong>the</strong> wood crib is also important. This has, for example,been shown by Heskestad who showed that <strong>the</strong> flame height for 3D fires are bestcorrelated measured to <strong>the</strong> base <strong>of</strong> <strong>the</strong> fire [47]. To verify or underm<strong>in</strong>e <strong>the</strong> hypo<strong>the</strong>sis<strong>of</strong> <strong>the</strong> importance <strong>of</strong> <strong>the</strong> ceil<strong>in</strong>g height or <strong>the</strong> distance between <strong>the</strong> fuel and <strong>the</strong>ceil<strong>in</strong>g, identical tests with varied elevation <strong>of</strong> <strong>the</strong> fuel need to be performed.All toge<strong>the</strong>r, <strong>the</strong>re are several factors that affect <strong>the</strong> HRR from a fire <strong>in</strong> a specifictunnel, both compared to fires <strong>in</strong> <strong>the</strong> open and compared to a fire <strong>in</strong> <strong>the</strong> same type <strong>of</strong>object <strong>in</strong> ano<strong>the</strong>r tunnel. Some important factors are <strong>the</strong> type <strong>of</strong> fuel (e.g. chemicalcomposition; liquid or solid), geometry (2D such as pool fire, 3D such as wood crib,15
<strong>On</strong> <strong>the</strong> <strong>Characteristics</strong> <strong>of</strong> <strong>Fires</strong> <strong>in</strong> <strong>Tunnels</strong>or someth<strong>in</strong>g <strong>in</strong> between such as a 3D object ma<strong>in</strong>ly burn<strong>in</strong>g on <strong>the</strong> outer surfaces),radiation from walls, ceil<strong>in</strong>g and upper layer, amount <strong>of</strong> fuel (i.e. is <strong>the</strong> fire easilyreach<strong>in</strong>g a fuel controlled situation or is <strong>the</strong> flame/fire spread a long phase that canbe speeded up by <strong>the</strong> tunnel), and ventilation. To complicate <strong>the</strong> situation, several <strong>of</strong><strong>the</strong>se factors <strong>in</strong>teract and can have different effects depend<strong>in</strong>g on <strong>the</strong> situation. Many<strong>of</strong> <strong>the</strong> comparisons performed are, unfortunately, made between test series wheremore than one parameter has varied mak<strong>in</strong>g direct conclusions concern<strong>in</strong>g <strong>the</strong> significance<strong>of</strong> a specific parameter difficult.Us<strong>in</strong>g <strong>the</strong> mass loss rate for determ<strong>in</strong><strong>in</strong>g <strong>the</strong> HRR <strong>in</strong>volves two uncerta<strong>in</strong>ties <strong>in</strong>particular: it can be difficult to measure <strong>the</strong> mass loss rate accurately (load cells canbe affected by <strong>the</strong> environment (high temperatures) and <strong>the</strong> signal can start to drift (asituation <strong>of</strong> <strong>in</strong>stability or similar can also arise)) and it can be difficult to keep aconstant level <strong>of</strong> <strong>the</strong> fuel surface and accurately measure <strong>the</strong> flow rate <strong>of</strong> fuel neededto keep this level <strong>in</strong> a large-scale test, even if <strong>the</strong>re are methods to solve this (see forexample [41] or [48]) . The second important source <strong>of</strong> error, when calculat<strong>in</strong>g <strong>the</strong>HRR from <strong>the</strong> mass loss rate, is <strong>the</strong> value <strong>of</strong> <strong>the</strong> effective heat <strong>of</strong> combustion. This isnot a constant value; <strong>the</strong> combustion efficiency is not one and it can vary both <strong>in</strong>time and between different experimental set-ups and conditions.The calorimetry technique is, if used under controlled conditions, <strong>the</strong> most accuratemethod to calculate <strong>the</strong> HRR. Therefore, this method is used <strong>in</strong> most standardapplications for fire test<strong>in</strong>g <strong>in</strong> laboratories. <strong>On</strong>e reason for <strong>the</strong> broad application <strong>of</strong><strong>the</strong> oxygen consumption calorimetry is <strong>the</strong> fact that many common fuels releaseapproximately <strong>the</strong> same amount <strong>of</strong> energy per kg O 2 consumed, i.e. 13.1 MJ/kg O 2[33]. This gives a good estimate <strong>of</strong> <strong>the</strong> HRR even if <strong>the</strong> fuel composition is notcompletely known. If <strong>the</strong> fuel composition is known <strong>the</strong> method can be used withconstants for <strong>the</strong> specific fuel.There are, however, some sources <strong>of</strong> uncerta<strong>in</strong>ties connected to <strong>the</strong> calorimetricmethod. In Eq. (3.1), <strong>the</strong> HRR is l<strong>in</strong>early dependent on <strong>the</strong> mass flow rate and<strong>the</strong>refore this needs to be accurately estimated. In a tunnel <strong>the</strong>re are two importantsources <strong>of</strong> errors, one is <strong>the</strong> calculation <strong>of</strong> <strong>the</strong> mean velocity from velocity measurementsand <strong>the</strong> o<strong>the</strong>r is <strong>the</strong> determ<strong>in</strong>ation <strong>of</strong> <strong>the</strong> cross-section <strong>of</strong> <strong>the</strong> tunnel when <strong>the</strong>roughness is large and <strong>the</strong> cross-sectional area can vary (for a fur<strong>the</strong>r discussion <strong>of</strong><strong>the</strong>se issues see Paper II and reference [49]). Fur<strong>the</strong>r, <strong>the</strong> gas concentrations need tobe analysed <strong>in</strong> a representative manner. O<strong>the</strong>r aspects <strong>of</strong> <strong>the</strong> uncerta<strong>in</strong>ty related to<strong>the</strong> calorimetric method are described <strong>in</strong> <strong>the</strong> literature, e.g. by Enright andFleischmann [50, 51] and by Axelsson et al. [52, 53].3.2 Summary <strong>of</strong> experimentsThe first extensive large-scale tunnel test series where <strong>the</strong> HRR and gastemperatures from various large vehicles (passenger cars, tra<strong>in</strong> wagons, subway cars,and HGV trailer) were measured was <strong>in</strong> <strong>the</strong> EUREKA 499 –FIRETUN test series <strong>in</strong>1990 to 1992 [54]. The peak HRRs measured varied between 6 and 128 MW and <strong>the</strong>gas temperatures at ceil<strong>in</strong>g height above <strong>the</strong> vehicles between 200 o C and 1100 o C.Ano<strong>the</strong>r major series <strong>of</strong> fire test <strong>in</strong> tunnels was performed <strong>in</strong> <strong>the</strong> Memorial Tunnel <strong>in</strong>Massachusetts <strong>in</strong> 1995 [48]. However, <strong>the</strong> fire load <strong>in</strong> this test series did not consist16
3 Fire experiments <strong>in</strong> tunnels<strong>of</strong> vehicles, but <strong>of</strong> liquid pool fires <strong>of</strong> different sizes, vary<strong>in</strong>g between 20 and100 MW with a maximum gas temperatures at <strong>the</strong> ceil<strong>in</strong>g <strong>of</strong> approximately 1360 ºC.The ma<strong>in</strong> purpose <strong>of</strong> <strong>the</strong> Memorial tests was to <strong>in</strong>vestigate <strong>the</strong> effects <strong>of</strong> differentventilation systems on <strong>the</strong> smoke control <strong>in</strong> tunnels. The test series <strong>in</strong>cluded a largenumber <strong>of</strong> well <strong>in</strong>strumented tests. In order to simulate <strong>the</strong> cross-section <strong>of</strong> vehicles(pool fires were used <strong>in</strong> all tests) and <strong>the</strong>ir effect on <strong>the</strong> ventilation, movable steelplates were placed <strong>in</strong> different positions.O<strong>the</strong>r important test series <strong>in</strong>clude <strong>the</strong> one <strong>in</strong> <strong>the</strong> Offenegg tunnel (Switzerland,1965)us<strong>in</strong>g petrol pools from 6.6 to 95 m 2 [55], a disused railway tunnel <strong>in</strong>Glasgow (Scotland, 1970) [13], <strong>the</strong> Zwenberg tunnel (Austria, 1975) [56] us<strong>in</strong>gpetrol pool fires from 6.8 to 13.6 m 2 , and <strong>the</strong> P.W.R.I. experiments (Japan, 1980)us<strong>in</strong>g pool fires <strong>of</strong> 4 and 6 m², passenger cars and buses [57]. No HRR measurementsbased on calorimetry were performed <strong>in</strong> any <strong>of</strong> <strong>the</strong>se tests. In <strong>the</strong> Ofeneggtunnel tests gas temperatures up to 1325 ºC were measured. In <strong>the</strong> Ne<strong>the</strong>rlands,small-scale tests us<strong>in</strong>g petrol pans were performed <strong>in</strong> an 8 m long tunnel, 2 m highand 2 m wide [27]. In <strong>the</strong>se tests, gas temperatures <strong>in</strong> <strong>the</strong> range <strong>of</strong> 900 – 1360 ºCwere measured. The Rijkswaterstaat Tunnel Curve (<strong>the</strong> RWS Curve) <strong>in</strong> <strong>the</strong> Ne<strong>the</strong>rlandsis based on <strong>the</strong>se tests. The RWS curve represents a worst-case scenario <strong>of</strong> a300 MW petrol tanker burn<strong>in</strong>g <strong>in</strong> a tunnel for two hours.In 1985 two large-scale tests <strong>in</strong> a tunnel us<strong>in</strong>g wood cribs as fuel to simulate a fire <strong>in</strong>a subway car (80 GJ), and <strong>in</strong> two passenger cars (11.7 GJ) collid<strong>in</strong>g <strong>in</strong> a tunnel, wereperformed [58, 59].In 2002, a series <strong>of</strong> tests were performed <strong>in</strong> <strong>the</strong> Second Benelux tunnel <strong>in</strong> <strong>the</strong>Ne<strong>the</strong>rlands [60]. HRR and temperatures from pan fires (5, 20 MW) and vehiclefires such as passenger cars, vans and HGV fire loads, were measured. The peakHRR (based on weight loss) varied between 4.5 and 26 MW and <strong>the</strong> maximum gastemperatures at <strong>the</strong> ceil<strong>in</strong>g did not exceed 600 ºC.In 2003, large-scale tunnel tests were carried out with HGV cargos <strong>in</strong> <strong>the</strong>Runehamar tunnel <strong>in</strong> Norway (see Paper I and II). The tunnel is a 1600 m longtwo-way, asphalted road tunnel that was taken out <strong>of</strong> use <strong>in</strong> <strong>the</strong> late 1980s. It is 6 mhigh and 9 m wide, with a slope vary<strong>in</strong>g between 0.5 % uphill and 1 % downhill (<strong>in</strong>relation to <strong>the</strong> air flow direction). In total, four tests were performed with fires <strong>in</strong> aHGV trailer set-up. In three tests mixtures <strong>of</strong> different chosen cellulose and plasticmaterials were used, and <strong>in</strong> one test a “real” commodity consist<strong>in</strong>g <strong>of</strong> furniture andfixtures was used. In all tests <strong>the</strong> mass ratio was approximately 80 % cellulose and20 % plastic. A polyester tarpaul<strong>in</strong> covered <strong>the</strong> cargo <strong>in</strong> all cases (<strong>in</strong> test T4 only <strong>the</strong>upstream end and <strong>the</strong> downstream end <strong>of</strong> <strong>the</strong> set-up were covered). The four tests aresummarized <strong>in</strong> Table 3.2. The maximum heat release rates varied between 66 MWand 202 MW. The maximum gas temperatures varied between 1250 ºC and 1365 ºC.17
<strong>On</strong> <strong>the</strong> <strong>Characteristics</strong> <strong>of</strong> <strong>Fires</strong> <strong>in</strong> <strong>Tunnels</strong>Table 3.1 Overview <strong>of</strong> selected tunnel fire test series, <strong>in</strong>dicat<strong>in</strong>g performed measurements[13, 27, 48, 54, 57, 60-65] and Papers I-II and V-VII.LocationOfenegg, CH1965Glasgow, UK,1970Zwenberg, AT1975TNO, NL,1979-80P.W.R.I, Japan1980KakeihigasiTunnel,P.W.R.I, Japan1980TUB-VTT,F<strong>in</strong>land, 1985Repparfjord,NOEUREKA1990-92Memorial, USA1993-95Shimizu No. 3,Japan, 20012 nd Benelux,NL, 2002Runehamar,NO2003No <strong>of</strong>testsLength[m]Height[m]Crosssection[m 2 ]Objects11 190 6 23 Petrol (6.6,47.5, 95 m 2 )5 620 5.2 39.5 Keros<strong>in</strong>e(1.44, 2.88,5.76 m 2 )30 390 3.9 20 Petrol (6.8,13.6 m 2 ),wood, rubber2 8 2 4 Petrol (~3m 2 )16 700 ~6.8 57.3 Petrol (4, 6m 2 ),passengercar, bus8 3277 ~6.8 58 Petrol (4 m 2 ),bus2 140 5 24-31 Wood cribs(simulat<strong>in</strong>gsubwaycoach andcollision <strong>of</strong>two cars)21 2300 4.8-5.5 25-35 Wood cribs,cars, metrocar, rail cars,heptane,HGV98 853 4.4 and7.936 and60Fuel oil (4.5– 45 m 2 )10 1120 8.5 115 Petrol (1, 4,9 m 2 ), cars,bus14 872 5.1 50 n-heptane+toulene, car,van, woodpallets (HGVmock-up)4 1600 5-6 32-47 Cellulose,plastic,furnitureMeasurements CommentsT, u, CO, O 2 ,smoke spread,m& (estimated)fT, smokespreadT, u, CO, CO 2 ,O 2 , NO x , THC,visibilityS<strong>in</strong>gle trackrail tunnel,dead end,spr<strong>in</strong>klerDisusedrailwaytunnelDisusedrailwaytunnelT, humidity ExperimentaltunnelT, u, CO, OD, Special testm&f, radiation tunnel,spr<strong>in</strong>klerT, u, CO, O 2 ,OD, m&f,radiationm&T, u,f, CO,CO 2 , O 2 ,visibility,smoke heightHRR, T, u, CO,CO 2 , O 2 , SO 2 ,C x H y , NO, OD,visibility, soot,smoke spread,PCDD/F, PAH,PBDD/F,m&T, u, CO, CO 2 ,CH 4 , THC,m&f, visibility,stratificationT, u, OD,radiationm&T, u,f, CO,OD, radiation,smoke front,visibility, firedetectionHRR, T, PT, u,CO, CO 2 , O 2 ,HCN, H 2 O,isocyanates,OD, radiationfIn use roadtunnel,spr<strong>in</strong>klerDisusedcavernsystemDisusedtransportationtunnel853 m,8.8x4.3, foamNew roadtunnel,spr<strong>in</strong>klerNew roadtunnel,spr<strong>in</strong>klerDisused roadtunnel18
3 Fire experiments <strong>in</strong> tunnelsThe results from some <strong>of</strong> <strong>the</strong> tests series described here are discussed <strong>in</strong> <strong>the</strong> nextsection. Fur<strong>the</strong>rmore, results from a reduced scale test series are presented <strong>in</strong>Section 5.2, on <strong>the</strong> effect <strong>of</strong> <strong>the</strong> ventilation on <strong>the</strong> HRR. More details on <strong>the</strong> testseries presented <strong>in</strong> Table 3.1 are given by Ingason and Lönnermark [66]. A comprehensivelist <strong>of</strong> experimental test series <strong>in</strong> large-scale, reduced-scale, or laboratoryscale tunnel is given by Carvel and Marlair [67].Table 3.2 Description <strong>of</strong> <strong>the</strong> commodities used <strong>in</strong> <strong>the</strong> Runehamar tests.TestnrDescription <strong>of</strong> <strong>the</strong> fire load a) Target Totalweight,excl target[kg]T1 360 wooden pallets measur<strong>in</strong>g 1200 × 800× 150 mm, 20 wooden pallets measur<strong>in</strong>g1200 × 1000 × 150 mm and 74 PE plasticpallets measur<strong>in</strong>g 1200 × 800 × 150 mm,122 m2 polyester tarpaul<strong>in</strong>T2 216 wood pallets and 240 PUR mattressesmeasur<strong>in</strong>g 1200 × 800 × 150 mm, 122 m2polyester tarpaul<strong>in</strong>T3T4Furniture and fixtures (tightly packedplastic and wood cab<strong>in</strong>et doors, upholsteredPUR arm rests, upholstered s<strong>of</strong>as, stuffedanimals, potted plant (plastic), toy house <strong>of</strong>wood, plastic toys). 10 large rubber tyres(800 kg), 122 m2 polyester tarpaul<strong>in</strong>600 corrugated paper cartons with <strong>in</strong>teriors(600 mm × 400 mm × 500 mm ; L × W ×H) and 15 % <strong>of</strong> total mass <strong>of</strong> unexpandedPS cups (18000 cups) and 40 wood pallets(1200 × 1000 × 150 mm), 10 m 2 polyestertarpaul<strong>in</strong>a) PE = Polye<strong>the</strong>ne, PUR = Polyurethane, PS = Polystyrene32 woodenpallets and6 PE pallets20 woodenpallets and20 PURmattressesUpholstereds<strong>of</strong>a andarm rests3.3 Summary <strong>of</strong> results from fire experimentsTotalweight,<strong>in</strong>cl target[kg]Theoreticalcalorificenergy[GJ]10160 11010 2476390 6930 1358330 8550 179- 2850 - 62The details regard<strong>in</strong>g <strong>the</strong> results from <strong>the</strong> Runehamar tests are given <strong>in</strong> Papers I, II,V, VI, and VII. In this section <strong>the</strong>se results are compared to results from o<strong>the</strong>r testseries with a focus on temperature and HRR measurements.Ingason and Lönnermark presented energy content, peak HRR, and time to peakHRR for different types <strong>of</strong> road vehicles (mostly passenger cars and simulated HGVtrailers) from a number <strong>of</strong> test series [68]. Included <strong>in</strong> that summary were alsoresults from <strong>the</strong> Runehamar tests. The values from <strong>the</strong> Runehamar tests were latersomewhat altered due to a more thorough analysis <strong>of</strong> <strong>the</strong> HRR calculations (seePaper II). A summary <strong>of</strong> <strong>the</strong> data from <strong>the</strong> above mentioned vehicle fire tests ispresented <strong>in</strong> Table 3.3.19
<strong>On</strong> <strong>the</strong> <strong>Characteristics</strong> <strong>of</strong> <strong>Fires</strong> <strong>in</strong> <strong>Tunnels</strong>Table 3.3 Summary <strong>of</strong> HRR data from fires <strong>in</strong> different types <strong>of</strong> vehicles [64, 65,68-75] and Paper II.VehicleNo. <strong>of</strong>testsEnergy [GJ]Peak HRR[MW]Average peakHRR [MW]Time to Peak[m<strong>in</strong>]Passenger car 15 2 – 8 1.5 – 8.5 4.1 10 – 382 cars 7 5 – 10 5.6 – 10 7.6 13 – 553 cars 1 NA 8.9 8.9 33Bus 2 41 a) 29 – 30 29.5 7 – 8HGV trailers 10 10 – 244 13 – 202 - b) 8 – 18a) Information on energy content available only for one <strong>of</strong> <strong>the</strong> buses; <strong>the</strong> value 41 GJ corresponds to<strong>the</strong> bus giv<strong>in</strong>g a peak HRR <strong>of</strong> 29 MW.b) The test set-ups were too different for an average to be <strong>of</strong> <strong>in</strong>terest.The vehicle data shows that <strong>the</strong>re is a correlation between <strong>the</strong> energy content and <strong>the</strong>maximum HRR developed. In Figure 3.1 this is shown graphically. There is a scatter<strong>in</strong> <strong>the</strong> data and <strong>the</strong>re are differences <strong>in</strong> test conditions, but <strong>the</strong>re is clear relationshipbetween <strong>the</strong> maximum HRR and <strong>the</strong> energy content. The correlations were derivedseparately for passenger cars (<strong>in</strong>clude tests both with one and two cars) and HGVs,respectively. This was done due to <strong>the</strong> difference <strong>in</strong> scale. However, <strong>the</strong> relationshipbetween <strong>the</strong> maximum HRR and <strong>the</strong> energy content is very similar for <strong>the</strong> twogroups. For passenger cars Q& Q = 0.868 MW/GJ (R = 0.840) and for HGVsmaxtotQ& Q max tot= 0.866 MW/GJ (R = 0.910). Note that <strong>the</strong> regression l<strong>in</strong>es have beenforced to pass <strong>the</strong> orig<strong>in</strong>. Consider<strong>in</strong>g <strong>the</strong> limited amount <strong>of</strong> test data available forHGVs, <strong>the</strong> assumption that <strong>the</strong> l<strong>in</strong>e passes <strong>the</strong> orig<strong>in</strong> is considered to be valid. For<strong>the</strong> only case with a bus, with enough data, <strong>the</strong> relationship is approximately 0.7MW/GJ.HRRmax [MW]108642Passenger carHRR Passenger car0.8678xHRRmax [MW]25020015010050HRR HGV0.8664xHGV00 2 4 6 8 10 12Energy [GJ]00 50 100 150 200 250 300Energy [GJ]a) b)Figure 3.1 Relationship between maximum HRR and total calorific content for a)passenger cars and b) HGVs. The straight l<strong>in</strong>es are l<strong>in</strong>ear regressionthrough <strong>the</strong> orig<strong>in</strong>. In <strong>the</strong> case <strong>of</strong> passenger cars, <strong>the</strong> outlier [8.5 GJ; 1.7MW] has not been <strong>in</strong>cluded s<strong>in</strong>ce <strong>the</strong> test was ventilation controlled.<strong>On</strong>e <strong>of</strong> <strong>the</strong> data po<strong>in</strong>ts <strong>in</strong> Figure 3.1a is very far from <strong>the</strong> regression l<strong>in</strong>e and thispo<strong>in</strong>t was not <strong>in</strong>cluded <strong>in</strong> <strong>the</strong> regression as this test had restricted ventilation to givea maximum possible HRR <strong>of</strong> 2 MW. This shows <strong>the</strong> importance <strong>of</strong> <strong>the</strong> ventilationand that <strong>the</strong> actual situation affects how well <strong>the</strong> results will agree with <strong>the</strong> correla-20
3 Fire experiments <strong>in</strong> tunnelstion <strong>in</strong> Figure 3.1. The type and geometry <strong>of</strong> <strong>the</strong> fuel are also important for <strong>the</strong> maximumHRR <strong>in</strong> a specific case.In Paper IV, car fire test data conta<strong>in</strong><strong>in</strong>g an extensive analysis <strong>of</strong> fire gases andext<strong>in</strong>guish<strong>in</strong>g water is presented. Actually, three tests were performed: a fire started<strong>in</strong> <strong>the</strong> eng<strong>in</strong>e compartment, and two started <strong>in</strong> <strong>the</strong> coupé. However, <strong>the</strong>se three testsare presented as a s<strong>in</strong>gle test <strong>in</strong> <strong>the</strong> paper as <strong>the</strong>y were performed consecutively, withsome <strong>of</strong> <strong>the</strong> cumulative measurements be<strong>in</strong>g conducted across all three tests. Dur<strong>in</strong>g<strong>the</strong>se tests <strong>the</strong> maximum HRR was approximately 3.5 MW. All fires were ext<strong>in</strong>guished.The third test, which was <strong>the</strong> largest one, was ext<strong>in</strong>guished when <strong>the</strong> HRRhad passed its maximum value. The total developed energy was calculated to be3.8 GJ. Due to <strong>the</strong> ext<strong>in</strong>guishments <strong>the</strong> values cannot be used <strong>in</strong> deriv<strong>in</strong>g <strong>the</strong> correlationbetween <strong>the</strong> maximum HRR and <strong>the</strong> energy content, but assum<strong>in</strong>g that both <strong>the</strong>HRR and <strong>the</strong> total energy would have been higher if <strong>the</strong> tests had not been <strong>in</strong>terrupted,<strong>the</strong> values <strong>in</strong>dicate that <strong>the</strong>se results would also fit well <strong>in</strong>to <strong>the</strong> correlation.In Figure 3.2 time resolved HRR data is presented graphically for <strong>the</strong> HGVsimulation tests summarized <strong>in</strong> Table 3.3 [68]. From <strong>the</strong> results several conclusionscan be drawn. Prior to <strong>the</strong> Runehamar test series, only one fire test <strong>in</strong> a tunnel hadbeen performed where a HRR higher than 100 MW was registered, i.e. <strong>the</strong> HGVtests <strong>in</strong> <strong>the</strong> EUREKA test series. In <strong>the</strong> Runehamar tests, three tests had higher HRRthan 100 MW and one tests (T4) had a maximum HRR <strong>of</strong> 66 MW. In o<strong>the</strong>r words,all <strong>the</strong> Runehamar tests had maximum HRR higher, and <strong>in</strong> most cases much higher,than those suggested <strong>in</strong> <strong>the</strong> guidel<strong>in</strong>es described <strong>in</strong> Section 2.2.1. Indeed, <strong>the</strong>maximum HRR <strong>in</strong> <strong>the</strong> tests with wooden and plastic pallets was higher than200 MW. This is <strong>in</strong> <strong>the</strong> same order <strong>of</strong> magnitude as <strong>the</strong> HRR <strong>of</strong>ten estimated fortanker fires. <strong>On</strong>e should keep <strong>in</strong> m<strong>in</strong>d that <strong>in</strong> all <strong>the</strong> Runehamar tests and <strong>in</strong> <strong>the</strong>EUREKA HGV test, ord<strong>in</strong>ary (i.e. non-hazardous) cargoes were used. Thus, <strong>the</strong>sevalues cannot be expla<strong>in</strong>ed as related only to hazardous goods. When loaded onHGVs, ord<strong>in</strong>ary goods can be considered to be hazardous <strong>in</strong> terms <strong>of</strong> <strong>the</strong> potentialfor HRR. This is also <strong>in</strong> l<strong>in</strong>e with <strong>the</strong> results <strong>of</strong> real tunnel fires where fires <strong>in</strong>volv<strong>in</strong>gHGVs <strong>of</strong>ten lead to dramatic consequences, ei<strong>the</strong>r for occupants, <strong>the</strong> tunnelstructure, or both. The importance <strong>of</strong> <strong>the</strong> HGVs for <strong>the</strong> consequences <strong>of</strong> a tunnel fireis illustrated <strong>in</strong> Table 2.1.The total calorific content <strong>in</strong> each test <strong>in</strong> <strong>the</strong> Runehamar test series is given <strong>in</strong> Table3.2. The total developed energy for each commodity, calculated through <strong>in</strong>tegration<strong>of</strong> <strong>the</strong> HRR curve, was 243 MW, 141 MW, 131 MW, and 56.7 MW. These valuescorrespond to combustion efficiencies <strong>of</strong> 0.98, 1.04, 0.73, and 0.91 for T1, T2, T3,and T4, respectively. The value above one can probably be expla<strong>in</strong>ed by uncerta<strong>in</strong>ties<strong>in</strong> <strong>the</strong> estimation <strong>of</strong> <strong>the</strong> calorific content and uncerta<strong>in</strong>ties <strong>in</strong> <strong>the</strong> method <strong>of</strong>estimat<strong>in</strong>g <strong>the</strong> HRR. This is fur<strong>the</strong>r discussed <strong>in</strong> Paper II. Three <strong>of</strong> <strong>the</strong> values <strong>of</strong>combustion efficiency are relatively close to one, while <strong>the</strong> value for T3 is lower.This can be expla<strong>in</strong>ed by <strong>the</strong> more compact set-up <strong>of</strong> <strong>the</strong> fuel <strong>in</strong> T3 than <strong>in</strong> <strong>the</strong> o<strong>the</strong>rtests; both <strong>the</strong> cab<strong>in</strong>et doors and <strong>the</strong> wooden toy houses were packed <strong>in</strong> a verycompact way and <strong>the</strong>se commodities constituted more than 50 % <strong>of</strong> <strong>the</strong> total weight<strong>of</strong> <strong>the</strong> commodities used <strong>in</strong> test T3.21
<strong>On</strong> <strong>the</strong> <strong>Characteristics</strong> <strong>of</strong> <strong>Fires</strong> <strong>in</strong> <strong>Tunnels</strong>Heat Release Rate [MW]25020015010050EUREKA 499 - HGVEUREKA 499 - simulated truck loadBenelux - 36 wood pallets - 0 m/s - (T8)Benelux - 36 wood pallets - 4-6 m/s - (T9)Benelux - 36 wood pallets - 6 m/s - (T10)Benelux - 72 wood pallets - 1-2 m/s - (T14)Runehamar - wood and plastic pallets (T1)Runehamar - Wood pallets - mattrasses (T2)Runehamar - furnitures and fixtures (T3)Runehamar - cartons and PS cups (T4)00 10 20 30 40 50Time [m<strong>in</strong>]Figure 3.2 The time resolved HRR for <strong>the</strong> HGV trailer simulation tests from threedifferent test series.The furniture tests <strong>in</strong> Runehamar reached a similar maximum HRR as was <strong>the</strong> case<strong>in</strong> <strong>the</strong> EUREKA furniture test. However, accord<strong>in</strong>g to <strong>the</strong> correlation <strong>in</strong> Figure 3.1,<strong>the</strong> HRR <strong>in</strong> <strong>the</strong> Runehamar should be higher than <strong>the</strong> EUREKA test due to <strong>the</strong>higher energy content. A probable reason for this not be<strong>in</strong>g <strong>the</strong> case is that <strong>in</strong> <strong>the</strong>Runehamar test much <strong>of</strong> <strong>the</strong> cellulose was very densely packed (e.g. <strong>the</strong> cardboarddoors) as noted above.Ano<strong>the</strong>r feature shown <strong>in</strong> Figure 3.2 is that for <strong>the</strong> large tests <strong>the</strong>re exists an <strong>in</strong>itialdelay with a slow <strong>in</strong>crease <strong>in</strong> <strong>the</strong> HRR before <strong>the</strong> HRR <strong>in</strong>creases rapidly. This <strong>in</strong>itialdelay depends on <strong>the</strong> ignition source, position <strong>of</strong> ignition, type <strong>of</strong> fuel, geometry <strong>of</strong>fuel etc. When <strong>the</strong> HRR <strong>in</strong>creases, <strong>the</strong> risk for fire spread and <strong>the</strong> hazard to peoplealso <strong>in</strong>creases. Therefore, slow <strong>in</strong>itial fire development, early detection, and fastreaction to <strong>the</strong> evolv<strong>in</strong>g situation, are very important for successful escape from aHGV fire <strong>in</strong> a tunnel. The <strong>in</strong>crease <strong>in</strong> HRR is almost l<strong>in</strong>ear and was estimated to be20.5 MW/m<strong>in</strong>, 29 MW/m<strong>in</strong>, 17 MW/m<strong>in</strong>, and 17.7 MW/m<strong>in</strong> for test T1, T2, T3, andT4, respectively [76]. The values were calculated <strong>in</strong> <strong>the</strong> HRR range from 5 MW to100 MW, except for T4 where it was calculated to its maximum HRR. Similar rates<strong>of</strong> <strong>in</strong>crease <strong>in</strong> HRR for <strong>the</strong> tests <strong>in</strong> <strong>the</strong> 2 nd Benelux tunnel (Test 8, 9, 10, and 14)ranged from 2.6 MW/m<strong>in</strong> to 14.4 MW/m<strong>in</strong>.Ingason and Lönnermark summarized values <strong>of</strong> calorific potential and peak HRRfrom tests performed with rail vehicles <strong>in</strong> <strong>the</strong> Repparfjord tunnel [68]. These values22
3 Fire experiments <strong>in</strong> tunnelsare given <strong>in</strong> Table 3.4 toge<strong>the</strong>r with values presented by Barber et al. [77]. For <strong>the</strong>rail vehicles, <strong>the</strong> scatter <strong>in</strong> data on maximum HRR as a function <strong>of</strong> <strong>the</strong> energy contentis large. Especially for <strong>the</strong> German Intercity-Express railway cars, <strong>the</strong>correlation coefficient is low. A reason for <strong>the</strong> differences can be <strong>the</strong> importance <strong>of</strong><strong>the</strong> ventilation conditions <strong>in</strong>side <strong>the</strong> vehicles for <strong>the</strong> HRR developed, i.e. <strong>the</strong> numberand sizes <strong>of</strong> open<strong>in</strong>gs has a major effect on <strong>the</strong> ventilation and combustion situation<strong>in</strong>side <strong>the</strong> vehicle. S<strong>in</strong>ce this can vary significantly between different types <strong>of</strong> vehicles(e.g. type and mount<strong>in</strong>g <strong>of</strong> w<strong>in</strong>dows) and different <strong>in</strong>cidents, large variations <strong>in</strong>HRR are to be expected.Table 3.4 Large-scale experimental heat release data from rail vehicles [68]Type <strong>of</strong> vehicle, test seriesA Jo<strong>in</strong>ed Railway car; two half cars, one<strong>of</strong> alum<strong>in</strong>ium and one <strong>of</strong> steel, EUREKA499German Intercity-Express railway car(ICE), EUREKA 499German Intercity passenger railway carCalorific value[GJ]et al [78]a) The test report is confidential and no <strong>in</strong>formation is available on test set-up, test procedure, measurementtechniques, ventilation, etc.In Paper I (Table 5), a summary is given <strong>of</strong> peak gas temperatures near <strong>the</strong> ceil<strong>in</strong>gdur<strong>in</strong>g different fire tests <strong>in</strong> road tunnels. The temperatures range from 250 °C to1360 °C for pool fires, from 110 °C to 480 °C for car fires, and from 290 °C to1365 °C for simulated HGV fires. The temperature is a function <strong>of</strong> <strong>the</strong> HRR, but <strong>the</strong>results are also dependent on <strong>the</strong> type <strong>of</strong> ventilation, air speed, geometry <strong>of</strong> <strong>the</strong> tunnel,fuel set-up and elevation, type <strong>of</strong> fuel etc. There are significant differences bothwith<strong>in</strong> and between <strong>the</strong> different test series and direct comparisons and correlationscan be difficult. Therefore, a separate test series is planned where <strong>the</strong>se relationshipscan be studied.A similar summary was presented by Ingason and Lönnermark for rail vehicles [68].The peak gas temperatures range from 680 °C to 1050 °C. The end values <strong>of</strong> <strong>the</strong>span correspond to a German subway steel car and a German subway alum<strong>in</strong>ium car,respectively. The air velocity was somewhat higher <strong>in</strong> <strong>the</strong> latter case (0.5 m/s comparedto 0.3 m/s). The results, however, show <strong>the</strong> importance <strong>of</strong> <strong>the</strong> material <strong>in</strong> <strong>the</strong>vehicle and whe<strong>the</strong>r <strong>the</strong> fire is able to burn through <strong>the</strong> material.As shown <strong>in</strong> Paper I, <strong>the</strong> best correlation between <strong>the</strong> nom<strong>in</strong>al fire curves and <strong>the</strong>temperatures measured <strong>in</strong> <strong>the</strong> Runehamar tests was found to be a comb<strong>in</strong>ation <strong>of</strong> <strong>the</strong>HC curve and <strong>the</strong> RWS curve (see Figure 3.3). This correlation is described by23Peak HRR[MW]HRR/Energy[MW/GJ]ReferenceRail55 43 0.78 Ste<strong>in</strong>ert [71]63 19 0.30 Ste<strong>in</strong>ert [71]77 13 0.17 Ingasonet al [78](IC), EUREKA 499British Rail 415, passenger railway car a) NA 16 NA Barberet al. [77]British rail Spr<strong>in</strong>ter, passenger railwaycar, fire retardant upholstered seat<strong>in</strong>gs a) NA 7 NA Barberet al. [77]MetroGerman subway car, EUREKA 499 41 35 0.85 Ingason
<strong>On</strong> <strong>the</strong> <strong>Characteristics</strong> <strong>of</strong> <strong>Fires</strong> <strong>in</strong> <strong>Tunnels</strong>Ni− t n k t( ) k ii −1− i1−e eT = 20 + ∑ ni⋅ ri⋅(3.3)with i=2, n 1 =1.2, r 1 =1920 °C , k 1 = 0.00385 m<strong>in</strong> -1 , n 2 =30, r 2 =300 °C, and k 2 =0.62 m<strong>in</strong> -1 . The temperature is given <strong>in</strong> degrees Celcius and <strong>the</strong> time <strong>in</strong> m<strong>in</strong>utes.More details regard<strong>in</strong>g <strong>the</strong> correlation and <strong>the</strong> temperature-time curves can be found<strong>in</strong> Paper I.14001200Temperature [ o C]1000800600400200T Standard (ISO 834)T HydrocarbonTRWST RABT/ZTVT The Runehamar curve00 10 20 30 40 50 60Time [m<strong>in</strong>]Figure 3.3 The temperature curve correspond<strong>in</strong>g to a best fit <strong>of</strong> <strong>the</strong> Runehamar datadescribed by Equation (3.3) is compared with four different fire temperaturecurves <strong>of</strong>ten used for test<strong>in</strong>g structures.In <strong>the</strong> discussion <strong>of</strong> different fire curves it can be <strong>of</strong> <strong>in</strong>terest to dicuss how <strong>the</strong>securves relate to each o<strong>the</strong>r. Wickström suggested that <strong>the</strong> expression for <strong>the</strong> standardfire curve:( 8t1)ΔT = 345 log10 +(3.4)can be exchange by an expression used <strong>in</strong> <strong>the</strong> former Swedish build<strong>in</strong>g code [79]:Δ T= T⎡⎢ −⎣max13∑i=1Ae− Γαiit ⎤⎥⎦(3.5)where <strong>the</strong> constants α i have been converted to correspond to a time, t, <strong>in</strong> m<strong>in</strong>utes andΓ is <strong>the</strong> dimensionless compartment time factor. There were ma<strong>in</strong>ly two reasons for24
3 Fire experiments <strong>in</strong> tunnelsthis suggestion. The expression <strong>in</strong> Eq. (3.5) is more suitable for calculation purposesand it does not <strong>in</strong>crease <strong>in</strong>f<strong>in</strong>itely as Eq. (3.4) does. The values <strong>of</strong> <strong>the</strong> constants <strong>in</strong>Eq. (3.5) are presented <strong>in</strong> Table 3.5 and Table 3.6. This curve is called <strong>the</strong> generalnatural fire curve. Dur<strong>in</strong>g <strong>the</strong> work with <strong>the</strong> revision <strong>of</strong> <strong>the</strong> standard ISO 834,Eq. (3.5) was <strong>in</strong>cluded <strong>in</strong> <strong>the</strong> discussions [80].This expression was also <strong>the</strong> start<strong>in</strong>g po<strong>in</strong>t for <strong>the</strong> development <strong>of</strong> <strong>the</strong> HC curve and<strong>the</strong> values <strong>of</strong> <strong>the</strong> constants for this curve is also <strong>in</strong>cluded <strong>in</strong> Table 3.6 [81]. Theexpression for <strong>the</strong> HC curve was later changed los<strong>in</strong>g <strong>the</strong> direct connection between<strong>the</strong> two curves. It is presented <strong>in</strong> several standards (e.g. EN 1363-2:1999):−0.167t−2.5t[ − 0.325e− 0.675e]Δ T = 10801(3.6)Table 3.5 Values <strong>of</strong> <strong>the</strong> constants <strong>in</strong> <strong>the</strong> summation <strong>in</strong> Eq. (3.5).i 1 2 3A i [-] 0.324 0.204 0.472α i [1/m<strong>in</strong>] 0.0033 0.028 0.32Table 3.6 Values <strong>of</strong> T max and Γ used <strong>in</strong> Eq. (3.5) to describe different fire curves.Curve T max [ºC] Γ [-]ISO 834 1325 1HC 1080 50Runehamar 1330 35In Figure 3.4 different fire curves are presented. The ISO curve based on alogarithmic expression (Eq. (3.4)) is compared to <strong>the</strong> expression suggested byWickström (Eq. (3.5)). In addition <strong>the</strong> HC curve and a suggested curve based on <strong>the</strong>Runehamar results (and a comb<strong>in</strong>ation <strong>of</strong> <strong>the</strong> HC curve and <strong>the</strong> RWS curve) are presented.The curves are based on <strong>the</strong> same summation constants given <strong>in</strong> Table 3.5.The differences between <strong>the</strong> curves are <strong>the</strong> T max and <strong>the</strong> value <strong>of</strong> Γ. In <strong>the</strong> case <strong>of</strong> <strong>the</strong>curve represent<strong>in</strong>g <strong>the</strong> results from <strong>the</strong> Runehamar tests, <strong>the</strong> value <strong>of</strong> T max is basedon a maximum absolute temperature <strong>of</strong> 1350 ºC and an assumed ambient temperature<strong>of</strong> 20 ºC. Note that <strong>the</strong> curve is approach<strong>in</strong>g a constant value. Therefore, only<strong>the</strong> first 60 m<strong>in</strong>utes are <strong>in</strong>cluded. After this time, <strong>the</strong> RWS curve and <strong>the</strong> correlationbased on this decrease. This can be seen <strong>in</strong> Figure 3.5, where two different correlations(Eq. (3.3) and Eq. (3.5) with Γ=35 and T max = 1330 ºC) are compared to temperaturemeasurements from test T1 <strong>in</strong> <strong>the</strong> Runehamar tunnel and to a comb<strong>in</strong>ation<strong>of</strong> <strong>the</strong> HC curve and <strong>the</strong> RWS curve. Both correlations well represent <strong>the</strong> experimentsand both are somewhat higher than <strong>the</strong> RWS curve between 20 m<strong>in</strong> and 60m<strong>in</strong>. After <strong>the</strong> time 60 m<strong>in</strong> <strong>the</strong> correlations differe where <strong>the</strong> Eq. (3.3) follows <strong>the</strong>RWS curve while Eq (3.5) is approach<strong>in</strong>g its constant value. The advantage <strong>of</strong>Eq. (3.3) is <strong>the</strong> fact that it first follows <strong>the</strong> HC curve and <strong>the</strong>n <strong>the</strong> RWS curve and <strong>the</strong>transition between <strong>the</strong>m is supported by <strong>the</strong> experiment. The advantage <strong>of</strong> Eq. (3.5)is <strong>the</strong> simplicity <strong>of</strong> <strong>the</strong> expression and that <strong>the</strong> ISO curve, <strong>the</strong> HC curve and <strong>the</strong>Runehamar experiments can be represented with <strong>the</strong> same expression, only chang<strong>in</strong>g<strong>the</strong> value <strong>of</strong> two parameters, T max and Γ.25
<strong>On</strong> <strong>the</strong> <strong>Characteristics</strong> <strong>of</strong> <strong>Fires</strong> <strong>in</strong> <strong>Tunnels</strong>160014001200ΔT, HCΔT, ISO (Eq. (3.4))ΔT, ISO (Eq. (3.5))ΔT, Runeh. (Eq. (3.5))ΔT, Runeh. exp. T1ΔT [ o C]100080060040020000 10 20 30 40 50 60Time [m<strong>in</strong>]Figure 3.4 Comparison <strong>of</strong> different fire curves based on Eq (3.4) and Eq (3.5)with results from <strong>the</strong> results from <strong>the</strong> Runehamar tunnel.Us<strong>in</strong>g <strong>the</strong> f<strong>in</strong>ite element computer code TASEF, Wickström derived relationships for<strong>the</strong> ratio between <strong>the</strong> temperature rise <strong>of</strong> <strong>the</strong> surface (ΔT w ) and <strong>the</strong> fire (ΔT f ), and <strong>of</strong>an <strong>in</strong>terior po<strong>in</strong>t (ΔT x ) and <strong>the</strong> surface, respectively [82]:ΔTx= η η ΔT(3.7)xwfwhereΔTw−0.88ηw= = 1−0.0616( t 60) (3.8)ΔTfis <strong>the</strong> ratio between <strong>the</strong> temperature rise <strong>of</strong> <strong>the</strong> surface and <strong>the</strong> fire andΔTx⎛ t ⎞ηx= = 0.10ln⎜− 0.812⎟(3.9)ΔT⎝ 60x⎠wis <strong>the</strong> ratio between <strong>the</strong> temperature rise <strong>of</strong> an <strong>in</strong>terior po<strong>in</strong>t and <strong>the</strong> surface. Thetime, t, is given <strong>in</strong> m<strong>in</strong>utes and x is <strong>the</strong> distance below <strong>the</strong> surface <strong>of</strong> <strong>the</strong> <strong>in</strong>teriorpo<strong>in</strong>t.26
3 Fire experiments <strong>in</strong> tunnels160014001200HC+RWSRuneh. (Eq. (3.5))Runeh. case 2 (Eq. (3.3))Runeh. exp. T1ΔT [ o C]100080060040020000 20 40 60 80 100 120Time [m<strong>in</strong>]Figure 3.5 Comparison <strong>of</strong> two different correlations (Eq. (3.3) and Eq. (3.5),respectively) to a comb<strong>in</strong>ation <strong>of</strong> <strong>the</strong> HC curve and <strong>the</strong> RWS curve,and <strong>the</strong> experimental results from test T1.In Figure 3.6, Eq. (3.7) has been used to calculate <strong>the</strong> temperature at <strong>the</strong> depth0.04 m <strong>in</strong>side normal-weight concrete exposed to three different fire temperaturesaccord<strong>in</strong>g expression Eq. (3.5) and <strong>the</strong> values presented <strong>in</strong> Table 3.6. The shortesttimes are not <strong>in</strong>cluded s<strong>in</strong>ce <strong>the</strong> correlations for η w and η x , respectively, are not validfor <strong>the</strong>se short times. The graphs show <strong>the</strong> differences <strong>in</strong> temperature rise due to <strong>the</strong>variation <strong>in</strong> fire temperature. There is a significant difference <strong>in</strong> time passed until acerta<strong>in</strong> temperature level is reached depend<strong>in</strong>g on which fire temperature curve isused. The effect on <strong>the</strong> structure due to <strong>the</strong> <strong>in</strong>crease <strong>in</strong> temperature and what <strong>the</strong>difference <strong>in</strong> fire temperature and wall material means for <strong>the</strong> structure are notwith<strong>in</strong> <strong>the</strong> scope <strong>of</strong> this <strong>the</strong>sis even if <strong>the</strong> phenomenon spall<strong>in</strong>g is briefly discussed<strong>in</strong> Section 7.1.<strong>On</strong>e important effect <strong>of</strong> <strong>the</strong> ventilation is that it can <strong>in</strong>crease <strong>the</strong> rate <strong>of</strong> <strong>in</strong>crease <strong>in</strong>HRR [68, 83]. This can have dramatic consequences on <strong>the</strong> outcome <strong>of</strong> a given <strong>in</strong>cident<strong>in</strong>side a tunnel. In a research project f<strong>in</strong>anced by <strong>the</strong> Swedish Rescue ServiceAgency it was concluded that <strong>the</strong> ventilation could have at least two major effects on<strong>the</strong> conditions dur<strong>in</strong>g a fire <strong>in</strong> a tunnel, i.e. through <strong>in</strong>creas<strong>in</strong>g <strong>the</strong> rate <strong>of</strong> <strong>in</strong>crease <strong>of</strong>HRR and dilut<strong>in</strong>g <strong>the</strong> gases <strong>in</strong>side <strong>the</strong> tunnel [84]. <strong>On</strong>e part <strong>of</strong> <strong>the</strong> project was tomodel <strong>the</strong> evacuation <strong>of</strong> tunnel occupants. The total effect depends on <strong>the</strong> evacuationsituation <strong>in</strong> <strong>the</strong> tunnel, but <strong>the</strong>se effects are important to keep <strong>in</strong> m<strong>in</strong>d. The first fewm<strong>in</strong>utes after ignition <strong>of</strong> a fire can be crucial to <strong>the</strong> outcome and <strong>the</strong>refore, <strong>the</strong> effect<strong>of</strong> <strong>the</strong> ventilation on <strong>the</strong> rate <strong>of</strong> <strong>in</strong>crease <strong>of</strong> <strong>the</strong> HRR must be considered whendesign<strong>in</strong>g ventilation etc. for tunnels, not only <strong>the</strong> maximum HRR. The effect <strong>of</strong> <strong>the</strong>ventilation is fur<strong>the</strong>r discussed <strong>in</strong> Section 5.2.27
<strong>On</strong> <strong>the</strong> <strong>Characteristics</strong> <strong>of</strong> <strong>Fires</strong> <strong>in</strong> <strong>Tunnels</strong>The siz<strong>in</strong>g <strong>of</strong> tunnel ventilation is outside <strong>of</strong> <strong>the</strong> scope <strong>of</strong> this <strong>the</strong>sis, but with<strong>in</strong> <strong>the</strong>discussion on <strong>the</strong> temperature <strong>in</strong>side a tunnel dur<strong>in</strong>g a fire it can be <strong>of</strong> <strong>in</strong>terest tonote that Carlotti and Voeltzel showed that <strong>the</strong> correct estimation <strong>of</strong> <strong>the</strong> heat<strong>in</strong>g <strong>of</strong><strong>the</strong> walls <strong>of</strong> <strong>the</strong> tunnel dur<strong>in</strong>g a fire can be crucial to <strong>the</strong> performance <strong>of</strong> <strong>the</strong>ventilation system [85]. The effect <strong>of</strong> <strong>the</strong> heat<strong>in</strong>g <strong>of</strong> <strong>the</strong> walls on <strong>the</strong> velocity <strong>in</strong> atunnel was also seen dur<strong>in</strong>g <strong>the</strong> Runehamar tunnel [86].500400T max=1330 o C; Γ=35 (Runehamar)T max=1080 o C; Γ=50 (HC)Tmax=1325 o C; Γ=1 (ISO)ΔT [ o C]30020010000 10 20 30 40 50 60Time [m<strong>in</strong>]Figure 3.6 Temperature rise at a depth <strong>of</strong> 0.04 cm <strong>in</strong> normal-weight concrete exposedto three different fire temperature curves described by Eq. (3.5).28
4 Flame length and fire spread <strong>in</strong> a tunnel4 Flame length and fire spread <strong>in</strong> a tunnelRew and Deaves identified five different types <strong>of</strong> mechanism for fire spread betweenwagons <strong>in</strong> a rail tunnel [87]:1. Flame imp<strong>in</strong>gement2. Flame spread (i.e. flame spread across a surface)3. Remote ignition/’flashover’. Here <strong>the</strong>y discussed spread from one wagon toano<strong>the</strong>r due to flashover. (In <strong>the</strong> rest <strong>of</strong> this section, remote ignition meansignition by radiation.)4. Fuel transfer. This <strong>in</strong>cludes both spread by burn<strong>in</strong>g liquid and by burn<strong>in</strong>gdebris (‘fire brands’) transported downstream <strong>of</strong> <strong>the</strong> fire.5. Explosion.The extended flame along <strong>the</strong> ceil<strong>in</strong>g <strong>in</strong> a tunnel is an important factor to considerwhen study<strong>in</strong>g fire spread <strong>in</strong> a tunnel. It will <strong>in</strong>fluence both mechanism 1 andmechanism 3, above. It can also <strong>in</strong>crease <strong>the</strong> flame spread along a surface (mechanism2). Therefore, this section starts with a description <strong>of</strong> how to estimate <strong>the</strong> flamelength dur<strong>in</strong>g a tunnel fire.For unconf<strong>in</strong>ed fires <strong>the</strong>re exist a number <strong>of</strong> relationships for <strong>the</strong> flame height anddifferent properties <strong>of</strong> <strong>the</strong> plume [88-90]. <strong>On</strong>e <strong>of</strong> <strong>the</strong> most common relationships for<strong>the</strong> flame height is <strong>the</strong> one suggested by Heskestad [91]:1 5= −1.0215.6N(4.1)h fD +⎡2cpT0⎤ Q&where N = ⎢23 ⎥ , c5 p is <strong>the</strong> specific heat capacity <strong>of</strong> air, T 0 and ρ 0 are⎣ gρ0( Δhr) Dc⎦<strong>the</strong> ambient temperature and density, respectively, g is <strong>the</strong> acceleration <strong>of</strong> gravity,Δh c is <strong>the</strong> heat <strong>of</strong> combustion per unit mass, r is <strong>the</strong> stoichiometric mass ratio <strong>of</strong> airto volatiles, Q & is <strong>the</strong> total HRR, and D is <strong>the</strong> diameter <strong>of</strong> <strong>the</strong> fire source.This is <strong>of</strong>ten written ash f&2 5= −1.02D+ 0.235Q(4.2)where values for air and typical vales for liquid fuels have been used [90].There are two problems with this equation when applied to fires <strong>in</strong> tunnels. Firstly, itwas developed for free burn<strong>in</strong>g fires, without <strong>the</strong> <strong>in</strong>terference <strong>of</strong> a ceil<strong>in</strong>g. Correlationsthat take <strong>the</strong> <strong>in</strong>fluence <strong>of</strong> <strong>the</strong> ceil<strong>in</strong>g <strong>in</strong>to account are discussed below.Secondly, <strong>the</strong> types <strong>of</strong> fires described by Eq. (4.1) do not <strong>in</strong>clude deep-seated fires(e.g. wood cribs, pallets, etc.) [92]. However, Heskestad showed that deep-seatedfires are reasonably well represented if <strong>the</strong> flame height is calculated from <strong>the</strong> base<strong>of</strong> <strong>the</strong> combustion region and if <strong>the</strong> diameter used <strong>in</strong> <strong>the</strong> formula is def<strong>in</strong>ed as [47]:29
<strong>On</strong> <strong>the</strong> <strong>Characteristics</strong> <strong>of</strong> <strong>Fires</strong> <strong>in</strong> <strong>Tunnels</strong>1 2⎛ 4Q&⎞D = ⎜ ⎟where Q & ′is <strong>the</strong> maximum heat release rate <strong>of</strong> <strong>the</strong> fire divided by <strong>the</strong>⎝πQ& ′′ ⎠plan area <strong>of</strong> <strong>the</strong> fire (not <strong>the</strong> total exposed area <strong>of</strong> fuel).Zukoski suggested a relationship based on <strong>the</strong> non-dimensional heat release rate,*Q & , [93]:h fD(&*) 2 5= 3.3Q(4.3)for 1
4 Flame length and fire spread <strong>in</strong> a tunnelthis <strong>the</strong>sis. Babrauskas also discussed plumes from a fire <strong>in</strong> a corridor and hiscalculations for a chosen example showed <strong>the</strong> ratio L f /(h f - H f ) to be approximately 2(1.81), but <strong>the</strong> value was very dependent on <strong>the</strong> width <strong>of</strong> <strong>the</strong> corridor and if <strong>the</strong>width was decreased from 3 m to 2 m, <strong>the</strong> value <strong>in</strong>creased to 2.94. Aga<strong>in</strong> <strong>the</strong>relationship between <strong>the</strong> free burn<strong>in</strong>g flame height and <strong>the</strong> height <strong>of</strong> <strong>the</strong> ceil<strong>in</strong>g wasrelatively small. The flame length, L f , is <strong>in</strong> this <strong>the</strong>sis def<strong>in</strong>ed as <strong>the</strong> distance from<strong>the</strong> cross-section <strong>in</strong> <strong>the</strong> centre <strong>of</strong> <strong>the</strong> fire (i.e. correspond<strong>in</strong>g to h r <strong>in</strong> <strong>the</strong> work byBabrauskas and L r <strong>in</strong> <strong>the</strong> work by Heskestad and Hamada), see Figure 4.1.L fuH tH fh fFigure 4.1 Def<strong>in</strong>ition <strong>of</strong> parameters used <strong>in</strong> <strong>the</strong> flame length correlations.A similar <strong>in</strong>vestigation with a propane burner, by Heskestad and Hamada, found thatL f /(h f - H f ) varied between 0.88 and 1.05 with an average <strong>of</strong> 0.95 [95].Alpert derived a correlation for maximum ceil<strong>in</strong>g jet temperatures based on fireexperiments where <strong>the</strong> fire sizes ranged from 668 kW to 98 MW [96, 97]. The testswere performed beneath a ceil<strong>in</strong>g where <strong>the</strong> ceil<strong>in</strong>g height varied between 4.6 m and15.5 m. Alpert’s correlation is a function <strong>of</strong> heat release rate, Q & , radial position, r,and height <strong>of</strong> ceil<strong>in</strong>g above <strong>the</strong> fuel, H f :Tmax( Q r)2 35 .38 &− T =(4.6)0H fIt is worth not<strong>in</strong>g that different temperatures at <strong>the</strong> flame tip have been assumed bydifferent authors. Sugawa et al. used a flame tip temperature <strong>of</strong> 250 ºC (def<strong>in</strong>ed by<strong>the</strong> highest position <strong>of</strong> <strong>the</strong> temperature contour l<strong>in</strong>e) [98]. Oka used <strong>the</strong> temperature<strong>of</strong> 350 ºC, def<strong>in</strong><strong>in</strong>g <strong>the</strong> boundary between <strong>in</strong>termittent and plume region [99].Heskestad suggested an excess temperature <strong>of</strong> 500 ºC above ambient at <strong>the</strong> meanflame height <strong>of</strong> purely buoyant diffusion flames [90]. Heselden used <strong>the</strong> value <strong>of</strong>580 ºC, correspond<strong>in</strong>g to a critical distance for ignition <strong>in</strong> a tunnel [14]. A similarvalue (600 ºC) was used by Rew and Deaves [87], based on <strong>the</strong> work by Heselden.In Paper VII it was shown that a flame length based on <strong>the</strong> value 600 °Capproximately corresponds to <strong>the</strong> distance <strong>of</strong> fire spread. The value 600 ºC will alsobe used below.31
<strong>On</strong> <strong>the</strong> <strong>Characteristics</strong> <strong>of</strong> <strong>Fires</strong> <strong>in</strong> <strong>Tunnels</strong>A relationship such as <strong>the</strong> one <strong>in</strong> Eq. (4.6) can be used to estimate <strong>the</strong> flame length ifa certa<strong>in</strong> temperature is assumed at <strong>the</strong> flame tip (see Paper VII). This will bediscussed fur<strong>the</strong>r below, but let us beg<strong>in</strong> with a case more closely associated with atunnel, i.e. a beamed ceil<strong>in</strong>g. If <strong>the</strong> beams are deep enough to channel <strong>the</strong> ceil<strong>in</strong>g jet,<strong>the</strong> flow <strong>of</strong> <strong>the</strong> hot gases appears to be similar to that found <strong>in</strong> a tunnel, with <strong>the</strong>significant difference <strong>of</strong> forced ventilation <strong>of</strong>ten used <strong>in</strong> tunnels. Delichatsios analysed<strong>the</strong> flow beneath a beamed ceil<strong>in</strong>g, both <strong>the</strong>oretically and experimentally andderived <strong>the</strong> follow<strong>in</strong>g expression for <strong>the</strong> temperature rise, ΔT, for <strong>the</strong> case whenh b /H = 1/5 and x > L b [100]:ΔTΔT01 3[ ]1 3( H / L ) exp − 0.20( x H )( L )= 0.29Hbb(4.7)where ΔT 0 is <strong>the</strong> temperature rise near <strong>the</strong> ceil<strong>in</strong>g above <strong>the</strong> fire, H is <strong>the</strong> height <strong>of</strong><strong>the</strong> ceil<strong>in</strong>g above <strong>the</strong> fire source, h b is <strong>the</strong> beam depth, L b is half <strong>the</strong> width between<strong>the</strong> beams, and x is <strong>the</strong> horizontal distance from <strong>the</strong> centre <strong>of</strong> <strong>the</strong> fire. Delichatsiosshowed <strong>in</strong> his analysis that <strong>the</strong> ma<strong>in</strong> process for <strong>the</strong> decrease <strong>in</strong> temperature along<strong>the</strong> ceil<strong>in</strong>g is <strong>the</strong> heat transfer to <strong>the</strong> ceil<strong>in</strong>g. The cool<strong>in</strong>g due to entra<strong>in</strong>ment is notimportant to <strong>the</strong> same extent. If Eq (4.7) is used to estimate <strong>the</strong> flame length it can berewritten as:1 3⎡ ⎛ ⎞ ⎤1 3 ⎢ΔT⎜W⎟ ⎥⎛ 2H⎞⎢ ⎝ 2Hffx = −5H⎠ ⎥⎜⎟fln(4.8)⎝ W ⎠⎢ 0.29ΔT⎥0⎢⎥⎣⎦where W is <strong>the</strong> width <strong>of</strong> <strong>the</strong> tunnel (= 2L b ). It was <strong>in</strong>vestigated whe<strong>the</strong>r this equationcould be used to estimate <strong>the</strong> flame length by putt<strong>in</strong>g x=L f , ΔT = 590 (600-10) andΔT 0 = 1290 (1300-10). The problem is, however, that <strong>the</strong> whole expression becomesnegative if <strong>the</strong> logarithmic expression is greater than zero. This means that certa<strong>in</strong>restrictions must be assigned to <strong>the</strong> logarithmic expression for <strong>the</strong> whole expressionto give sensible (although not necessarily correct) results:1 30.29ΔT⎛ ⎞0⎜W> ⎟(4.9)ΔT2⎝ H f ⎠Us<strong>in</strong>g this expression for <strong>the</strong> values <strong>of</strong> <strong>the</strong> temperatures given above results <strong>in</strong> <strong>the</strong>condition that W < 0.51 H f . Even if <strong>the</strong> value <strong>of</strong> H f can be discussed, nei<strong>the</strong>r <strong>of</strong> <strong>the</strong>possible values gives a width <strong>of</strong> <strong>the</strong> tunnel near <strong>the</strong> one <strong>in</strong> <strong>the</strong> Runehamar tests. It is,<strong>the</strong>refore, obvious that <strong>the</strong> equation (4.8) was developed for a different situation thanthat <strong>in</strong> <strong>the</strong> large-scale tunnel tests <strong>in</strong> <strong>the</strong> Runehamar tunnel.<strong>On</strong>e o<strong>the</strong>r difficulty <strong>in</strong> us<strong>in</strong>g Eq. (4.8) for a tunnel, especially with forcedventilation, can be to accurately def<strong>in</strong>e ΔT 0 , both <strong>in</strong> magnitude and position.Preferably, this should be related to <strong>the</strong> heat release rate to be comparable to <strong>the</strong>32
4 Flame length and fire spread <strong>in</strong> a tunnelo<strong>the</strong>r methods. <strong>On</strong>e such model is suggested by Motevalli, who described <strong>the</strong>maximum temperature rise as a function <strong>of</strong> <strong>the</strong> non-dimensional HRR (based on <strong>the</strong>convective HRR and <strong>the</strong> height) [101, 102]. Us<strong>in</strong>g this correlation, however,overestimates <strong>the</strong> temperatures significantly compared to <strong>the</strong> temperatures reacheddur<strong>in</strong>g <strong>the</strong> Runehamar tests (see Papers I and VII). The reason can be <strong>the</strong> very smallfire sources (0.75 kW and 2 kW) compared to <strong>the</strong> heights (1 m) used when deriv<strong>in</strong>g*<strong>the</strong> correlation. There is obviously a large difference <strong>in</strong> Q & between <strong>the</strong> two cases.Newman and Tewarson developed a model for <strong>the</strong> average temperature <strong>in</strong> ducts[103]. They provided a model for <strong>the</strong> convective heat flow downstream <strong>of</strong> a fire.From this, <strong>the</strong> average temperature can be calculated. Heat losses are calculated forconvection and radiation, respectively, us<strong>in</strong>g:l,cxw( T − T )Q & = h A(4.10)avgw44( ε T − ε T )Q & = F A σ(4.11)l, r ws w g avg w wwherehx0.7⎪⎧⎡ D ⎤ ⎪⎫= 0.026 Re ⎨ ⎢ ⎬ u⎪⎩x⎥⎣ ⎦ ⎪ ⎭−0.2Ht[ ] 1+ρ0c00(4.12)is <strong>the</strong> average convective heat transfer coefficient to <strong>the</strong> walls over a distance x,based on work by McAdams [104]. The area, A w, is <strong>the</strong> total tunnel surface area(here named ‘walls’ even if this also <strong>in</strong>cludes <strong>the</strong> ceil<strong>in</strong>g and road surface) from <strong>the</strong>fire to <strong>the</strong> distance x, Fwsis <strong>the</strong> view factor between <strong>the</strong> walls and <strong>the</strong> fire source, σis <strong>the</strong> Stefan-Boltzmann constant, and ε g and ε w are <strong>the</strong> emissivity <strong>of</strong> <strong>the</strong> gas andwalls, respectively. The Reynolds number, Re, is based on <strong>the</strong> hydraulic diameter <strong>of</strong><strong>the</strong> tunnel, D Ht . If <strong>the</strong> same assumptions are used as Newman and Tewarson, i.e. T w= T 0 , Fws= 1, and ε g = ε w = 1, <strong>the</strong> follow<strong>in</strong>g equation can be derived:Tavg0p,00t 04[ Q − A ( T − T )]41= T0+&tot wσavg 0(4.13)ρ c u A + h AxwA modification <strong>of</strong> this equation was used <strong>in</strong> Paper VII (with two different crosssectionalareas and wall temperatures) to calculate <strong>the</strong> variation <strong>in</strong> cross-sectionaltemperature along <strong>the</strong> tunnel. This showed that with an assumed temperature <strong>of</strong>500 ºC, <strong>the</strong> equation estimated <strong>the</strong> distance <strong>of</strong> fire spread from <strong>the</strong> seat <strong>of</strong> <strong>the</strong> firequite well. The temperature <strong>of</strong> 500 °C corresponds to a radiative heat flux <strong>of</strong>20 kW/m 2 , which is <strong>of</strong>ten taken as <strong>the</strong> temperature when many materials ignite. As acomparison, 30 kW/m 2 corresponds to 580 °C (c.f. <strong>the</strong> discussion on <strong>the</strong> flame tiptemperature above).33
<strong>On</strong> <strong>the</strong> <strong>Characteristics</strong> <strong>of</strong> <strong>Fires</strong> <strong>in</strong> <strong>Tunnels</strong>Based on <strong>the</strong> results <strong>of</strong> experiments <strong>in</strong> different scales, Oka et al. drew <strong>the</strong> conclusionthat with natural ventilation <strong>in</strong> <strong>the</strong> tunnel, <strong>the</strong> flame length was about <strong>the</strong>same as <strong>the</strong> free burn<strong>in</strong>g flame length when <strong>the</strong> flame did not touch <strong>the</strong> ceil<strong>in</strong>g [99,105]. If <strong>the</strong> flame touched <strong>the</strong> ceil<strong>in</strong>g it became somewhat longer than <strong>in</strong> <strong>the</strong> freeburn<strong>in</strong>g case. Under conditions <strong>of</strong> forced ventilation when <strong>the</strong> flame tip does notreach <strong>the</strong> ceil<strong>in</strong>g, <strong>the</strong> flame was shorter <strong>in</strong> <strong>the</strong> model tunnel than <strong>in</strong> <strong>the</strong> free burn<strong>in</strong>gcase (without w<strong>in</strong>d). When <strong>the</strong> flame touched <strong>the</strong> ceil<strong>in</strong>g under <strong>the</strong> <strong>in</strong>fluence <strong>of</strong>forced ventilation, <strong>the</strong> flame length became longer <strong>in</strong> <strong>the</strong> model tunnel than <strong>in</strong> a freeburn<strong>in</strong>g case subjected to w<strong>in</strong>d.It is known from Rew and Deaves that <strong>the</strong> flame length <strong>in</strong> tunnels is dependent on<strong>the</strong> longitud<strong>in</strong>al velocity [87]. When study<strong>in</strong>g <strong>the</strong> EUREKA test data <strong>the</strong>y ended upwith <strong>the</strong> follow<strong>in</strong>g correlation:L f⎛ Q&⎞⎛u ⎞= 20⎜⎟⎜ ⎟120000⎝ ⎠⎝10⎠−0.4(4.14)This relationship also <strong>in</strong>dicates that <strong>the</strong> flame length decreases with <strong>in</strong>creas<strong>in</strong>gvelocity. The reason for this feature is that <strong>in</strong>creased velocity leads to <strong>in</strong>creas<strong>in</strong>gentra<strong>in</strong>ment, which <strong>in</strong> turn leads to a shorter flame length.In Paper VII <strong>the</strong> flame lengths estimated from <strong>the</strong> Runehamar test results arepresented and discussed. In this paper a correlation based on <strong>the</strong> HRR and <strong>the</strong> airvelocity was developedLf=1370 ⋅ Q&2 3 2( T − T ) 3Hft00.8u−0.4t(4.15)If <strong>the</strong> effect <strong>of</strong> velocity was not <strong>in</strong>culded <strong>the</strong> correlation constant <strong>in</strong> Eq (4.15) wascalculated to be 941 <strong>in</strong>stead <strong>of</strong> 1370. In Figure 4.2, three <strong>of</strong> <strong>the</strong> different correlationsfor <strong>the</strong> flame length discussed <strong>in</strong> this section (i.e. Alpert, Rew and Deaves, andLönnermark and Ingason (Paper VII)) are compared to (normalized with) <strong>the</strong>experimental flame length from <strong>the</strong> Runehamar test series and presented as function<strong>of</strong> <strong>the</strong> HRR. In <strong>the</strong> correlation by Alpert a value for H f <strong>of</strong> 0.5 m has been used. In <strong>the</strong>graph <strong>the</strong> flame length given by a certa<strong>in</strong> correlation for a particular HRR has beendivided by <strong>the</strong> correspond<strong>in</strong>g experimental value. Each such ratio is presented asfunction <strong>of</strong> <strong>the</strong> HRR.34
4 Flame length and fire spread <strong>in</strong> a tunnelL f,correlation/L f,experiments43.532.521.510.5Alpert, Eq. (4.6)Rew & Deaves, Eq. (4.14)Lönnermark & Ingason, Eq (4.15)00 50 100 150 200 250HRR [MW]Figure 4.2 Comparison <strong>of</strong> different correlations for <strong>the</strong> flame length, normalizedrelative to <strong>the</strong> estimated flame length from <strong>the</strong> Runehamar test (PaperVII).An absolute correlation with experiments corresponds to a straight horizontal l<strong>in</strong>eequal to one. As can be seen from Figure 4.2, <strong>the</strong> correlation by Alpert overestimates<strong>the</strong> flame length, while <strong>the</strong> correlation by Rew and Deaves underestimates <strong>the</strong> flamelength. The reason for Alpert’s over-estimation, besides not be<strong>in</strong>g developed for tunnels,could be <strong>the</strong> sensitivity <strong>of</strong> <strong>the</strong> model to <strong>the</strong> height <strong>of</strong> <strong>the</strong> ceil<strong>in</strong>g above <strong>the</strong> fuel.For a 3D burn<strong>in</strong>g fuel this height is not well def<strong>in</strong>ed. It could be argued that <strong>the</strong>height, H f , <strong>in</strong> Alpert’s correlation could be def<strong>in</strong>ed from <strong>the</strong> base <strong>of</strong> <strong>the</strong> fuel, but <strong>the</strong>exponent 1.5 means that <strong>the</strong>re will be a ratio <strong>of</strong> approximately 22 between <strong>the</strong> case<strong>of</strong> us<strong>in</strong>g H f = 0.5 m and H f = 3.9 m. Best correlation with <strong>the</strong> experiment shows <strong>the</strong>correlation from Paper VII. The explanation for this result is, <strong>of</strong> course, that it wasderived from <strong>the</strong> same experiments. For all three correlations <strong>the</strong>re is a scatter <strong>in</strong> <strong>the</strong>results for low HRRs.As mentioned above, several authors have related <strong>the</strong> extension <strong>of</strong> a flame under aceil<strong>in</strong>g, <strong>in</strong> a corridor or <strong>in</strong> a tunnel to <strong>the</strong> unconf<strong>in</strong>ed flame height. The work byHeskestad and Hamada showed that L f /(h f - H f ) ranged from 0.88 to 1.05, with anaverage <strong>of</strong> 0.95. In <strong>the</strong> graph <strong>in</strong> Figure 4.3 a value <strong>of</strong> 0.95 has been used. For <strong>the</strong>correlation based on <strong>the</strong> work by Heskestad and Babrauskas, h f has been calculatedfrom Heskestad’s relationship and L f /(h f - H f ) was assumed to be 2. In both correlationsbased on <strong>the</strong> work <strong>of</strong> Heskestad, <strong>the</strong> height H f was taken to be <strong>the</strong> height35
<strong>On</strong> <strong>the</strong> <strong>Characteristics</strong> <strong>of</strong> <strong>Fires</strong> <strong>in</strong> <strong>Tunnels</strong>between <strong>the</strong> base <strong>of</strong> <strong>the</strong> fuel and <strong>the</strong> ceil<strong>in</strong>g. The reason for this choice was based on<strong>the</strong> work by Heskestad on three dimensional fires [47].1008060Exp, Runehamar4.2*(hf-Hf)Heskestad/BabrauskasHeskestad/HamadaL f402000 5 10 15 20 25h f- H fFigure 4.3 Flame length as function <strong>of</strong> <strong>the</strong> cut-<strong>of</strong>f height (h f -H f ). Results from <strong>the</strong>Runehamar tests are compared to three different correlations.It can be seen from Figure 4.3 that a coefficient close to 4 (4.2) corresponds wellwith <strong>the</strong> experimental data, i.e. four times <strong>the</strong> cut-<strong>of</strong>f height gives <strong>the</strong> flame length,L f , <strong>in</strong>side <strong>the</strong> tunnel.It should be noted that most <strong>of</strong> <strong>the</strong> correlations have not <strong>in</strong>cluded any dependency <strong>of</strong><strong>the</strong> width <strong>of</strong> <strong>the</strong> tunnel. It can be assumed that this parameter is important for <strong>the</strong>flame length and needs to be <strong>in</strong>cluded <strong>in</strong> future studies. As was discussed above,Babrauskas showed that <strong>the</strong> ratio Lf( hf− Ht) <strong>in</strong>creased from 2 to 3 when <strong>the</strong>width <strong>of</strong> <strong>the</strong> corridor <strong>in</strong>creased from 2 m to 3 m.<strong>On</strong>e <strong>of</strong> <strong>the</strong> few models specifically developed for fire spread <strong>in</strong> tunnels is <strong>the</strong> onedeveloped by Beard [106-110]. The model (FIRE-SPRINT) was created to model <strong>the</strong>fire spread from a burn<strong>in</strong>g HGV to a second HGV. There has been a cont<strong>in</strong>uousdevelopment <strong>of</strong> <strong>the</strong> model through different versions as summarised below (ifnoth<strong>in</strong>g is mentioned <strong>the</strong> next version <strong>of</strong> <strong>the</strong> model has <strong>the</strong> same assumptions as <strong>the</strong>one before):FIRE-SPRINT A1[106]: It was assumed that <strong>the</strong> fire does not extend over or around<strong>the</strong> target vehicle, but is reta<strong>in</strong>ed near <strong>the</strong> region <strong>of</strong> <strong>the</strong> <strong>in</strong>itially burn<strong>in</strong>g vehicle (n<strong>of</strong>lames extend downstream <strong>of</strong> <strong>the</strong> <strong>in</strong>itial fire). A flow <strong>of</strong> air <strong>of</strong> ambient temperatureexists <strong>in</strong> <strong>the</strong> tunnel due to forced ventilation. No smoke is assumed to move upstream.No radiative heat transfer occurs from <strong>the</strong> fire to <strong>the</strong> gases, but radiativefeedback exists on <strong>the</strong> fire from <strong>the</strong> gases.36
4 Flame length and fire spread <strong>in</strong> a tunnelFIRE-SPRINT A2[107]: A flame is assumed to extent <strong>in</strong> <strong>the</strong> upper part <strong>of</strong> <strong>the</strong> tunnel,also above <strong>the</strong> target, but <strong>the</strong>re is a region above <strong>the</strong> target with no flame (between<strong>the</strong> target and <strong>the</strong> flame). It is assumed that no direct radiative heat transfer occurbetween <strong>the</strong> downstream flame and <strong>the</strong> target.FIRE-SPRINT A3 [108]: As <strong>in</strong> FIRE-SPRINT A2, but with a thicker flame <strong>in</strong> <strong>the</strong>region between <strong>the</strong> fire and <strong>the</strong> target. Thermal radiation is assumed to exist between<strong>the</strong> downstream flame section and <strong>the</strong> top <strong>of</strong> <strong>the</strong> target object.FIRE-SPRINT B1 [109]: Flame imp<strong>in</strong>gement onto <strong>the</strong> target is assumed to exist (apersistent flame imp<strong>in</strong>gement is assumed).The models have been used to estimate <strong>the</strong> fire spread by calculat<strong>in</strong>g <strong>the</strong> limits <strong>of</strong>stability <strong>of</strong> <strong>the</strong> system (correlated with a jump <strong>in</strong> <strong>the</strong> temperature) by means <strong>of</strong> nonl<strong>in</strong>eardynamics, and <strong>in</strong>vestigat<strong>in</strong>g how <strong>the</strong>se limits depend on <strong>the</strong> heat release rate,<strong>the</strong> air flow velocity and <strong>the</strong> distance between <strong>the</strong> fire and <strong>the</strong> target. In each <strong>of</strong> <strong>the</strong>above mentioned cases <strong>the</strong> limit for HRR to reach unstable condition (fire spread)has decreased, which is <strong>in</strong> l<strong>in</strong>e with what can be expected. For a case with 6.45 mdistance between <strong>the</strong> fire and <strong>the</strong> target and an air velocity <strong>of</strong> 2 m/s, <strong>the</strong> critical value<strong>of</strong> <strong>the</strong> heat release rate was calculated to be 55.2 MW, 45.3 MW, 38.6 MW, and14 MW, respectively, for <strong>the</strong> four different model versions.The differences <strong>in</strong> results obta<strong>in</strong>ed with <strong>the</strong> different versions show both <strong>the</strong> impactdifferent processes can have on <strong>the</strong> results, and <strong>the</strong> importance <strong>of</strong> large-scale firetests to validate both models used and assumptions made. There are also cases whenflame imp<strong>in</strong>gement onto <strong>the</strong> target (e.g. ano<strong>the</strong>r vehicle) does not exist, which meansthat knowledge about <strong>the</strong> actual situation is needed to make <strong>the</strong> correct assumptions(i.e. <strong>in</strong> order to choose <strong>the</strong> correct version <strong>of</strong> <strong>the</strong> fire spread model). In Paper VII afew different aspects <strong>of</strong> this issue are presented and discussed, both regard<strong>in</strong>g flamelength and fire spread. These are discussed below.Kurioka et al. studied <strong>the</strong> flame tilt and temperature <strong>in</strong> <strong>the</strong> near field <strong>of</strong> a fire (gasburner and pool fires) <strong>in</strong> tunnels <strong>of</strong> different scales [111]. Ano<strong>the</strong>r well <strong>in</strong>strumentedtest series was performed by Apte et al. <strong>in</strong> a 130 m long tunnel us<strong>in</strong>g pool fires withaviation fuel [112]. These two latter test series can give some <strong>in</strong>sight <strong>in</strong>to <strong>the</strong> flamebehaviour even if <strong>the</strong> fire sizes and flame lengths were limited. A test series with amore realistic geometrical set-up, although still <strong>in</strong> reduced scale and us<strong>in</strong>g liquid fuel(one test with wood cribs), were performed by Bettis et al. [113]. The tunnel was366 m long and had a cross-sectional area <strong>of</strong> 5.6 m 2 . The fire sizes ranged from1 MW up to 19 MW. The test set-up simulated parts <strong>of</strong> a tra<strong>in</strong> with HGVs <strong>of</strong> <strong>the</strong>type used <strong>in</strong> <strong>the</strong> Channel tunnel. The results from this work <strong>in</strong>clude, for example,details <strong>of</strong> temperatures and velocities around <strong>the</strong> test set-up.To shed some light on <strong>the</strong> issue regard<strong>in</strong>g wheher flame imp<strong>in</strong>gement is probabledur<strong>in</strong>g a certa<strong>in</strong> fire situation or not, Carvel et al. collected experimental <strong>in</strong>formationfrom <strong>the</strong> literature and used Bayes’ Theorem to calculate <strong>the</strong> probability <strong>of</strong>imp<strong>in</strong>gement [114]. Bayes’ Theorem is suitable due to <strong>the</strong> possibility to performprobability studies with little <strong>in</strong>formation and its ability to improve <strong>the</strong> accuracy <strong>of</strong><strong>the</strong> estimated probability by complement<strong>in</strong>g <strong>the</strong> analysis with new <strong>in</strong>formation. Thebasic equation for Bayes’ Theorem can be written as:37
<strong>On</strong> <strong>the</strong> <strong>Characteristics</strong> <strong>of</strong> <strong>Fires</strong> <strong>in</strong> <strong>Tunnels</strong>( )P imp Ewhere ( imp E)E, ( E imp)( E imp) P( imp)L= (4.16)L( E imp) P( imp) + L( E imp) P( imp)P is <strong>the</strong> probability <strong>of</strong> imp<strong>in</strong>gement with regard to <strong>the</strong> new evidence,L is <strong>the</strong> likelihood <strong>of</strong> <strong>the</strong> evidence assum<strong>in</strong>g that imp<strong>in</strong>gement occurs,P ( imp)is <strong>the</strong> probability <strong>of</strong> imp<strong>in</strong>gement, P ( imp)is <strong>the</strong> probability <strong>of</strong> non-imp<strong>in</strong>gement,and L ( E imp)is <strong>the</strong> likelihood <strong>of</strong> <strong>the</strong> evidence assum<strong>in</strong>g that imp<strong>in</strong>gementdoes not occur [114].The authors scale <strong>the</strong> experimental results and draw <strong>the</strong> conclusion that <strong>the</strong> flamesfrom a majority (“a large portion”) <strong>of</strong> HGV fires will imp<strong>in</strong>ge on ano<strong>the</strong>r HGV up to20 m downstream <strong>of</strong> <strong>the</strong> fire. For a car fire (assumed to have a HRR less than 8 MW)it is unlikely that <strong>the</strong> flame will imp<strong>in</strong>ge on ano<strong>the</strong>r vehicle more than 5 m downstream.In both cases <strong>the</strong> results are assumed to be valid for air velocities between1 m/s and 4 m/s. Even if <strong>the</strong> analyses are based on a limited amount <strong>of</strong> experimentaldata and <strong>the</strong>se data are ra<strong>the</strong>r small scale, <strong>the</strong> approach is <strong>in</strong>terest<strong>in</strong>g.In Paper VII observations <strong>of</strong> fire spread are presented and discussed. Different types<strong>of</strong> targets were used: large targets with <strong>the</strong> same type <strong>of</strong> commodity as used <strong>in</strong> each<strong>of</strong> <strong>the</strong> full scale tests and smaller wooden and plastic targets placed on <strong>the</strong> ground atdifferent distances from <strong>the</strong> seat <strong>of</strong> <strong>the</strong> fire. The plastic targets were affectedapproximately up to <strong>the</strong> flame length (which correlates well with Heselden’sassumption <strong>of</strong> 580 ºC correspond<strong>in</strong>g to a critical distance for ignition) while <strong>the</strong> firespread to <strong>the</strong> pieces <strong>of</strong> wood occurred up to a distance <strong>of</strong> about (or somewhat morethan) 70 % <strong>of</strong> <strong>the</strong> flame length. For <strong>the</strong> 202 MW fire <strong>in</strong> test T1 this corresponds t<strong>of</strong>ire spread distances <strong>of</strong> 95 m for plastic targets and 70 m for wooden targets. Thiscorresponds to spontaneous ignition due to radiation dom<strong>in</strong>ated fire spread from <strong>the</strong>upper layer to <strong>the</strong> road surface. With a higher target, e.g. a vehicle with a cargo, <strong>the</strong>fire might spread even fur<strong>the</strong>r distances between <strong>the</strong> <strong>in</strong>itial fire and <strong>the</strong> target s<strong>in</strong>ceconvective heat<strong>in</strong>g and high temperature <strong>in</strong> <strong>the</strong> upper layer <strong>in</strong>fluence <strong>the</strong> target to alarger extent. Also direct imp<strong>in</strong>gement <strong>of</strong> flames onto <strong>the</strong> target can occur. Theradiation will, however, still be an important factor for <strong>the</strong> fire spread.The fire spread to <strong>the</strong> large target was observed on video <strong>in</strong> test T3. This <strong>in</strong>formationtoge<strong>the</strong>r with measurements <strong>of</strong> temperature and radiation was used to estimate <strong>the</strong>time <strong>of</strong> fire spread <strong>in</strong> <strong>the</strong> tests T1 and T2 (see Paper VII). When <strong>the</strong> fire spread to <strong>the</strong>large target (20 to 22 m downstream <strong>of</strong> <strong>the</strong> centre <strong>of</strong> <strong>the</strong> fire), <strong>the</strong> heat release ratewas <strong>in</strong> <strong>the</strong> range <strong>of</strong> 20 MW to 40 MW. This was obta<strong>in</strong>ed <strong>in</strong> a longitud<strong>in</strong>al flow <strong>of</strong>about 2 to 3 m/s.The fire spread results presented <strong>in</strong> Paper VII can be compared to <strong>the</strong> observationsfrom <strong>the</strong> fire <strong>in</strong> <strong>the</strong> Fréjus tunnel <strong>in</strong> June 2005. The fire started <strong>in</strong> <strong>the</strong> eng<strong>in</strong>e <strong>of</strong> anHGV loaded with tyres. The fire <strong>the</strong>n spread to a HGV loaded with cheese 100 maway. An HGV with scrap metal ano<strong>the</strong>r 100 m away was also ignited. A fourthHGV, 450 m from <strong>the</strong> <strong>in</strong>itial fire was ignited, but this was ext<strong>in</strong>guished before <strong>the</strong>tank conta<strong>in</strong><strong>in</strong>g toxic glue was ruptured [115]. These observations correlate wellwith <strong>the</strong> results from <strong>the</strong> Runehamar tests. It shows <strong>the</strong> long distances this type <strong>of</strong>fire can spread and, once aga<strong>in</strong> emphasizes <strong>the</strong> importance <strong>of</strong> HGVs on <strong>the</strong> outcome<strong>of</strong> tunnel fires.38
4 Flame length and fire spread <strong>in</strong> a tunnelA tool more commonly used <strong>the</strong>se days is CFD (computational fluid dynamics)modell<strong>in</strong>g, particularly for smoke movement calculations and <strong>in</strong>vestigations <strong>of</strong> <strong>the</strong>critical velocity, but also for studies <strong>of</strong> <strong>the</strong> fire spread <strong>in</strong> tunnels. CFD codes are <strong>in</strong>many cases general <strong>in</strong> <strong>the</strong>ir application, <strong>of</strong>ten with a certa<strong>in</strong> application ordevelopment towards fires. In recent years some <strong>of</strong> <strong>the</strong>se codes have been speciallydeveloped for tunnels. The CFD codes represent a complex tool where <strong>the</strong>usefulness <strong>of</strong>ten needs to be verified aga<strong>in</strong>st experimental data for each new type <strong>of</strong>scenario. The variation can relate to choice <strong>of</strong> method, submodels, values <strong>of</strong>parameters, type <strong>of</strong> boundary condition, values <strong>of</strong> boundary conditions, etc.Therefore, <strong>the</strong> CFD codes will not be discussed here, but are only mentioned toemphasize <strong>the</strong> importance <strong>of</strong> large-scale fire tests <strong>of</strong> <strong>the</strong> k<strong>in</strong>d discussed <strong>in</strong> this <strong>the</strong>sis.The importance <strong>of</strong> assess<strong>in</strong>g <strong>the</strong> use <strong>of</strong> a fire model (<strong>in</strong>clud<strong>in</strong>g <strong>the</strong> fire model itself,<strong>the</strong> methodology <strong>of</strong> use, and <strong>the</strong> user) is thoroughly discussed <strong>in</strong> a paper by Beard[116]. However, CFD is already an important tool and <strong>the</strong> development <strong>of</strong> both <strong>the</strong>CFD codes and computer capacities will fur<strong>the</strong>r <strong>in</strong>crease <strong>the</strong> usefulness. Thepossibility <strong>of</strong> vary<strong>in</strong>g conditions and different parameters makes CFD an importantcomplement to fire tests.39
<strong>On</strong> <strong>the</strong> <strong>Characteristics</strong> <strong>of</strong> <strong>Fires</strong> <strong>in</strong> <strong>Tunnels</strong>40
5 Ventilation5 VentilationThe ventilation is an important parameter def<strong>in</strong><strong>in</strong>g <strong>the</strong> conditions <strong>of</strong> a fire <strong>in</strong> atunnel. Therefore, different types <strong>of</strong> ventilation systems <strong>in</strong> tunnels are brieflydiscussed <strong>in</strong> Section 5.1. The rest <strong>of</strong> this chapter is focused on three differentphenomena observed <strong>in</strong> connection with tunnel fires: <strong>the</strong> effect <strong>of</strong> ventilation on <strong>the</strong>HRR (Section 5.2), backlayer<strong>in</strong>g (Section 5.3), and <strong>the</strong> pulsations observed <strong>in</strong> two <strong>of</strong><strong>the</strong> Runehamar tests (Section 5.4). The ventilation is also important for <strong>the</strong>combustion and <strong>the</strong> concentration <strong>of</strong> different gases <strong>in</strong> <strong>the</strong> tunnel. This will bediscussed <strong>in</strong> Chapter 6.5.1 Different types <strong>of</strong> ventilationVentilation <strong>in</strong> tunnels has become an important issue dur<strong>in</strong>g design<strong>in</strong>g <strong>of</strong> equipmentfound <strong>in</strong>side a tunnel. Dur<strong>in</strong>g <strong>the</strong> regular use <strong>of</strong> a tunnel, toxic emissions from <strong>the</strong>traffic need to be ventilated away. In short, low traffic tunnels this problem is <strong>of</strong>tensolved by “natural” air movements, e.g. due to vehicle movement <strong>in</strong>side <strong>the</strong> tunnel,differences <strong>in</strong> elevation between <strong>the</strong> portals, temperature differences, or o<strong>the</strong>rmeteorological effects (e.g. w<strong>in</strong>d). The natural ventilation can create flow fromportal to portal, from shaft to shaft, or from portal to shaft. For mechanically ventilatedtunnel systems, <strong>the</strong>re exist two ma<strong>in</strong> ventilation systems, longitud<strong>in</strong>al ventilationand transverse ventilation systems. The latter can be subdivided <strong>in</strong>to fully transverse,supply semi-transverse, and exhaust semi-transverse ventilation systems.A longitud<strong>in</strong>al ventilation system creates a longitud<strong>in</strong>al flow <strong>in</strong>side <strong>the</strong> tunnel us<strong>in</strong>ga limited number <strong>of</strong> fans or <strong>in</strong>lets/exhausts. The transverse systems, on <strong>the</strong> o<strong>the</strong>rhand, use a large number <strong>of</strong> <strong>in</strong>lets and/or exhausts, uniformly distributed over <strong>the</strong>tunnel length. Fully transverse ventilation systems mean that air is both supplied andexhausted along <strong>the</strong> length <strong>of</strong> <strong>the</strong> tunnel. Semi-transverse means that ei<strong>the</strong>r fresh airis supplied to or vitiated air extracted from <strong>the</strong> tunnel along its full length. A stagebetween fully and semi-transverse ventilation also exists, called partial transverseventilation, depend<strong>in</strong>g on <strong>the</strong> ratio between air supplied and extracted. For more<strong>in</strong>formation on ventilation <strong>in</strong> tunnels see references [12, 117].Extraction <strong>of</strong> vitiated gases, locally near <strong>the</strong> fire, has been shown <strong>in</strong> fire tests to be asuccessful method to create better conditions <strong>in</strong>side a tunnel dur<strong>in</strong>g a fire, both for<strong>the</strong> evacuat<strong>in</strong>g people and for <strong>the</strong> rescue service. The tests <strong>in</strong> <strong>the</strong> Memeorial tunnelshowed that both extraction and longitud<strong>in</strong>al airflow are crucial parameters whenremov<strong>in</strong>g smoke and heat near a fire [48]. The efficiency <strong>of</strong> extraction <strong>of</strong> fire gasesnear <strong>the</strong> fire has also been observed by Ingason <strong>in</strong> model scale tests (results to bepublished). This strategy <strong>of</strong> local extraction has become a reality <strong>in</strong> some modernsystems, e.g. <strong>in</strong> sectioned transverse ventilation system. <strong>On</strong>e good example <strong>of</strong> this is<strong>the</strong> new ventilation system <strong>in</strong> <strong>the</strong> Mont Blanc tunnel where a comb<strong>in</strong>ation, <strong>of</strong> semitransverseand longitud<strong>in</strong>al systems, is used [118-121].41
<strong>On</strong> <strong>the</strong> <strong>Characteristics</strong> <strong>of</strong> <strong>Fires</strong> <strong>in</strong> <strong>Tunnels</strong>5.2 Effects <strong>of</strong> ventilation on <strong>the</strong> fireThat <strong>the</strong> ventilation has an effect on <strong>the</strong> HRR and fire growth rate has been shownby results from several test series described by different authors. Carvel et al used amore systematic approach to <strong>the</strong>se results by us<strong>in</strong>g <strong>the</strong> same type <strong>of</strong> Bayesianapproach as described <strong>in</strong> Chapter 4 (used by Carvel for flame imp<strong>in</strong>gement), toestimate <strong>the</strong> effect <strong>of</strong> <strong>the</strong> ventilation on <strong>the</strong> growth <strong>of</strong> <strong>the</strong> fire and <strong>the</strong> HRR <strong>of</strong> <strong>the</strong>fully developed fire <strong>in</strong> a s<strong>in</strong>gle lane tunnel. The probability can be def<strong>in</strong>ed us<strong>in</strong>g asimilar expression to Eq. (4.16), with <strong>the</strong> two conditions ‘imp<strong>in</strong>gement’ and ‘nonimp<strong>in</strong>gement’exchanged for a different hypo<strong>the</strong>sis, and k=k i , where k is <strong>the</strong> ratiobetween HRR with and without forced ventilation, respectively. The orig<strong>in</strong>al workon HGVs led to <strong>the</strong> conclusion that an air flow <strong>of</strong> 2 m/s would lead to seven timesfaster fire growth and four times higher maximum HRR than for natural ventilation.For a ventilation <strong>of</strong> 10 m/s <strong>the</strong> correspond<strong>in</strong>g values were estimated to be 22 and 8-9, respectively [122]. For <strong>the</strong> study, results from <strong>the</strong> HGV fire test <strong>in</strong> <strong>the</strong> Repparfjordtunnel and different wooden crib test were used [46, 78, 113, 123, 124]. Laterestimations were made for two-lane tunnels [83] when results from <strong>the</strong> 2 nd Beneluxtunnel tests [65] and from <strong>the</strong> Runehamar tunnel tests were <strong>in</strong>cluded (see e.g.Paper II). The estimations for a two-lane tunnel were that an air flow <strong>of</strong> 2 m/s wouldlead to 3-4 times faster fire growth and 1.5 times higher maximum HRR than fornatural ventilation. For a ventilation <strong>of</strong> 10 m/s <strong>the</strong> correspond<strong>in</strong>g values wereestimated to be 6 and 3, respectively.The results from <strong>the</strong> tests with simulated HGVs (36 wood pallets) <strong>in</strong> <strong>the</strong> 2 nd Beneluxtunnel show that <strong>the</strong> development rate with ventilation was 1.7 to 2 times faster than<strong>the</strong> fire development without ventilation. The peak heat release rate was 13.5 MWwithout ventilation, 19 MW with 4-6 m/s ventilation and 16.5 MW with 6 m/s,which corresponds to 1.4 and 1.2 times higher, respectively [60]. Huijben estimated<strong>the</strong> <strong>in</strong>crease <strong>in</strong> HRR due to <strong>the</strong> ventilation to be 35 % [125].For car fires Carvel et al. reported that <strong>the</strong> <strong>in</strong>crease factor, k, could not be estimatedfor velocities higher than 1.5 m/s due to lack <strong>of</strong> experimental data [126]. The authorsconcluded that at this velocity <strong>the</strong> ventilation would not have any significant effecton <strong>the</strong> HRR or <strong>the</strong> fire growth. When add<strong>in</strong>g some <strong>in</strong>formation from <strong>the</strong> tests <strong>in</strong> <strong>the</strong>2 nd Benelux tunnel, <strong>in</strong>clud<strong>in</strong>g one with an airflow <strong>of</strong> 6 m/s, Carvel et al. draw <strong>the</strong>conclusion that k for <strong>the</strong> peak HRR for <strong>the</strong> new <strong>in</strong>formation is equal to or less thanone [127]. The same conclusion was drawn by Huijben [125].When it comes to pool fires, Carvel et al. drew <strong>the</strong> conclusions that for a small ormedium sized pool fire, <strong>in</strong>creased ventilation will decrease <strong>the</strong> HRR [128]. For alarge pool fire an <strong>in</strong>crease <strong>in</strong> ventilation will probably <strong>in</strong>crease <strong>the</strong> HRR. The limitbetween <strong>the</strong>se situations is dependent on <strong>the</strong> tunnel and <strong>the</strong> ventilation conditions,i.e. whe<strong>the</strong>r <strong>the</strong> fire is well ventilated or under-ventilated. This is fur<strong>the</strong>r discussedbelow.The method used by Carvel et al. is <strong>in</strong>terest<strong>in</strong>g due to its ability to estimate probabilitiesfrom little <strong>in</strong>formation. It can, however, be difficult to f<strong>in</strong>d correspond<strong>in</strong>g<strong>in</strong>formation for different ventilation velocities, i.e. test series where <strong>the</strong> ventilationhas been varied, keep<strong>in</strong>g all o<strong>the</strong>r parameters constant. When compar<strong>in</strong>g different42
5 Ventilationfire tests and different experimental series one realises that such a comparison can <strong>in</strong>many cases be very difficult to perform. The reason for this be<strong>in</strong>g that <strong>the</strong> purpose <strong>of</strong>each study varies from case to case. This means that measurements performed,positions <strong>of</strong> <strong>in</strong>struments/probes, calculations performed, assumptions made, presentation<strong>of</strong> data, etc. vary between <strong>the</strong> cases. Below some examples <strong>of</strong> such cases arepresented and discussed. The conclusion to be drawn from this is that fur<strong>the</strong>rexperimental studies <strong>of</strong> <strong>the</strong> effect <strong>of</strong> <strong>the</strong> ventilation on <strong>the</strong> fire development andHRR are needed to obta<strong>in</strong> <strong>in</strong>put data for models <strong>of</strong> <strong>the</strong>se issues.Model-scale experiments, with methanol pool fires <strong>in</strong> a tunnel, show that <strong>the</strong> burn<strong>in</strong>grate decreases with <strong>in</strong>creas<strong>in</strong>g air velocity, at least for <strong>the</strong> largest pool diametersused (0.2 m and 0.25 m) [41]. For pools with a smaller diameter (0.15 m) <strong>the</strong> effectis much smaller and for <strong>the</strong> smallest case (0.1 m), <strong>the</strong> effect is negligible. The effectcan be related to <strong>the</strong> radiation and <strong>the</strong> effect <strong>of</strong> <strong>the</strong> tunnel on <strong>the</strong> burn<strong>in</strong>g rate. For <strong>the</strong>smaller pool sizes <strong>the</strong> differences between burn<strong>in</strong>g <strong>in</strong> open air and burn<strong>in</strong>g <strong>in</strong>side <strong>the</strong>tunnel are very small and <strong>in</strong> <strong>the</strong>se cases <strong>the</strong> effect <strong>of</strong> <strong>the</strong> air velocity is very small.Ingason and Werl<strong>in</strong>g performed model scale tests <strong>in</strong> a 20 m tunnel where kerosenewas used as fuel [129]. The effect <strong>of</strong> longitud<strong>in</strong>al ventilation was studied and forvelocities <strong>of</strong> 0.5 m/s and 0.75 m/s (correspond<strong>in</strong>g to 1.4 m/s and 2.1 m/s, respectively,<strong>in</strong> real scale) <strong>the</strong> mass burn<strong>in</strong>g rate per unit fuel area decreased with<strong>in</strong>creas<strong>in</strong>g air velocity. This is due to <strong>the</strong> decrease <strong>in</strong> radiation feedback. For highervelocities <strong>the</strong> mass burn<strong>in</strong>g rate per unit fuel area <strong>in</strong>creased with <strong>in</strong>creas<strong>in</strong>g airvelocity. The authors expla<strong>in</strong>ed this effect with <strong>in</strong>creased mix<strong>in</strong>g at <strong>the</strong> fuel surface.In Table 5.1, <strong>the</strong> estimated HRR values from <strong>the</strong> tests <strong>in</strong> <strong>the</strong> Ofenegg tunnel arepresented. The HRR values are calculated from <strong>the</strong> burn<strong>in</strong>g rate presented byHaerter [61] us<strong>in</strong>g <strong>the</strong> follow<strong>in</strong>g equationQ & = χ ⋅V& ′′ ⋅ A f⋅ ρ ⋅ Δh c(5.1)where χ is <strong>the</strong> combustion efficiency (assumed to be 0.9), V &′is <strong>the</strong> volumetricsurface burn<strong>in</strong>g rate [m 3 /(m 2 s)], A f is <strong>the</strong> fuel area, and Δh c is <strong>the</strong> heat <strong>of</strong> combustionfor petrol (= 43.7 MJ/kg for gasol<strong>in</strong>e accord<strong>in</strong>g to [130]). From <strong>the</strong> table it can beseen that <strong>the</strong> burn<strong>in</strong>g rate is decreas<strong>in</strong>g with <strong>in</strong>creas<strong>in</strong>g surface area. This is contraryto previous data, i.e. <strong>the</strong> surface burn<strong>in</strong>g rate <strong>in</strong>creases with area up to a certa<strong>in</strong> limit[131]. In <strong>the</strong> Ofenegg case <strong>the</strong> HRR for <strong>the</strong> surface areas 47.5 and 95 m 2 are about<strong>the</strong> same for natural ventilation. This is due to <strong>the</strong> limited ventilation <strong>in</strong> <strong>the</strong> tunnelthat had one dead end and <strong>in</strong> <strong>the</strong> case <strong>of</strong> natural ventilation, fresh air only from <strong>the</strong>open portal. <strong>On</strong>e should note that <strong>in</strong> <strong>the</strong> calculations, a constant combustionefficiency <strong>of</strong> 0.9 has been assumed. This value can vary with time and between <strong>the</strong>tests. Especially <strong>in</strong> under-ventilated cases <strong>the</strong> combustion efficiency can be considerablylower [132]. The semi-transverse ventilation decreases <strong>the</strong> HRR <strong>in</strong> allcases, while <strong>the</strong> longitud<strong>in</strong>al ventilation decreases <strong>the</strong> HRR for <strong>the</strong> smallest area and<strong>in</strong>creases <strong>the</strong> HRR for <strong>the</strong> case with fire area 47.5 m 2 . The latter can be expla<strong>in</strong>ed by<strong>the</strong> case be<strong>in</strong>g vitiated without ventilation. In Table 5.1 <strong>the</strong> estimated air velocityneeded for stoichiometric combustion is also <strong>in</strong>cluded for some <strong>of</strong> <strong>the</strong> ventilationconditions <strong>in</strong> <strong>the</strong> Ofenegg tunnel test series.43
<strong>On</strong> <strong>the</strong> <strong>Characteristics</strong> <strong>of</strong> <strong>Fires</strong> <strong>in</strong> <strong>Tunnels</strong>Table 5.1 Estimation <strong>of</strong> HRR (Eq 5.1) from data from <strong>the</strong> Ofenegg tunnel tests[61].TestVentilationa) V & b)[m 3 /s]v c)[m/s]Fuelarea[m 2 ]Rate <strong>of</strong>burn<strong>in</strong>g d)[L/(m 2 m<strong>in</strong>)]HRR[MW]v c e) [m/s]1 N 0 - 6.6 5-6 16-19 0.36-0.432 S-T 15 - 6.6 3.7-5 12-162a L 39 1.7 6.6 3.7-5 12-16 0.13-0.185 N 0 - 47.5 1.7-2.1 38-47 0.87-1.086 S-T 15 - 47.5 1.5-1.7 34-387a L 39 1.7 47.5 2.6-3.5 58-79 0.67-0.909 N 0 - 95 0.8-0.9 36-40 0.82-0.9210 S-T 6 - 95 0.7-0.8 31-36a) N = Natural; S-T = Semi-transverse; L = Longitud<strong>in</strong>alb) Air supply ventilationc) Longitud<strong>in</strong>al velocity given by Haerter [61].d) Correspond<strong>in</strong>g open air pool fire burn<strong>in</strong>g rate is 5-6 L/(m 2 m<strong>in</strong>)e) Velocity needed for <strong>the</strong> calculated HRR (with E = 13.1 MJ/kg O 2 ); for natural ventilationcalculated as fresh air flow<strong>in</strong>g <strong>in</strong> <strong>the</strong> lower part <strong>of</strong> <strong>the</strong> tunnel (11.5 m 2 ), for longitud<strong>in</strong>alcalculated with full tunnel cross-sectional area, for semi-transverse ventilation no calculationwas made due to <strong>the</strong> difficulty <strong>in</strong> def<strong>in</strong><strong>in</strong>g flow region.The Ofenegg tunnel fire tests show what large differences <strong>in</strong> conditions can exist fordifferent cases <strong>of</strong> natural ventilation. In <strong>the</strong> Ofenegg tests <strong>the</strong>re was a dead end. Ino<strong>the</strong>r cases o<strong>the</strong>r factors can alter <strong>the</strong> situation, e.g. slope <strong>of</strong> <strong>the</strong> tunnel, outside w<strong>in</strong>d,etc.Liew et al. showed by calculations and discussion, how <strong>the</strong> ventilation can <strong>in</strong>fluence<strong>the</strong> fire spread and smoke movement and <strong>the</strong>reby <strong>the</strong> decisions to be made regard<strong>in</strong>gventilation direction [133]. <strong>On</strong>e <strong>of</strong> <strong>the</strong> important questions when it comes to <strong>the</strong> firesafety strategy <strong>in</strong> <strong>the</strong> Eurotunnel is whe<strong>the</strong>r a ‘keep go<strong>in</strong>g’ philosophy should beused. The conclusion by Liew et al. was that <strong>the</strong> keep go<strong>in</strong>g philosophy wasacceptable from a fire spread and tunnel damage perspective, but an uncontrolledstop had to be avoided s<strong>in</strong>ce this o<strong>the</strong>rwise could lead to fatalities.The HGV test performed with<strong>in</strong> <strong>the</strong> EUREKA 499 project [54, 123, 134] is <strong>of</strong>tenreferred to as an example <strong>of</strong> <strong>the</strong> effect ventilation can have on <strong>the</strong> HRR. Themeasurements clearly show <strong>the</strong> decrease <strong>in</strong> heat release rate when <strong>the</strong> ventilation isturned <strong>of</strong>f dur<strong>in</strong>g three m<strong>in</strong>utes (13:30 to 16:30). However, dur<strong>in</strong>g this phase withoutventilation, <strong>the</strong> velocity 100 m upstream <strong>of</strong> <strong>the</strong> fire decreases almost to zero (0.1 m/s- 0.2 m/s) [123]. The tunnel was slop<strong>in</strong>g upwards (0.5 % - 1 % [135]) <strong>in</strong> relation to<strong>the</strong> ventilation and ma<strong>in</strong> flow <strong>in</strong> <strong>the</strong> tunnel. This was, however, not enough toprevent some <strong>of</strong> <strong>the</strong> gases from flow<strong>in</strong>g backwards. This means that <strong>the</strong> HRRmeasurements dur<strong>in</strong>g this time period are not necessarily as accurate as dur<strong>in</strong>g <strong>the</strong>rest <strong>of</strong> <strong>the</strong> test, depend<strong>in</strong>g on whe<strong>the</strong>r some <strong>of</strong> <strong>the</strong> gases were delayed <strong>in</strong> reach<strong>in</strong>g <strong>the</strong>measur<strong>in</strong>g station. This might also be <strong>the</strong> reason for a second peak <strong>in</strong> <strong>the</strong> HRR(128 MW) higher <strong>the</strong>n <strong>the</strong> previous peak (121 MW) even if <strong>the</strong> air flow velocityafter <strong>the</strong> stop <strong>of</strong> <strong>the</strong> fan was lower (on average 2.8 m/s) <strong>the</strong>n before <strong>the</strong> stop (onaverage 5.5 m/s).44
5 VentilationO<strong>the</strong>rwise <strong>the</strong>re is no significant difference <strong>in</strong> maximum HRR between <strong>the</strong> caseswith velocities <strong>of</strong> 5.5 m/s and 2.8 m/s, respectively. The HRR was determ<strong>in</strong>ed <strong>in</strong>several different ways, but <strong>the</strong> ones given by Grant and Drysdale [49] seem to bemost reasonable. Their HRR value (a maximum <strong>of</strong> 128 MW if gas analyses 30 mdownstream <strong>of</strong> <strong>the</strong> fire are used; a maximum <strong>of</strong> 121 MW if gas analyses 100 mdownstream <strong>of</strong> <strong>the</strong> fire are used) is near <strong>the</strong> maximum value <strong>of</strong> 119 MW estimated <strong>in</strong>test T3 <strong>in</strong> <strong>the</strong> Runehamar test with similar goods (see Paper II). Grant and Drysdaleused assumed values for <strong>the</strong> net heat <strong>of</strong> combustion <strong>of</strong> fuel per mass <strong>of</strong> produced COand CO 2 , respectively. The assumed values were said to be average values for arepresentative mix <strong>of</strong> fuels [49].In <strong>the</strong> Repparfjord tunnel, a test with a simulated truck load was also carried out[54]. This test were carried out with natural ventilation and reached much lowermaximum HRR (approximately 17 MW [75]) than was <strong>the</strong> case for <strong>the</strong> HGV test <strong>in</strong><strong>the</strong> same test series (128 MW). There are, however, two important differencesbetween <strong>the</strong> tests. The total calorific value was 37 % (87400 MJ compared to63700 MJ) higher <strong>in</strong> <strong>the</strong> HGV tests than <strong>in</strong> <strong>the</strong> test with <strong>the</strong> simulated load. Ano<strong>the</strong>rimportant difference is that <strong>in</strong> <strong>the</strong> HGV tests, <strong>the</strong> ma<strong>in</strong> commodity used was furniture,while <strong>in</strong> <strong>the</strong> simulated load tests densely packed wood cribs was <strong>the</strong> ma<strong>in</strong> component,both weight wise and energy wise. In Section 3.3 it was shown that <strong>the</strong>reexists a relationship between <strong>the</strong> maximum HRR and <strong>the</strong> energy content. The overalltrend is <strong>the</strong> same for <strong>the</strong> tests <strong>in</strong> <strong>the</strong> Runehamar tunnel (see Paper II). The HRR was,however, higher <strong>in</strong> test T2 (mattresses and wood pallets) than <strong>in</strong> test T3 (furniture),which <strong>in</strong>dicates that <strong>the</strong> total calorific value is not alone determ<strong>in</strong><strong>in</strong>g <strong>the</strong> peak HRR.The geometry <strong>of</strong> <strong>the</strong> fuel is very important and as <strong>the</strong> geometry varies, <strong>the</strong> effect <strong>of</strong><strong>the</strong> ventilation on <strong>the</strong> HRR can also vary. It should also be mentioned that <strong>the</strong> totalcalorific value <strong>in</strong> test T3 was higher than both <strong>the</strong> tests <strong>in</strong> <strong>the</strong> Repparfjord tunneldiscussed above. The reason for <strong>the</strong> relatively low HRR <strong>in</strong> <strong>the</strong> furniture tests <strong>in</strong>Runehamar was discussed above and is probably due to <strong>the</strong> fact that much <strong>of</strong> <strong>the</strong>cellulosic material used (e.g. cupboard doors) were packed <strong>in</strong> a very compact way.The explicit effects <strong>of</strong> <strong>the</strong> ventilation <strong>in</strong> <strong>the</strong>se tests are difficult to assess, s<strong>in</strong>ce nosimilar test <strong>of</strong> <strong>the</strong> same size was performed without ventilation. However, freeburn<strong>in</strong>g tests under SP’s <strong>in</strong>dustry calorimeter were performed with <strong>the</strong> same commoditiesas used <strong>in</strong> test T1, T2, and T4, respectively [136]. From <strong>the</strong>se pre-testsIngason estimated <strong>the</strong> expected HRR <strong>in</strong> <strong>the</strong> large-scale tests <strong>in</strong> <strong>the</strong> Runehamar tunnelbefore performance <strong>of</strong> <strong>the</strong> tests [137]. In Table 5.2 estimated and measured peakHRRs are compared. If all available material is <strong>in</strong>cluded (i.e. <strong>the</strong> target is <strong>in</strong>cluded),<strong>the</strong> ratio <strong>of</strong> <strong>the</strong> measured peak HRR and <strong>the</strong> estimated peak HRR range from 0.81 to0.93.Dur<strong>in</strong>g <strong>the</strong> test series <strong>in</strong> <strong>the</strong> Repparfjord tunnel several tests with wood cribs wereperformed. A comparison between two <strong>of</strong> <strong>the</strong>se tests, one without and one withventilation (on average 2.2 m/s [54]), clearly shows <strong>the</strong> <strong>in</strong>fluence <strong>of</strong> ventilation. In<strong>the</strong> first case <strong>the</strong> maximum HRR was approximately 9 MW, while <strong>in</strong> <strong>the</strong> second case<strong>the</strong> maximum HRR was approximately 27 MW [75], i.e. three times higher withventilation. Ingason, however, performed an energy analysis, which showed that <strong>the</strong>HRR <strong>in</strong> <strong>the</strong> second case was probably considerably overestimated. Ingason po<strong>in</strong>tedout that a probable reason for <strong>the</strong> discrepancy was an assumption regard<strong>in</strong>g <strong>the</strong> O 2concentration below <strong>the</strong> lowest measurement po<strong>in</strong>t. An estimation <strong>of</strong> <strong>the</strong> HRR from45
<strong>On</strong> <strong>the</strong> <strong>Characteristics</strong> <strong>of</strong> <strong>Fires</strong> <strong>in</strong> <strong>Tunnels</strong><strong>the</strong> measured mass loss rate gives a value between 11 MW and 12 MW (us<strong>in</strong>g a heat<strong>of</strong> combustion <strong>of</strong> 17 MJ/kg). The mass loss signal is not available for <strong>the</strong> wholetests, but <strong>the</strong> signal that is available does not show <strong>the</strong> rapid <strong>in</strong>crease as calculatedfrom <strong>the</strong> gas analyses. Still, <strong>the</strong>re was a higher HRR <strong>in</strong> <strong>the</strong> case with ventilation,even if <strong>the</strong> factor was only approximately 1.5. Ano<strong>the</strong>r aspect <strong>of</strong> <strong>the</strong> comparison <strong>of</strong><strong>the</strong>se tests is <strong>the</strong> fact that <strong>the</strong> 3D effect <strong>of</strong> <strong>the</strong> burn<strong>in</strong>g <strong>of</strong> wood cribs is significant.The reaction to ventilation <strong>in</strong> such a case can be quite different to a case with fuelwhere ma<strong>in</strong>ly <strong>the</strong> outer surfaces are burn<strong>in</strong>g.This is an illustration <strong>of</strong> how important it is to take different aspects <strong>of</strong> <strong>the</strong> set-upand <strong>the</strong> performance <strong>of</strong> tests <strong>in</strong>to account when compar<strong>in</strong>g effects <strong>of</strong> <strong>the</strong> ventilation.The effect <strong>of</strong> ventilation can be very dependent on <strong>the</strong> start<strong>in</strong>g conditions; an underventilatedfire is more affected than an already well-ventilated fire. This will bediscussed fur<strong>the</strong>r <strong>in</strong> <strong>the</strong> section on <strong>the</strong> combustion and <strong>the</strong> conditions <strong>in</strong> <strong>the</strong> tunnelbelow (see also Paper III). The availability <strong>of</strong> oxygen is not important only for <strong>the</strong>gaseous flam<strong>in</strong>g combustion. It has also been shown that <strong>the</strong> presence <strong>of</strong> oxygennear <strong>the</strong> surface <strong>of</strong> some polymers (e.g. Polye<strong>the</strong>ne and polypropene) significantly<strong>in</strong>creases <strong>the</strong> decomposition rate [138]. Most <strong>of</strong> <strong>the</strong> experiments <strong>in</strong>dicat<strong>in</strong>g <strong>the</strong>seresults were performed <strong>in</strong> laboratory scale (candles), and it is uncerta<strong>in</strong> how importantthis effect is <strong>in</strong> a large-scale fire.Table 5.2 Estimated peak HRR for <strong>the</strong> Runehamar tests based on laboratory tests([136, 137] and Paper II).TestEstimatedpeak HRRexcl. target[MW]Estimatedpeak HRR<strong>in</strong>cl. target[MW]Measuredpeak HRR[MW]MeasuredHRR/EstimatedHRRexcl. targetMeasuredHRR/EstimatedHRR<strong>in</strong>cl. targetT1 186 217 202 1.09 0.93T2 167 195 157 0.94 0.81T4 79 95 66 0.84 - a)a) No large target was used <strong>in</strong> test T4.There is still a need for fur<strong>the</strong>r experimental studies <strong>of</strong> HRR from different types <strong>of</strong>fires <strong>in</strong> tunnels. However, <strong>the</strong> experimental results available are <strong>in</strong>creas<strong>in</strong>g and <strong>the</strong>seshould be used to assess <strong>the</strong> correctness <strong>of</strong> <strong>the</strong> models used to date. When do<strong>in</strong>g suchassessments it is important to carefully identify <strong>the</strong> purposes <strong>of</strong> <strong>the</strong> tests and discussdifferences between different tests and different test series. Fur<strong>the</strong>rmore, <strong>the</strong>re isalways a degree <strong>of</strong> uncerta<strong>in</strong>ty <strong>in</strong>volved <strong>in</strong> experimental studies (as is <strong>the</strong> case formodell<strong>in</strong>g). This became especially obvious <strong>in</strong> <strong>the</strong> tests <strong>in</strong> <strong>the</strong> Repparfjord tunnelwhere <strong>the</strong> estimates <strong>of</strong> <strong>the</strong> HRR from <strong>the</strong> HGV tests varied significantly between <strong>the</strong>research groups [54]. However, such shortcom<strong>in</strong>gs can <strong>of</strong>ten be both identified andexpla<strong>in</strong>ed if <strong>the</strong> results are carefully checked (see e.g. Paper II and reference [75]).Carvel has developed a fire model, CERBERUS, that besides <strong>the</strong> effect <strong>of</strong> <strong>the</strong>ventilation on <strong>the</strong> HRR also <strong>in</strong>cludes <strong>the</strong> fire spread model by Beard describedabove, and <strong>the</strong> <strong>in</strong>fluence <strong>of</strong> <strong>the</strong> tunnel geometry on <strong>the</strong> HRR [139]. There are,however, still some validation studies that need to be performed. Carvel et al.46
5 Ventilationdiscusses a tunnel fire <strong>in</strong> a HGV loaded with furniture. In a situation with ventilationgiv<strong>in</strong>g an air speed <strong>of</strong> 1 m/s, <strong>the</strong> heat release rate is estimated to be between 9 MW(10 th percentile) and 88 MW (90 th %) with a 50 th percentile value <strong>of</strong> 31 MW [140].For an air speed <strong>of</strong> 3 m/s or 10 m/s <strong>the</strong> correspond<strong>in</strong>g values are estimated to be17 MW, 210 MW, 62 MW and 60 MW, 630 MW (597 MW <strong>in</strong> <strong>the</strong> text), 195 MW,respectively. For <strong>the</strong> 10 m/s case <strong>the</strong> calculation with CERBERUS A1.1 shows thatthis fire would not spread to ano<strong>the</strong>r vehicle 8 m or more away from <strong>the</strong> orig<strong>in</strong>alvehicle. These are very extreme results and can be questioned. It should be said that<strong>in</strong> this version <strong>of</strong> CERBERUS, <strong>the</strong> imp<strong>in</strong>gement was not <strong>in</strong>cluded; it has later been<strong>in</strong>cluded <strong>in</strong> <strong>the</strong> fire spread model (see Chapter 4). However, with <strong>the</strong> sizes <strong>of</strong> firesmentioned here, <strong>the</strong> radiation is very high and <strong>the</strong> flames are long and <strong>the</strong> fire shouldspread longer than 8 m. Clearly, <strong>the</strong>re is a need for validation <strong>of</strong> such models.5.3 Backlayer<strong>in</strong>gEven if longitud<strong>in</strong>al flow exists <strong>in</strong> <strong>the</strong> tunnel, a backflow <strong>of</strong> fire gases can travelaga<strong>in</strong>st <strong>the</strong> ventilation flow under certa<strong>in</strong> conditions <strong>of</strong> ventilation flow and heatrelease rate. This phenomenon is called backlayer<strong>in</strong>g and is an important feature <strong>of</strong>tunnel fires s<strong>in</strong>ce it can be important for <strong>the</strong> safety <strong>of</strong> occupants upstream <strong>of</strong> <strong>the</strong> fire.Thomas was <strong>the</strong> first to present a relationship for <strong>the</strong> critical velocity needed toprevent <strong>the</strong> backflow <strong>of</strong> smoke from a fire <strong>in</strong> a tunnel [141]. By compar<strong>in</strong>g buoyancyhead and <strong>the</strong> velocity head he proposed <strong>the</strong> follow<strong>in</strong>g equation:ucr⎛ ⎞⎜gQH &t= k ⎟⎝ cpTρoA ⎠13(5.2)where A is <strong>the</strong> cross-sectional area <strong>of</strong> <strong>the</strong> tunnel, H t is <strong>the</strong> height <strong>of</strong> <strong>the</strong> tunnel and Tis <strong>the</strong> temperature <strong>of</strong> <strong>the</strong> hot layer. The value <strong>of</strong> <strong>the</strong> constant k was not determ<strong>in</strong>edby Thomas, but he assumed that <strong>the</strong> value was <strong>of</strong> <strong>the</strong> order <strong>of</strong> unity. <strong>On</strong>e problem <strong>in</strong>us<strong>in</strong>g Eq. (5.2) is to def<strong>in</strong>e a temperature representative <strong>of</strong> <strong>the</strong> hot layer.Based on <strong>the</strong> work by Thomas, de Ris used <strong>the</strong> dimensionless number, ΔρgH/(ρ 0 u 2 )[142] to def<strong>in</strong>e critical conditions for backflow. Backflow can be avoided if thisexpression is less than one. Orig<strong>in</strong>ally, H is <strong>the</strong> duct height assum<strong>in</strong>g nostratification. In <strong>the</strong> case <strong>of</strong> <strong>the</strong> Runehamar tests, where stratification occurred, if His assumed to be 1 m and <strong>the</strong> density ratio, Δρ /ρ 0 , is assumed to be 0.75, <strong>the</strong> criticalvelocity becomes 2.7 m.Heselden presented an expression (based on work by H<strong>in</strong>kley [143]), similar to <strong>the</strong>one presented by Thomas [141], for <strong>the</strong> velocity <strong>of</strong> <strong>the</strong> smoke layer [14]:ucr⎛= cK⎜⎝ cgQ&⎞slT⎟2ρ To 0W ⎠p13(5.3)47
<strong>On</strong> <strong>the</strong> <strong>Characteristics</strong> <strong>of</strong> <strong>Fires</strong> <strong>in</strong> <strong>Tunnels</strong>where c and K are constants (assumed to be 0.8 and 1, respectively, based on experiments),Q &sland T, are <strong>the</strong> rate <strong>of</strong> flow <strong>of</strong> heat <strong>in</strong> <strong>the</strong> smoke layer and <strong>the</strong> temperature<strong>of</strong> <strong>the</strong> smoke layer, respectively. To prevent backlayer<strong>in</strong>g, <strong>in</strong> pr<strong>in</strong>ciple a ventilationvelocity higher than <strong>the</strong> velocity given by Eq. (5.3) is needed for a horizontal tunnel.For a downhill slop<strong>in</strong>g tunnel a higher velocity is needed.Us<strong>in</strong>g a limit on <strong>the</strong> critical Richardson, Ri, number <strong>of</strong> 4.5, Danziger and Kennedymodelled critical velocities with <strong>the</strong> follow<strong>in</strong>g expression [144]:ucr⎛= ⎜⎝13gQ&4.5⎟ ⎞cHtcpρ0AT ⎠(5.4)Q&cwhere T = + T0ρ c Au0pA similar correlation, but with a different factor, was developed by Saito et al. [41]:ucr⎛1.26⎜gQH &t=⎝ cpρ0AT0⎞⎟⎠13(5.5)The difference between <strong>the</strong> convective HRR and total HRR is not discussed <strong>in</strong> <strong>the</strong>references discussed above. In most cases a reference is made to <strong>the</strong> heat flow <strong>in</strong> <strong>the</strong>hot layer or an explicit equation is given for <strong>the</strong> HRR, but not <strong>in</strong> all cases. In <strong>the</strong>work by Saito et al. <strong>the</strong> calculation <strong>of</strong> <strong>the</strong> HRR is not described, but it can beassumed that it is calculated from <strong>the</strong> mass loss rate.Guelzim et al. developed a computer model, based on conservation equations for apseudo two-dimensional case, to model <strong>the</strong> backlayer<strong>in</strong>g [145]. The model slightlyoverestimates <strong>the</strong> length <strong>of</strong> <strong>the</strong> backlayer when compared with small-scaleexperiments. The agreement is, however, fairly good. Both <strong>the</strong> experiments and <strong>the</strong>model show that <strong>the</strong> backflow length is a strong function <strong>of</strong> <strong>the</strong> air velocity.The expressions discussed above with <strong>the</strong> exponent 1/3 were developed us<strong>in</strong>g dimensionalarguments (Froude number preservation), and are only valid <strong>in</strong> caseswhen <strong>the</strong> flames do not reach <strong>the</strong> ceil<strong>in</strong>g, i.e. for relatively small fires. For caseswhere <strong>the</strong> flame lheights exceed <strong>the</strong> height <strong>of</strong> <strong>the</strong> tunnel, <strong>the</strong> critical velocity has amuch weaker dependence on <strong>the</strong> heat release rate [146]. Oka and Atk<strong>in</strong>son showed,both with experiments and with physical reason<strong>in</strong>g, that <strong>the</strong> critical velocity can betaken as <strong>in</strong>dependent <strong>of</strong> <strong>the</strong> HRR for large fires. They derived a correlation based on<strong>the</strong> non-dimensional HRR (Eq. (4.4) with D represent<strong>in</strong>g <strong>the</strong> height <strong>of</strong> <strong>the</strong> tunnel)and a non-dimensional critical velocity:u =*crucrgHt(5.6)48
5 VentilationThe critical velocity was <strong>the</strong>n represented by two different expressions accord<strong>in</strong>g to:*u cr−1 3 *( 0.124) (&) 1 3= 0.35Q forand*u = 0.35 forcr*Q & > 0.124*Q & < 0.24 (5.7)For <strong>the</strong> Runehamar tests this would mean that for HRR above approximately 12 MW<strong>the</strong> critical velocity is constant and approximately 2.5 m/s. Although Oka andAtk<strong>in</strong>son did not specify whe<strong>the</strong>r <strong>the</strong> total or convective heat release rate was used<strong>in</strong> this analysis, Atk<strong>in</strong>son and Wu <strong>in</strong>dicate that it was <strong>the</strong> convective HRR [147].Oka and Atk<strong>in</strong>son also showed that <strong>the</strong> critical velocity is lower for a fire occupy<strong>in</strong>ga larger proportion <strong>of</strong> <strong>the</strong> width <strong>of</strong> <strong>the</strong> tunnel and is <strong>in</strong>creased by rais<strong>in</strong>g <strong>the</strong> fire(burner <strong>in</strong> <strong>the</strong>ir case) above <strong>the</strong> floor level (closer to <strong>the</strong> ceil<strong>in</strong>g). If <strong>the</strong> spacebeneath <strong>the</strong> fire was blocked, a decrease <strong>in</strong> <strong>the</strong> critical velocity was observed. Thismeans that <strong>the</strong> constant (0.35) can vary for different types <strong>of</strong> set-up (width, levelabove <strong>the</strong> floor, and blockage) and a span from 0.22 to 0.38 was given by Oka andAtk<strong>in</strong>son. If <strong>the</strong> fire is on <strong>the</strong> floor and <strong>the</strong>re is no significant blockage, <strong>the</strong> value <strong>of</strong>*ucr,maxvaries from approximately 0.35 (for a fire much narrower than <strong>the</strong> tunnel) to0.31 (for a fire <strong>of</strong> <strong>the</strong> same width as <strong>the</strong> tunnel) [146]. Also blockages (e.g. vehicles)upstream <strong>of</strong> <strong>the</strong> fire decrease <strong>the</strong> critical velocity [148].A somewhat different approach was taken by Kunsch who used equations for aplume ris<strong>in</strong>g (from a po<strong>in</strong>t source) deflected at <strong>the</strong> ceil<strong>in</strong>g and comb<strong>in</strong>ed this wi<strong>the</strong>quations for <strong>the</strong> back flow and ended up with <strong>the</strong> follow<strong>in</strong>g expressions [149]:*u crwhereu =CC*cr* *2 3( 1−C2C1) ΔT0Q&*1 31+*= C3C1ΔT0Q&(5.8)*2 31+ ΔTQ&ucrgH1−0.1=1+0.1t,( HtW )( HtW )( HtW )( H W )*0⎡ ⎛ Ht ⎞ ⎛ Ht ⎞⎢1+ 0.1⎜⎟ − 0.015⎜⎟⎢⎣⎝ W ⎠ ⎝ W ⎠⎛ H ⎞⎜ −t0.574 1 0.20 ⎟⎝ W ⎠⎤ ⎛ Ht⎥ ≅ 1−0.1⎜⎥⎦⎝ W21,1−0.1=1+0.12,tC3= 0.613 , and⎞⎟⎠*Δ T 0is a dimensionless constant with a value equal to 6.13 and W is <strong>the</strong> width <strong>of</strong> <strong>the</strong>*1 3tunnel. The dimensionless HRR, Q & , is based on <strong>the</strong> height <strong>of</strong> <strong>the</strong> tunnel, H t .The above relationships were, however, derived for horizontal tunnels. For tunnelswith a downhill slope, <strong>the</strong> critical velocity is higher compared to horizontal tunnels49
<strong>On</strong> <strong>the</strong> <strong>Characteristics</strong> <strong>of</strong> <strong>Fires</strong> <strong>in</strong> <strong>Tunnels</strong>(with o<strong>the</strong>r conditions kept <strong>the</strong> same). Atk<strong>in</strong>son and Wu studied <strong>the</strong> effect <strong>of</strong> <strong>the</strong>tunnel slope on <strong>the</strong> critical velocity [147]. The effect <strong>of</strong> <strong>the</strong> slope (for slopes between0º and 10º) on <strong>the</strong> critical velocity found by Atk<strong>in</strong>son and Wu can be expressed as:( ψ ) = ( 0)[ 1+0. 014 ⋅ψ ]u (5.9)cru crwhere u cr (0) is <strong>the</strong> critical velocity for correspond<strong>in</strong>g horizontal tunnel and ψ is <strong>the</strong>slope <strong>of</strong> <strong>the</strong> tunnel expressed <strong>in</strong> degrees. Correspond<strong>in</strong>g expressions based on <strong>the</strong>*maximum non-dimensional critical velocity for a certa<strong>in</strong> type <strong>of</strong> set-up ( ucr,max)<strong>in</strong>clude:ucr*1 3( 0.12) ⋅[ 1+0. ⋅ψ ]*= gH ⋅ u & 014 fortcr, maxQand*u = gH ⋅u⋅ 1+0. 014 ⋅ψ forcrtcr,max[ ]*Q & > 0.12*Q & < 0.12 ( 5.10)(Note that <strong>in</strong> <strong>the</strong> paper by Atk<strong>in</strong>son and Wu <strong>the</strong> denom<strong>in</strong>ator is 1.2 and not 0.12with<strong>in</strong> <strong>the</strong> first paren<strong>the</strong>sis <strong>in</strong> Eq. (5.10). However, <strong>the</strong> denom<strong>in</strong>ator must be 0.12 toexpress a cont<strong>in</strong>uous function).The slope factor suggested by Atk<strong>in</strong>son and Wu is much lower than <strong>the</strong> onepresented by Danziger and Kennedy [144], which can be approximately expressed:cr2( ψ ) u ( 0)[ 1+0.034 ⋅ψ− 0.0011⋅ψ]u (5.11)= crfor ψ 0.20*Q & ≤ 0.20 (5.12)50
5 Ventilationu =*crucrgDH(5.13)and*Q & is also based on D H .With this correlation <strong>the</strong> critical velocity for <strong>the</strong> Runehamar tests becomes constant3.3 m/s above approximately 29 MW (convective). These values were calculated for<strong>the</strong> rock tunnel. If <strong>the</strong> dimensions <strong>of</strong> <strong>the</strong> <strong>in</strong>ner protective tunnel are used <strong>the</strong> constantcritical velocity becomes 3.0 m/s above 18 MW. These values should <strong>the</strong>n be correctedfor <strong>the</strong> slope <strong>of</strong> <strong>the</strong> tunnel (1 %).The Memorial Tunnel Fire Ventilation Test Program (MTFVTP) showed that jetfans are effective <strong>in</strong> controll<strong>in</strong>g <strong>the</strong> direction <strong>of</strong> <strong>the</strong> smoke, even for large fires [48].For a range <strong>in</strong> heat release rates <strong>of</strong> 10 MW to 100 MW, <strong>the</strong> test results suggest thatan air velocity between 2.54 m/s and 2.95 m/s is sufficient to prevent backlayer<strong>in</strong>g.In Figure 5.1 critical velocities accord<strong>in</strong>g to Eq. (5.2) [141], Eq. (5.3) [14], Eq. (5.4)[144], Eq. (5.5) [41], Eq. (5.6) & (5.7) [146], Eq. (5.8) [149] and Eq. (5.12) & (5.13)[150] are presented. As mentioned above it is difficult to def<strong>in</strong>e a temperaturerepresentative for <strong>the</strong> hot layer. In <strong>the</strong> equations suggested by Thomas and Heselden,respectively, <strong>the</strong> same bulk temperature relationship as was given by Danziger andKennedy (see Eq. (5.4)), has been used.There was a 1 % downhill slope at <strong>the</strong> position <strong>of</strong> <strong>the</strong> fire and this was considered bymultiply<strong>in</strong>g <strong>the</strong> results from <strong>the</strong> correlations with a slope factor based on Eq. (5.9). Ithas been assumed that all <strong>the</strong> correlations are based on convective HRR. Forcomparison, <strong>the</strong> correlation by Saito et al. has been calculated also with total HRR.Four experimental values from <strong>the</strong> Runehamar test series are <strong>in</strong>cluded. The HRR andvelocity at <strong>the</strong> time when <strong>the</strong> smoke layer passes <strong>the</strong> position 15 m upstream <strong>of</strong> <strong>the</strong>centre <strong>of</strong> <strong>the</strong> fire set-up is plotted for each test. The scale for <strong>the</strong> HRR <strong>in</strong> <strong>the</strong> graphcorresponds to total HRR. For <strong>the</strong> relationships us<strong>in</strong>g convective HRR, a factor <strong>of</strong>0.7 (correspond<strong>in</strong>g to 30 % radiation heat transfer) has been used <strong>in</strong> <strong>the</strong> calculations.The Runehamar values seem to fall between <strong>the</strong> two horizontal constant values l<strong>in</strong>es.The value, <strong>in</strong>clud<strong>in</strong>g correction for <strong>the</strong> slope, is 2.5 m/s based on <strong>the</strong> work by Okaand Atk<strong>in</strong>son and 3.0-3.1 m/s based on <strong>the</strong> work by Kunsch or Wu and Bakar. Thiscorrelates well with <strong>the</strong> results from <strong>the</strong> Memorial tunnel tests and might alsoconfirm <strong>the</strong> existence <strong>of</strong> a super-critical velocity (an asymptotic value <strong>of</strong> <strong>the</strong> criticalvelocity for high HRR) that has been suggested by several authors. The results from<strong>the</strong> Runehamar tests seem to correlate well with <strong>the</strong>se results. Best correlation seemsto be with <strong>the</strong> relationship suggested by Kunsch. The experimental results cannot,however, be taken as validation s<strong>in</strong>ce <strong>the</strong>re are few data po<strong>in</strong>ts and <strong>the</strong> velocity wasnot systematically varied. <strong>On</strong>e should also keep <strong>in</strong> m<strong>in</strong>d that <strong>the</strong> HRR <strong>in</strong> <strong>the</strong>Runehamar tests were transient and that no real steady state conditions were reached.The effect <strong>of</strong> <strong>the</strong> slope accord<strong>in</strong>g to Eq (5.9) <strong>in</strong> this comparison is relatively small.More <strong>in</strong>formation on <strong>the</strong> time resolved results from <strong>the</strong> temperature measurementsupstream <strong>of</strong> <strong>the</strong> fire are given <strong>in</strong> Paper I.51
<strong>On</strong> <strong>the</strong> <strong>Characteristics</strong> <strong>of</strong> <strong>Fires</strong> <strong>in</strong> <strong>Tunnels</strong>Critical velocity [m/s]12108642Saito et al. (Qtot)Saito et al. (Qconv)ThomasDanziger & KennedyOka & Atk<strong>in</strong>sonT4 T2T3T1Wu & BakarKunschHeseldenRunehamar00 20 40 60 80 100Heat release rate [MW]Figure 5.1 Critical velocities as function <strong>of</strong> total HRR accord<strong>in</strong>g to four differentrelations. The values <strong>of</strong> <strong>the</strong> parameters <strong>in</strong> <strong>the</strong> correlations are based on<strong>the</strong> conditions <strong>in</strong> <strong>the</strong> Runehamar tunnel. All correlations are multipliedwith a slope factor accord<strong>in</strong>g to Eq (5.9).The HRR and velocity at <strong>the</strong>time when <strong>the</strong> smoke reached 15 m upstream <strong>of</strong> <strong>the</strong> fire <strong>in</strong> <strong>the</strong> four Runehamartests are <strong>in</strong>cluded for comparison.The buoyancy factor, B, recognized <strong>in</strong> several <strong>of</strong> <strong>the</strong> equations described above canbe expressed as [151]:1 3⎛ ⎞⎜gQ&cHB = ⎟(5.14)⎝ ρ0cpATo⎠Grant et al. presented <strong>the</strong> function <strong>of</strong> critical velocity for different relationships andexperimental data us<strong>in</strong>g <strong>the</strong> buoyancy factor. The critical velocity <strong>in</strong>creases with<strong>in</strong>creas<strong>in</strong>g tunnel height. The critical velocity is also l<strong>in</strong>early dependent on B for awider range <strong>of</strong> B when <strong>the</strong> height <strong>of</strong> <strong>the</strong> tunnel <strong>in</strong>creases [149].Heselden discusses <strong>the</strong> effect <strong>of</strong> <strong>the</strong> radiation from <strong>the</strong> smoke gases on bare sk<strong>in</strong> for<strong>the</strong> people be<strong>in</strong>g <strong>in</strong>side a tunnel dur<strong>in</strong>g a tunnel fire [14]. He refers to a value <strong>of</strong>2 kW/m 2 be<strong>in</strong>g <strong>the</strong> criterion for caus<strong>in</strong>g unbearable pa<strong>in</strong> after one m<strong>in</strong>ute. He convertedthis <strong>in</strong>to a smoke layer temperature <strong>of</strong> 160 ºC by assum<strong>in</strong>g a blackbody radiatorand a configuration factor <strong>of</strong> 1. Even with <strong>the</strong>se assumption kept <strong>in</strong> m<strong>in</strong>d it illustrates<strong>the</strong> effect <strong>the</strong> temperature <strong>of</strong> <strong>the</strong> smoke layer can have on <strong>the</strong> people <strong>in</strong> <strong>the</strong>tunnel and <strong>the</strong> importance <strong>of</strong> controll<strong>in</strong>g <strong>the</strong> smoke flow. In <strong>the</strong> Runehamar tests,temperatures <strong>of</strong> 200 ºC were reached 40 m upstream <strong>of</strong> <strong>the</strong> fire (see Paper I). Thiswas with a longitud<strong>in</strong>al flow, even if <strong>the</strong> flow was not large enough to preventbacklayer<strong>in</strong>g.52
5 VentilationIn recent years a new term, “conf<strong>in</strong>ement velocity”, has been used [152-154]. While<strong>the</strong> critical velocity is <strong>the</strong> lowest velocity needed upstream <strong>of</strong> <strong>the</strong> fire to prevent <strong>the</strong>existence <strong>of</strong> backlayer<strong>in</strong>g, <strong>the</strong> conf<strong>in</strong>ement velocity is <strong>the</strong> lowest velocity needed tostop an exist<strong>in</strong>g backlayer<strong>in</strong>g at a certa<strong>in</strong> position, i.e. prevent fur<strong>the</strong>r spread<strong>in</strong>g upstream.The reason for us<strong>in</strong>g such a velocity is <strong>the</strong> attempt to control backlayer<strong>in</strong>g at<strong>the</strong> same time as stratification is preserve. The capacity <strong>of</strong> <strong>the</strong> ventilation system isalso an issue. This is <strong>the</strong>refore closely l<strong>in</strong>ked to <strong>the</strong> design <strong>of</strong> ventilation systems.S<strong>in</strong>ce that is not a focal po<strong>in</strong>t <strong>of</strong> this <strong>the</strong>sis, <strong>the</strong> issue is not fur<strong>the</strong>r discussed here.5.4 PulsationsDur<strong>in</strong>g two <strong>of</strong> <strong>the</strong> large-scale fire tests conducted <strong>in</strong> <strong>the</strong> Runehamar tunnel <strong>in</strong>Norway and discussed <strong>in</strong> this <strong>the</strong>sis, regular pulsations were observed dur<strong>in</strong>g <strong>the</strong>most <strong>in</strong>tense part <strong>of</strong> <strong>the</strong> fire (see Paper V and Paper VI). Pulsations with twodifferent periods, 4 s and 18 s, respectively, were observed when <strong>the</strong> HRR washigher <strong>the</strong>n a certa<strong>in</strong> level (between 125 MW and 135 MW). In this section, <strong>the</strong>properties and explanations <strong>of</strong> <strong>the</strong>se pulsations are presented and discussed.However, first some o<strong>the</strong>r pulsation phenomena observed <strong>in</strong> connection withdifferent k<strong>in</strong>ds <strong>of</strong> fires are presented.Pulsat<strong>in</strong>g phenomena can be observed <strong>in</strong> different fire situations. Two <strong>of</strong> <strong>the</strong> morecommon are <strong>the</strong> <strong>in</strong>terplay <strong>of</strong> buoyancy and fluid dynamics result<strong>in</strong>g <strong>in</strong> pulsat<strong>in</strong>gflames (vortex shedd<strong>in</strong>g) sometimes referred to as “puff<strong>in</strong>g”, most obvious <strong>in</strong> connectionwith large pool fires, and <strong>the</strong> “breath<strong>in</strong>g” phenomena that can arise <strong>in</strong> a fire<strong>in</strong> a room or ano<strong>the</strong>r conf<strong>in</strong>ed space when <strong>the</strong> relationship between <strong>the</strong> flow <strong>of</strong> pyrolysisgases and available oxygen is not stable.McCaffrey analysed <strong>the</strong> frequency <strong>of</strong> <strong>the</strong> puff<strong>in</strong>g from a 0.3 m square natural gasburner [155]. He found <strong>the</strong> frequency to be 3 Hz. Later several authors have<strong>in</strong>vestigated, described, and summarized <strong>the</strong> phenomenon [156-159]. Cetegen andAhmed observed puff<strong>in</strong>g also with iso<strong>the</strong>rmal helium plumes, which suggests that<strong>the</strong> puff<strong>in</strong>g phenomenon is associated with <strong>the</strong> <strong>in</strong>stability <strong>of</strong> buoyant flow [156]. Thepuff<strong>in</strong>g frequency seems to be <strong>in</strong>dependent <strong>of</strong> <strong>the</strong> fuel type, but proportional to1 D . The results fur<strong>the</strong>r suggest that <strong>the</strong> frequency <strong>in</strong>creases with <strong>in</strong>creas<strong>in</strong>g fuelvelocity (decreas<strong>in</strong>g Richardson number). This effect seems to become more apparentfor smaller D. The <strong>in</strong>tensity <strong>of</strong> <strong>the</strong> fluctuations appears to be affected by <strong>the</strong> localheat release rate.Weckman and Sobiesak suggest that <strong>the</strong> pulsat<strong>in</strong>g flames from pool fires are a result<strong>of</strong> <strong>in</strong>stabilities <strong>in</strong> <strong>the</strong> fluid dynamics ra<strong>the</strong>r than <strong>the</strong> local availability <strong>of</strong> fuel and air[158]. This is supported by <strong>the</strong> work by Ham<strong>in</strong>s et al. [159]. It does, however, affect<strong>the</strong> entra<strong>in</strong>ment <strong>of</strong> air and mix<strong>in</strong>g <strong>of</strong> air and fuel. The pulsations due to vortex shedd<strong>in</strong>ghas been summarized by Malalssekera [157] and will be fur<strong>the</strong>r discussedbelow.The second feature, breath<strong>in</strong>g, arises when <strong>the</strong> fire <strong>in</strong> an enclosure becomes ventilationcontrolled. There exists a positive pressure <strong>in</strong>side <strong>the</strong> enclosure prevent<strong>in</strong>g airto enter <strong>the</strong> combustion zone. This leads to a decrease <strong>in</strong> <strong>the</strong> combustion rate and <strong>in</strong>53
<strong>On</strong> <strong>the</strong> <strong>Characteristics</strong> <strong>of</strong> <strong>Fires</strong> <strong>in</strong> <strong>Tunnels</strong><strong>the</strong> temperature <strong>in</strong>side <strong>the</strong> enclosure. The follow<strong>in</strong>g decrease <strong>in</strong> relative pressuremakes it possible for fresh air to reach <strong>the</strong> pyrolysis gases result<strong>in</strong>g <strong>in</strong> an <strong>in</strong>crease <strong>in</strong><strong>the</strong> combustion rate aga<strong>in</strong>. This phenomenon was first described by Takeda andAkita [39] and has later been studied by Kim et al. [160]. They showed that <strong>the</strong>oscillation period is a function <strong>of</strong> <strong>the</strong> ventilation factor ( A H ) <strong>in</strong> a region <strong>of</strong>unstable combustion (<strong>the</strong> combustion could not be susta<strong>in</strong>ed). In <strong>the</strong> region <strong>of</strong> stablecombustion, <strong>the</strong> oscillation period was between 1 s and 1.5 s and did not depend on<strong>the</strong> ventilation factor. Utiskul et al. have later shown that <strong>the</strong> limit<strong>in</strong>g oxygen concentrationfor <strong>the</strong> different regions decreases with <strong>in</strong>creas<strong>in</strong>g temperature [161].If a vent is suddenly opened to an oxygen depleted compartment this process can bedramatic and result <strong>in</strong> what is called a backdraft (see e.g. [162, 163]), which can bevery dangerous for fire fighters be<strong>in</strong>g engulfed <strong>in</strong> <strong>the</strong> exit<strong>in</strong>g flames from <strong>the</strong> enclosure,but it can also result <strong>in</strong> <strong>the</strong> mentioned breath<strong>in</strong>g condition with alternat<strong>in</strong>g<strong>in</strong>flow <strong>of</strong> air and outflow <strong>of</strong> combustion gases. The size and position <strong>of</strong> <strong>the</strong> ventilationarea are, naturally, important factors. Breath<strong>in</strong>g was observed <strong>in</strong> some <strong>of</strong> <strong>the</strong>tests <strong>in</strong> <strong>the</strong> ISO 9705 room with reduced open<strong>in</strong>g area with<strong>in</strong> <strong>the</strong> TOXFIRE projecteven if <strong>the</strong> frequencies related to <strong>the</strong> breath<strong>in</strong>g was not evaluated [132].Ano<strong>the</strong>r type <strong>of</strong> pulsation was observed by Prétrel et al. dur<strong>in</strong>g fire experiments <strong>in</strong>conf<strong>in</strong>ed enclosures with forced ventilation [164, 165]. In most <strong>of</strong> <strong>the</strong> tests <strong>the</strong>oscillations (f ≈ 0.1 Hz) seems to start when <strong>the</strong> vessel, <strong>in</strong>side which a pool fire wassituated, reach<strong>in</strong>g a situation <strong>of</strong> oxygen starvation. However, <strong>the</strong>re is also a wellventilatedexample with a long period <strong>of</strong> oscillations <strong>in</strong> <strong>the</strong> pressure (f ≈ 0.2 Hz). Theauthors discussed ma<strong>in</strong>ly two plausible explanations: flame <strong>in</strong>termittency (c.f. <strong>the</strong>case for pool fire above) and Helmoltz resonator. They also discussed <strong>the</strong> phenomenon<strong>of</strong> alternat<strong>in</strong>g combustion conditions <strong>in</strong>side a naturally ventilated compartment(c.f. <strong>the</strong> phenomenon breath<strong>in</strong>g discussed above) where periods <strong>of</strong> high <strong>in</strong>tensitycombustion (result<strong>in</strong>g <strong>in</strong> oxygen depletion) were periodically followed by periods <strong>of</strong>low-<strong>in</strong>tensity combustion (result<strong>in</strong>g <strong>in</strong> fresh air flow<strong>in</strong>g <strong>in</strong>to <strong>the</strong> compartment).Nei<strong>the</strong>r <strong>the</strong>ory fully expla<strong>in</strong>ed <strong>the</strong> observations, and <strong>the</strong>y might be a comb<strong>in</strong>ation <strong>of</strong>factors. The Helmholtz resonator has been used to study <strong>the</strong>rmoacoustic <strong>in</strong>stabilitieswith<strong>in</strong> <strong>the</strong> combustion field [166, 167]. The <strong>the</strong>rmoacoustic <strong>in</strong>stabilities will be <strong>the</strong><strong>the</strong>me <strong>of</strong> <strong>the</strong> rema<strong>in</strong>der <strong>of</strong> this section.Combustion <strong>in</strong>stabilities or pulsat<strong>in</strong>g flames are not new phenomenon. ByronHigg<strong>in</strong>s was <strong>the</strong> first to have noted <strong>the</strong> type <strong>of</strong> combustion <strong>in</strong>stability that usually iscalled a “s<strong>in</strong>g<strong>in</strong>g flame” [168]. The discovery was made <strong>in</strong> 1777, but it was first <strong>in</strong>1802 that he described <strong>the</strong> discovery <strong>in</strong> a letter to Nicholson’s Journal and was laterfur<strong>the</strong>r described by o<strong>the</strong>r authors [169-171]. The first pulsat<strong>in</strong>g flames studied werewith hydrogen and several explanations <strong>in</strong>volved <strong>the</strong> production and condensation <strong>of</strong>water vapour, but Faraday observed this phenomena both under conditions too hotfor <strong>the</strong> condensation <strong>of</strong> water vapour and us<strong>in</strong>g carbon monoxide, which does notform water vapour when burned [172].O<strong>the</strong>r explanations <strong>in</strong>clude repeated detonations, decrease <strong>in</strong> pressure <strong>in</strong> <strong>the</strong> tube dueto <strong>the</strong> draft, and velocities close to <strong>the</strong> critical velocity for <strong>the</strong> transition betweenstreaml<strong>in</strong>e flow and turbulent flow. These latter explanation lead to <strong>the</strong> assumptionthat <strong>the</strong> ma<strong>in</strong>tenance <strong>of</strong> vibrations cannot occur without draft, and <strong>the</strong>refore cannot54
5 Ventilationoccur <strong>in</strong> a horizontal pipe [172]. It has, however, been shown that this is not <strong>the</strong>case. Indeed, draft is not necessary for <strong>the</strong> ma<strong>in</strong>tenance <strong>of</strong> an oscillat<strong>in</strong>g flamealthough it does have an effect [170].The best known explanation <strong>of</strong> <strong>the</strong> observed oscillations was given by LordRayleigh <strong>in</strong> 1878. He stated:“…If heat is given to <strong>the</strong> air at <strong>the</strong> moment <strong>of</strong> greatest condensation, or taken from itat <strong>the</strong> greatest rarefaction, <strong>the</strong> vibration is encouraged. <strong>On</strong> <strong>the</strong> o<strong>the</strong>r hand if heat isgiven at <strong>the</strong> moment <strong>of</strong> greatest rarefaction, or abstracted at <strong>the</strong> moment <strong>of</strong> greatestcondensation, <strong>the</strong> vibration is discouraged…” [173].This is referred to as Rayleigh’s criterion and is still taken as valid today even if it isextended <strong>in</strong> <strong>the</strong> sense that <strong>the</strong> regions <strong>of</strong> oscillation are considerably broader thanthose described by Rayleigh’s criterion [170].The vibrations <strong>in</strong> an air tube can be <strong>in</strong>itiated by some k<strong>in</strong>d <strong>of</strong> disturbance. In <strong>the</strong>laboratory a small puff <strong>of</strong> air may be enough. In <strong>the</strong> large-scale, w<strong>in</strong>d might havethis <strong>in</strong>itiat<strong>in</strong>g effect. Often, <strong>the</strong>re is no obvious external reason for <strong>the</strong> start <strong>of</strong> <strong>the</strong>oscillations [172]. Vortex shedd<strong>in</strong>g can be a reason for <strong>the</strong> production <strong>of</strong> oscillationsand periodic heat release rate (<strong>the</strong> periodic heat release rate observed dur<strong>in</strong>g <strong>the</strong> testspresented <strong>in</strong> this Paper V and VI were, as discussed <strong>in</strong> <strong>the</strong> papers, ma<strong>in</strong>ly related topulsations <strong>in</strong> <strong>the</strong> pressure measurements and not to <strong>the</strong> actual heat release rate). Thevortex shedd<strong>in</strong>g frequency can ei<strong>the</strong>r co<strong>in</strong>cide (approximately) with <strong>the</strong> second naturalmode <strong>of</strong> <strong>the</strong> system or be large enough to force <strong>the</strong> system to follow <strong>the</strong> vortexshedd<strong>in</strong>g frequency or <strong>in</strong>teract with <strong>the</strong> acoustic system <strong>in</strong> such a way that <strong>the</strong> vortexshedd<strong>in</strong>g is forced to atta<strong>in</strong> <strong>the</strong> acoustic frequency [174, 175].The vortex shedd<strong>in</strong>g phenomenon has been widely studied when it comes to poolfires. In <strong>the</strong> review <strong>of</strong> pulsation <strong>of</strong> flames and pool fire performed by Malalasekeraet al. [157], <strong>the</strong> authors give a relationship between <strong>the</strong> Strouhal number, St, and <strong>the</strong>Froude number, Fr, <strong>in</strong> <strong>the</strong> form:Stβ= α ⋅ Fr(5.15)with <strong>the</strong> best fit for many experiments (burner diameter from 0.0074 m to 2.2 m)giv<strong>in</strong>g α = 0.52 and β = -0.505, which means that0.505U ⎡ gD⎤f = 0.52 ⋅⎢ 2D ⎣U⎥(5.16)⎦The <strong>in</strong>fluence <strong>of</strong> <strong>the</strong> fuel velocity, U, is very limited and is <strong>the</strong>refore neglected <strong>in</strong> <strong>the</strong>analyses. Thus, <strong>the</strong> formula becomes similar to <strong>the</strong> one used <strong>in</strong> several cases <strong>in</strong> <strong>the</strong>literature:fb= a ⋅ D(5.17)55
<strong>On</strong> <strong>the</strong> <strong>Characteristics</strong> <strong>of</strong> <strong>Fires</strong> <strong>in</strong> <strong>Tunnels</strong>where <strong>the</strong> best fit for <strong>the</strong> same experiments as above gives a = 1.68 and b = -0.5.These values are similar to those given by McCaffrey (a = 1.6 and b = -0.5) for fireswith diameters between 2 m and 50 m [157]. Beyler presented a summary <strong>of</strong> <strong>the</strong>constant a from many different <strong>in</strong>vestigators and <strong>the</strong> values for <strong>the</strong> constant fallbetween 0.85 and 1.90 [88]. The highest values reported are based on square fireswhere <strong>the</strong> edge length has been used for D. If <strong>the</strong> values presented by Malalasekeraor McCaffrey are used toge<strong>the</strong>r with <strong>the</strong> dimensions <strong>of</strong> <strong>the</strong> set-up <strong>in</strong> <strong>the</strong> Runehamarfire tests, <strong>the</strong> frequency becomes 1 Hz if <strong>the</strong> width (2.6 m) is used and 0.5 Hz if <strong>the</strong>length (10.5 m) <strong>of</strong> <strong>the</strong> HGV mock-up is used. This corresponds to a period between1 and 2 seconds, i.e. somewhat shorter than <strong>the</strong> measured period, but as mentioned itcan still affect <strong>the</strong> oscillations by <strong>in</strong>teract<strong>in</strong>g with <strong>the</strong> acoustic system.Schadow and Gutmark presented a review <strong>of</strong> combustion <strong>in</strong>stabilities related tovortex shedd<strong>in</strong>g <strong>in</strong> dump combustors [176]. They reported that vortex <strong>in</strong>teractionscan occur <strong>in</strong> <strong>the</strong> shear layer <strong>of</strong> a jet and that this can be characterized by a number <strong>of</strong><strong>in</strong>stability frequencies related to different vortex sizes. If a combustor flow is dom<strong>in</strong>atedby vortex flow <strong>in</strong> <strong>the</strong> flamehold<strong>in</strong>g region it can result <strong>in</strong> a periodic heatrelease. The authors concluded that <strong>in</strong> all cases <strong>the</strong> <strong>in</strong>stability was associated with<strong>the</strong> formation <strong>of</strong> large-scale vortices <strong>in</strong> <strong>the</strong> mix<strong>in</strong>g layer. This was coupled with <strong>the</strong>acoustic pressure and excited strong oscillations. The periodic heat release reachesits maximum when <strong>the</strong> vortices brakes down to small scale turbulence.Oscillat<strong>in</strong>g combustion is used <strong>in</strong> modern applications such as pulse combustors, and<strong>the</strong>se have been shown to have advantages <strong>in</strong>clud<strong>in</strong>g high heat transfer rate, highcombustion efficiency and low emissions <strong>of</strong> NO x <strong>in</strong> particular, but also CO [167,174, 177-180]. Oscillations have also been studied as <strong>the</strong>y appear as unwanted<strong>in</strong>stabilities or combustion driven oscillations (CDO). Combustion <strong>in</strong>stabilities canoccur <strong>in</strong> a wide variety <strong>of</strong> combustion system, e.g. residential oil-fired heaters, <strong>in</strong>dustrialburners, blast furnaces, rockets, jet aeroeng<strong>in</strong>es, etc.Theoretical analysis <strong>of</strong> <strong>the</strong>rmoacoustic <strong>in</strong>stability <strong>in</strong> combustion chambers has beenpresented <strong>in</strong> <strong>the</strong> literature by several authors. Culick analysed <strong>the</strong> non-l<strong>in</strong>ear behaviour<strong>of</strong> acoustic waves [181, 182]. His special <strong>in</strong>terests were <strong>the</strong> non-l<strong>in</strong>ear growthand limit<strong>in</strong>g amplitudes <strong>of</strong> <strong>the</strong> waves. He also <strong>in</strong>cluded surface combustion <strong>in</strong> <strong>the</strong>analyses. Comparisons between l<strong>in</strong>ear and nonl<strong>in</strong>ear <strong>the</strong>ories show that <strong>the</strong> l<strong>in</strong>ear<strong>the</strong>ory can describe <strong>the</strong> frequency and <strong>the</strong> mode shape well [183]. To describe <strong>the</strong>amplitude <strong>of</strong> <strong>the</strong> oscillations and to model <strong>the</strong> combustion rate <strong>in</strong> a correct way,nonl<strong>in</strong>ear <strong>the</strong>ory is needed. In premixed combustion stabilized with a flame holder, ithas been shown that significant oscillations <strong>in</strong> <strong>the</strong> heat release rate exist [183-185].These studies all concern premixed combustion. For non-premixed combustion, <strong>the</strong>situation is different and <strong>the</strong> heat release rate is not necessarily unsteady [186]. Theimportance <strong>of</strong> <strong>the</strong> combustion <strong>in</strong> <strong>the</strong> premixed case is also illustrated by <strong>the</strong>existence <strong>of</strong> a critical fuel-air ratio above which self-excited oscillations occur [187].The amplitude <strong>of</strong> <strong>the</strong> pressure oscillation <strong>in</strong>creases with <strong>in</strong>creas<strong>in</strong>g fuel-air ratio(equivalence ratio) [188].<strong>On</strong>e reason for develop<strong>in</strong>g <strong>the</strong> type <strong>of</strong> models mentioned above has been to be ableto control <strong>the</strong> oscillations, due to <strong>the</strong> risk <strong>of</strong> structural damage caused by <strong>the</strong> oscilla-56
5 Ventilationtions, but also to develop clean, quite, efficient, and highly perform<strong>in</strong>g combustors[189-199].<strong>On</strong>e type <strong>of</strong> pulse combustor that can be <strong>of</strong> special <strong>in</strong>terest when compar<strong>in</strong>g with <strong>the</strong>pulsations <strong>in</strong> <strong>the</strong> tunnel is <strong>the</strong> Rijke type pulse combustor or <strong>the</strong> Rijke tube. Rijkefound <strong>in</strong> 1859 that if a piece <strong>of</strong> gauze was placed <strong>in</strong> <strong>the</strong> lower half <strong>of</strong> a wide verticaltube and heated ei<strong>the</strong>r by a Bunsen flame or an electric current, a musical vibrationstarted [200]. In <strong>the</strong> former case <strong>the</strong> sound disappeared after a few m<strong>in</strong>utes, while <strong>in</strong><strong>the</strong> case with <strong>the</strong> current <strong>the</strong> sound could be ma<strong>in</strong>ta<strong>in</strong>ed <strong>in</strong>def<strong>in</strong>itely [168, 171]. Theheat released from <strong>the</strong> gauze generates a periodic pulsation by <strong>the</strong> flow up <strong>in</strong> <strong>the</strong>tube. Rijke found that <strong>the</strong> maximum effect was achieved when <strong>the</strong> gauze was positionedone fourth <strong>of</strong> <strong>the</strong> length <strong>of</strong> <strong>the</strong> tube from its lower end. It is, however, possibleto ma<strong>in</strong>ta<strong>in</strong> oscillations also at o<strong>the</strong>r positions depend<strong>in</strong>g on <strong>the</strong> size <strong>of</strong> <strong>the</strong> flame[172]. Small flames must be <strong>in</strong>serted fur<strong>the</strong>r than larger flames, <strong>in</strong>to an air tubebefore <strong>the</strong>y oscillate. The position and <strong>the</strong> size <strong>of</strong> <strong>the</strong> flame affects <strong>the</strong> pitch <strong>of</strong> <strong>the</strong>flame, and <strong>the</strong> pitches rise when <strong>the</strong> flame is moved fur<strong>the</strong>r up/<strong>in</strong>to <strong>the</strong> air tube [170,172]. It has also been found that <strong>the</strong> frequency <strong>of</strong> <strong>the</strong> fundamental and <strong>the</strong> firstharmonic can exist on <strong>the</strong> same time. Small flames have, on <strong>the</strong>se occasions, beenobserved between <strong>the</strong> larger flames [170]. The physics <strong>of</strong> <strong>the</strong> Rijke tube has beenanalysed and described, both experimentally and <strong>the</strong>oretically, by several authors <strong>in</strong><strong>the</strong> literature [201-213].Thermoacoustic <strong>in</strong>stabilities <strong>in</strong> relation to distributed combustion (still premixed)was presented by F<strong>in</strong>l<strong>in</strong>son et al. [214], who used a modified Rijke burner to study<strong>the</strong> effect <strong>of</strong> frequency, flame position, tube length, <strong>in</strong>let gas composition, andenergy balance on <strong>the</strong> acoustic growth rate. The temperature proved to be importantand <strong>the</strong> acoustic driv<strong>in</strong>g forces depended on <strong>the</strong> acoustic mode shapes <strong>in</strong> relation to<strong>the</strong> flame and distribution <strong>of</strong> energy.The mentioned phenomena are usually called <strong>the</strong>rmoacoustic <strong>in</strong>stabilities. Thepulsations dur<strong>in</strong>g <strong>the</strong> Runehamar tests were not acoustic <strong>in</strong> that sense that <strong>the</strong>y wereaudible (<strong>the</strong> oscillation periods were too long). The excitation and behaviour <strong>of</strong> <strong>the</strong>oscillations seem, however, to be very similar and <strong>the</strong>refore it can be <strong>of</strong> <strong>in</strong>terest tostudy <strong>the</strong>se <strong>the</strong>rmoacoustic <strong>in</strong>stabilities <strong>in</strong> more detail.Matveev presented a thorough analysis <strong>of</strong> <strong>the</strong> <strong>the</strong>rmoacoustic <strong>in</strong>stabilities <strong>in</strong> <strong>the</strong>Rijke tube, both experimentally and <strong>the</strong>oretically [215]. He showed <strong>the</strong> importance<strong>of</strong> <strong>the</strong> characteristics <strong>of</strong> <strong>the</strong> heat transfer from a heat source to <strong>the</strong> flow. The positionfor <strong>the</strong> heat source most favourable for excit<strong>in</strong>g <strong>the</strong> <strong>the</strong>rmoacoustic <strong>in</strong>stability is nearone fourth <strong>of</strong> <strong>the</strong> tube length from <strong>the</strong> upstream end <strong>of</strong> <strong>the</strong> tube. Actually, to excite<strong>the</strong> first acoustic mode, <strong>the</strong> heat source needs to be somewhere <strong>in</strong> <strong>the</strong> upstream half<strong>of</strong> <strong>the</strong> tube. Most studies on <strong>the</strong> Rijke tube are related to <strong>the</strong> first mode and <strong>the</strong> vastmajority <strong>of</strong> <strong>the</strong> studies have been performed with <strong>the</strong> heat source one fourth <strong>of</strong> <strong>the</strong>length <strong>of</strong> <strong>the</strong> tube, from <strong>the</strong> upstream end. However, even higher acoustic modes canbe excited, but <strong>the</strong>n <strong>the</strong> favourable regions for <strong>the</strong> heat source are different. Theenergy levels needed to excite <strong>the</strong> higher modes are also higher than for <strong>the</strong>fundamental mode.The ma<strong>in</strong> reason for <strong>the</strong> <strong>the</strong>rmoacoustic <strong>in</strong>stability is a component <strong>of</strong> <strong>the</strong> heat releasethat oscillates <strong>in</strong> phase with <strong>the</strong> pressure perturbation (c.f. <strong>the</strong> Rayleigh’s criterion57
<strong>On</strong> <strong>the</strong> <strong>Characteristics</strong> <strong>of</strong> <strong>Fires</strong> <strong>in</strong> <strong>Tunnels</strong>above), i.e. a phase difference less than 90º. S<strong>in</strong>ce <strong>the</strong> heat transfer rate for severalscenarios has been shown to be a function <strong>of</strong> <strong>the</strong> velocity perturbations, with a certa<strong>in</strong>time delay due to <strong>the</strong> <strong>in</strong>ertia <strong>in</strong> <strong>the</strong> heat transfer process, it is possible for asituation to occur where <strong>the</strong> Rayleigh’s criterion is fulfilled, i.e.:∫τp ′() t Q&′() t dt > 0(5.18)The stability <strong>of</strong> a specific excitation mode is determ<strong>in</strong>ed by <strong>the</strong> net difference between<strong>the</strong> energy <strong>in</strong>put to <strong>the</strong> mode and <strong>the</strong> acoustic losses. An important part <strong>of</strong> <strong>the</strong>process is <strong>the</strong> energy transfer to <strong>the</strong> flow, which can be described by a heat transferfunction, Tr:() t u () tQ & ′ ′= TrQ&u(5.19)The absolute value, Tr , and <strong>the</strong> phase, ϕ, <strong>of</strong> <strong>the</strong> energy transfer function are <strong>of</strong> special<strong>in</strong>terest and are discussed fur<strong>the</strong>r below.The form <strong>of</strong> <strong>the</strong> heat transfer functions depends on <strong>the</strong> system studied. Dowl<strong>in</strong>g presenteda heat transfer function for a case <strong>of</strong> premixed combustion beh<strong>in</strong>d a bluffbodyflame holder [183], based on a work by Bloxsidge et al. [185]:1 ϖτe1+iϖτ−i2Tr =(5.20)where11= 2πr B( 1−α) u , τ2∝ ( L − b) uτ, r B is <strong>the</strong> radius <strong>of</strong> <strong>the</strong> flame holder, α is <strong>the</strong>blockage ratio <strong>of</strong> <strong>the</strong> flame holder, L is <strong>the</strong> length <strong>of</strong> duct, and b is <strong>the</strong> distancebetween <strong>the</strong> choked <strong>in</strong>let and <strong>the</strong> flame holder. This relationship seemed to give toohigh amplitudes at high frequencies and <strong>the</strong>refore <strong>the</strong> follow<strong>in</strong>g equation was developed[183]:1 ϖτe−i2Tr =(5.21)( 1+iϖτ1)( 1+iϖτ3)where1= 5r B( 1−α) u , τ2= 0. 4( L − b) u , and τ = r B( 1−α) uτ1. A non-l<strong>in</strong>ear <strong>the</strong>ory canestimate <strong>the</strong> limit cycle, amplitudes and spectra. The non-l<strong>in</strong>earities arise due to <strong>the</strong>relationship between <strong>the</strong> heat release rate and velocity fluctuations at <strong>the</strong> flameholder. The authors noticed that if <strong>the</strong> fuel-air ratio was <strong>in</strong>creased, <strong>the</strong> damp<strong>in</strong>g factordecreased, <strong>the</strong> flame became less stable, and <strong>the</strong> amplitude gradually <strong>in</strong>creased.Dowl<strong>in</strong>g later developed this model and gave expressions for τ 1 and τ 3 as functions<strong>of</strong> <strong>the</strong> radius <strong>of</strong> <strong>the</strong> flame holder, <strong>the</strong> radius <strong>of</strong> <strong>the</strong> tube, <strong>the</strong> flame speed, and <strong>the</strong> gasflow velocity [187]. The time delays <strong>in</strong>volved <strong>in</strong> <strong>the</strong>rmoacoustic <strong>in</strong>stabilities can be58
5 Ventilationassociated with different factors, e.g. <strong>the</strong> convection time for <strong>the</strong> fuel to reach <strong>the</strong>flame zone, combustion k<strong>in</strong>etics, turbulent mix<strong>in</strong>g, and <strong>the</strong> <strong>in</strong>ertia <strong>of</strong> <strong>the</strong> combustor[216].The structure <strong>of</strong> <strong>the</strong> transfer functions are similar to <strong>the</strong> functions arrived at <strong>in</strong>automatic control eng<strong>in</strong>eer<strong>in</strong>g and <strong>the</strong> problem and systems can be represented bydifferent parts connected by loops (see Figure 5.2). This has been used <strong>in</strong> efforts tocontrol <strong>the</strong> oscillations [190, 191].+∑u′ Q′ &Heat releasedynamicsAcousticsFigure 5.2 Schematic <strong>of</strong> a feedback loop representation <strong>of</strong> <strong>the</strong> <strong>the</strong>rmoacoustic<strong>in</strong>stability <strong>in</strong> a (premixed) combustion system (after Fleifil et al. [191]).None <strong>of</strong> <strong>the</strong> heat transfer functions described above corresponds to a systemrepresentative <strong>of</strong> <strong>the</strong> tunnel fire situation; ei<strong>the</strong>r <strong>the</strong> geometry or <strong>the</strong> heat releaseprocess (or both) differ <strong>in</strong> a significant way. However, all <strong>of</strong> <strong>the</strong> transfer functions<strong>in</strong>clude <strong>the</strong> velocity, <strong>in</strong>dicat<strong>in</strong>g that <strong>the</strong> convective heat transfer is an important part.<strong>On</strong>e explanation can be that <strong>the</strong> fractional change <strong>in</strong> velocity is much larger than <strong>the</strong>fractional change <strong>in</strong> pressure and temperature. This expla<strong>in</strong>s <strong>the</strong> dependence on <strong>the</strong>mass flow rate (see Figure 5.3)S<strong>in</strong>ce <strong>the</strong> ventilation <strong>in</strong> <strong>the</strong> Runehamar tests was not varied (except for <strong>the</strong> decrease<strong>in</strong> velocity dur<strong>in</strong>g <strong>the</strong> most <strong>in</strong>tense part <strong>of</strong> <strong>the</strong> fire), no heat transfer function hasbeen developed for <strong>the</strong> tunnel case; but this could be an important area <strong>of</strong> research <strong>in</strong><strong>the</strong> future. It is, however, recognized that <strong>the</strong> ra<strong>the</strong>r constant level <strong>of</strong> heat release rateneeded to start <strong>the</strong> oscillation <strong>in</strong> <strong>the</strong> Runehamar tests (see Paper V and Paper VI), is<strong>in</strong> accordance with <strong>the</strong> behaviour suggested by <strong>the</strong> heat transfer functions, i.e., <strong>the</strong>transferred energy needs to overcome <strong>the</strong> acoustic losses (radiation at <strong>the</strong> tube endsand losses at <strong>the</strong> walls).59
<strong>On</strong> <strong>the</strong> <strong>Characteristics</strong> <strong>of</strong> <strong>Fires</strong> <strong>in</strong> <strong>Tunnels</strong>Power (e.g. HRR)UnstableStableMass flow rateFigure 5.3 Example <strong>of</strong> stability limit (after Matveev [215]).In Figure 5.3 an example <strong>of</strong> a stability limit is given. The stability limit <strong>in</strong>dicates <strong>in</strong>what region <strong>of</strong> mass flow rate and power (<strong>in</strong> <strong>the</strong> power-mass flow rate graph), <strong>the</strong>system becomes unstable. As can be seen <strong>in</strong> <strong>the</strong> figure, <strong>in</strong> this example (heated wire<strong>in</strong> an air flow <strong>in</strong> a Rijke tube) <strong>the</strong>re is a lower and an upper limit outside which <strong>the</strong>system always seems to be stable, <strong>in</strong>dependent <strong>of</strong> <strong>the</strong> power. Qualitatively <strong>the</strong> lowerlimit has been expla<strong>in</strong>ed <strong>in</strong> that oscillations have not been observed for flow rateslower than what is necessary to ma<strong>in</strong>ta<strong>in</strong> a turbulent air flow <strong>in</strong> <strong>the</strong> tube [201].The figure should be seen as an example <strong>of</strong> <strong>the</strong> shape <strong>of</strong> <strong>the</strong> stability limit andMatveev showed that <strong>the</strong> shape depends on <strong>the</strong> position <strong>of</strong> <strong>the</strong> heat source <strong>in</strong> <strong>the</strong>tube, which affects which mode is excited. Fur<strong>the</strong>rmore, higher power is needed toexcite higher harmonics. This can be expla<strong>in</strong>ed by <strong>the</strong> heat transfer function. In <strong>the</strong>function used by Matveev, developed for flow around a heated wire and describedby Kwon and Lee [205], <strong>the</strong> function is zero when <strong>the</strong> mean flow rate is zero and forhigher mean flow rates <strong>the</strong> phase shift is such that <strong>the</strong> <strong>the</strong>rmoacoustic <strong>in</strong>stability isnot encouraged. This gives rise to curves <strong>of</strong> <strong>the</strong> shape presented <strong>in</strong> Figure 5.3. Similarly,<strong>the</strong> transfer function given by Kwon and Lee is dependent on <strong>the</strong> frequency.Therefore, <strong>the</strong> heat transfer function has different values for <strong>the</strong> different modes.Consider<strong>in</strong>g both <strong>the</strong> <strong>the</strong>rmoacoustic energy added to a certa<strong>in</strong> mode, n, and <strong>the</strong>acoustic losses (sound radiation from <strong>the</strong> open ends and losses due to <strong>the</strong> acousticboundary layer), a value for <strong>the</strong> critical power needed for transition to <strong>in</strong>stability canbe calculated [215, 217]:60
5 Ventilationcr,n2 2( πcPLϖn( ν + ( γ −1)α ) + 2ϖnA )2( γ −1) π Tr As<strong>in</strong>( ϕ ) s<strong>in</strong>( 2kx )mQ& = &(5.22)nnnhwhere c is <strong>the</strong> speed <strong>of</strong> sound, P is <strong>the</strong> perimeter <strong>of</strong> <strong>the</strong> cross section, L is <strong>the</strong> length<strong>of</strong> <strong>the</strong> tube, ν is <strong>the</strong> k<strong>in</strong>ematic viscosity, α is <strong>the</strong> <strong>the</strong>rmal diffusivity, A is <strong>the</strong> crosssectionalarea, γ is <strong>the</strong> specific heat ratio, k n =ω n /c is <strong>the</strong> wave number, and x h is <strong>the</strong>position <strong>of</strong> <strong>the</strong> heat source (measured from <strong>the</strong> tube <strong>in</strong>let). The phase shift, ϕ n , is lessthan π/2 and <strong>the</strong>refore <strong>the</strong> sign <strong>of</strong> <strong>the</strong> expression is def<strong>in</strong>ed by s<strong>in</strong>(2k n x h ) and this<strong>the</strong>reby def<strong>in</strong>es <strong>the</strong> regions where <strong>in</strong>stability is favoured. In Figure 5.4, <strong>the</strong> regionsfor heat addition favourable for <strong>the</strong> first three acoustic modes are shown.Mode1PressureDisplacement230 200 400 600 800 1000 1200 1400 1600 mFigure 5.4 The figures represent <strong>the</strong> amplitude for <strong>the</strong> first three modes <strong>of</strong>oscillations <strong>in</strong> a tube (<strong>the</strong> top one is <strong>the</strong> fundamental). The length scale<strong>of</strong> <strong>the</strong> Runehamar tunnel is <strong>in</strong>cluded for comparison. The vertical dashedl<strong>in</strong>e (F) represents <strong>the</strong> position <strong>of</strong> <strong>the</strong> centre <strong>of</strong> <strong>the</strong> fire dur<strong>in</strong>g <strong>the</strong> tests <strong>in</strong><strong>the</strong> Runehamar tunnel. The shadowed areas <strong>in</strong>dicate regions favourablefor <strong>in</strong>stability for each mode.FThere are a number <strong>of</strong> factors and conditions <strong>in</strong> <strong>the</strong> Runehamar tests that differ from<strong>the</strong> orig<strong>in</strong>al conditions for which Equation (5.22) was developed. The ma<strong>in</strong> differrencesare <strong>the</strong> different mechanism <strong>of</strong> heat release (<strong>in</strong>tense fire compared tocontrolled electrical heat<strong>in</strong>g), <strong>the</strong> distributed area <strong>of</strong> heat release rate, nonuniformitiesover <strong>the</strong> cross-sectional area (regard<strong>in</strong>g <strong>the</strong> temperature, heat release,and <strong>the</strong> geometrical obstruction <strong>of</strong> <strong>the</strong> flow), backlayer<strong>in</strong>g result<strong>in</strong>g <strong>in</strong> upstreamheat<strong>in</strong>g <strong>of</strong> <strong>the</strong> gases, <strong>the</strong> tunnel not be<strong>in</strong>g a smooth, straight, and horizontal pipe, etc.Several <strong>of</strong> <strong>the</strong>se conditions also vary with time s<strong>in</strong>ce <strong>the</strong> fuel is consumed and both<strong>the</strong> mass and <strong>the</strong> volume <strong>of</strong> <strong>the</strong> set-up decrease with time. It is still, however,<strong>in</strong>terest<strong>in</strong>g to compare <strong>the</strong> conclusions drawn from Eq. (5.22) with <strong>the</strong> results <strong>in</strong> <strong>the</strong>Runehamar tests, presented <strong>in</strong> Paper V and VI.In <strong>the</strong> first two fire tests, T1 and T2, a pulsation <strong>in</strong>side <strong>the</strong> tunnel was experienceddur<strong>in</strong>g a time period when <strong>the</strong> HRR was higher than approximately 125-135 MW61
<strong>On</strong> <strong>the</strong> <strong>Characteristics</strong> <strong>of</strong> <strong>Fires</strong> <strong>in</strong> <strong>Tunnels</strong>(see Paper V). This created a pulsat<strong>in</strong>g flow situation at <strong>the</strong> measur<strong>in</strong>g station, where<strong>the</strong> measurements showed that <strong>the</strong> maximum velocity was pulsat<strong>in</strong>g <strong>in</strong> <strong>the</strong> range <strong>of</strong>3 m/s to 4.2 m/s down to a m<strong>in</strong>imum <strong>in</strong> <strong>the</strong> range <strong>of</strong> 1.5 m/s to 3 m/s.The periods <strong>of</strong> <strong>the</strong> different pulsations dur<strong>in</strong>g <strong>the</strong> fire tests are summarized <strong>in</strong> Table5.3. For <strong>the</strong> upstream measurements dur<strong>in</strong>g T1 and both upstream and downstreammeasurements dur<strong>in</strong>g T2, one can notice a short oscillation period between 4 and 5seconds (median very close to 4 s) and a longer period around 18 s.Table 5.3 Periods <strong>of</strong> <strong>the</strong> oscillations registered dur<strong>in</strong>g T1 and T2 <strong>in</strong> <strong>the</strong> Runehamartunnel.Oscillation a Average period [s] Median period [s]T1 upstream short 4.84 4.02T1 upstream long 18.33 18.06T1 downstream b - -T2 upstream short 4.47 4.08T2 upstream long 17.72 17.64T2 downstream short 4.49 4.08T2 downstream long 17.57 17.4a Observe that <strong>the</strong> period <strong>of</strong> <strong>the</strong> long oscillations is measured from one maximum to<strong>the</strong> next and is actually half <strong>the</strong> modulation period (see Paper V).b The sampl<strong>in</strong>g period was longer <strong>in</strong> this case and is <strong>the</strong>refore left out <strong>of</strong> <strong>the</strong>analyses.Two different methods have been used to expla<strong>in</strong> <strong>the</strong> observed periods <strong>of</strong> oscillations:an acoustic approach (see Paper V) and a frequency analysis based on animpedance approach (see Paper VI).In <strong>the</strong> acoustic approach <strong>the</strong> shorter oscillation period was shown to be close to <strong>the</strong>first two harmonics (4.74 and 3.16, respectively) <strong>of</strong> a tube <strong>of</strong> <strong>the</strong> same length as <strong>the</strong>tunnel. The longer period was expla<strong>in</strong>ed as a beat phenomenon. Us<strong>in</strong>g <strong>the</strong> periods <strong>of</strong><strong>the</strong> second and <strong>the</strong> third mode (4.75 s and 3.16 s, respectively) would give T = 3.8 sand T b = 9.4 s. The average period is close to <strong>the</strong> observed one, while <strong>the</strong> period <strong>of</strong><strong>the</strong> beat is fur<strong>the</strong>r away. However, a small change <strong>in</strong> <strong>the</strong> orig<strong>in</strong>al waves can give asignificant change <strong>in</strong> <strong>the</strong> result<strong>in</strong>g period due to <strong>the</strong> difference <strong>in</strong> <strong>the</strong> denom<strong>in</strong>ator. If<strong>the</strong> observed periods are assumed to be T = 4 s and T b = 18 s, <strong>the</strong>n one can calculate<strong>the</strong> periods <strong>of</strong> <strong>the</strong> orig<strong>in</strong>al waves to be 4.5 s and 3.6 s, respectively. Also <strong>the</strong> characteristics<strong>of</strong> <strong>the</strong> time resolved signal <strong>in</strong>dicated a beat phenomenon. The details aregiven <strong>in</strong> Paper V.In order to obta<strong>in</strong> more detailed <strong>in</strong>formation about <strong>the</strong> phenomenon, a frequencyresponse analysis <strong>of</strong> a tunnel system, represented by impedances, has been performed.The different parts <strong>of</strong> <strong>the</strong> tunnel were assigned impedances and equationsdeveloped for unsteady flow were used to study <strong>the</strong> tunnel as a system <strong>in</strong> more detailthan was done <strong>in</strong> <strong>the</strong> acoustic analysis. The equations are used toge<strong>the</strong>r with afrequency response analysis where it is assumed that a forced vibration takes place<strong>in</strong> <strong>the</strong> tunnel, even if <strong>the</strong> excitation source <strong>of</strong> <strong>the</strong> vibration is unknown. The analysisfollows <strong>the</strong> impedance approach described by Wylie and Streeter [218]. Three differ-62
5 Ventilationrent cases were analysed: I) constant <strong>in</strong>let pressure and small disturbance at <strong>the</strong> fire;II) constant outlet pressure and small disturbance at <strong>the</strong> fire; and III) constant <strong>in</strong>letpressure and small disturbance at <strong>the</strong> outlet. All cases showed resonance peaks, withdifferent periods for <strong>the</strong> different cases. Most similar to <strong>the</strong> experimental resultswere <strong>the</strong> cases with constant pressure at <strong>the</strong> <strong>in</strong>let. The case with disturbance at <strong>the</strong>tunnel outlet gave results very close to those registered dur<strong>in</strong>g <strong>the</strong> fire tests (seePaper VI).The oscillations start when <strong>the</strong> heat release rate <strong>in</strong>creases above a certa<strong>in</strong> value(between 125 and 135 MW). This situation has not been modelled quantitatively, butis similar to <strong>the</strong> condition shown <strong>in</strong> Figure 5.3 with a stability limit dependent on <strong>the</strong>heat release rate (heat transfer rate) and <strong>the</strong> mass flow rate. This supports <strong>the</strong> suggestionthat <strong>the</strong> pulsations can be regarded as <strong>the</strong>rmoacoustic <strong>in</strong>stabilities. This can beexpla<strong>in</strong>ed also by Figure 5.4 where it can be seen that <strong>the</strong> seat <strong>of</strong> <strong>the</strong> fire was almost<strong>in</strong> <strong>the</strong> centre <strong>of</strong> <strong>the</strong> region favourable for excitation <strong>of</strong> <strong>the</strong> second mode <strong>of</strong> oscillation.The seat <strong>of</strong> <strong>the</strong> fire was also close to <strong>the</strong> region favourable for excitation <strong>of</strong> <strong>the</strong>third mode <strong>of</strong> oscillation. Keep<strong>in</strong>g <strong>in</strong> m<strong>in</strong>d <strong>the</strong> long flames and extended region <strong>of</strong>combustion it could be possible to make <strong>the</strong> third mode unstable.The frequency <strong>of</strong> <strong>the</strong> oscillation can be affected if <strong>the</strong> heat <strong>in</strong>put is distributed over aregion and cannot be considered to be concentrated [186]. However, this effect is notsignificant if <strong>the</strong> flow rate or <strong>the</strong> mean temperature ratios (between temperature afterand before heat <strong>in</strong>put) is low.The temperatures along <strong>the</strong> tunnel were measured dur<strong>in</strong>g <strong>the</strong> tests and a model <strong>of</strong> <strong>the</strong>distribution <strong>of</strong> <strong>the</strong> average temperature over a cross-section along <strong>the</strong> tunnel hasbeen presented (Paper VII). More temperature measurements would, however, beneeded near <strong>the</strong> fire to fully describe <strong>the</strong> conditions <strong>the</strong>re. The assumption <strong>of</strong>uniform conditions over <strong>the</strong> cross-section is not valid. The parameter most difficultto derive is, however, <strong>the</strong> transfer function for heat <strong>in</strong> <strong>the</strong> system. This is a complexfunction <strong>of</strong> <strong>the</strong> velocity and frequency, and <strong>in</strong>cludes <strong>in</strong>formation on <strong>the</strong> <strong>the</strong>rmal<strong>in</strong>ertia and <strong>the</strong>refore <strong>the</strong> <strong>in</strong>formation on <strong>the</strong> amplitude and phase needed to determ<strong>in</strong>e<strong>the</strong> stability boundaries <strong>of</strong> <strong>the</strong> system when different parameters are varied, e.g. <strong>the</strong>mass flow rate. Despite this, it is believed that <strong>the</strong> results and discussion presented <strong>in</strong>this section provide <strong>in</strong>sight <strong>in</strong>to <strong>the</strong> pulsations and important factors controll<strong>in</strong>g<strong>the</strong>m.63
<strong>On</strong> <strong>the</strong> <strong>Characteristics</strong> <strong>of</strong> <strong>Fires</strong> <strong>in</strong> <strong>Tunnels</strong>64
6 Gas concentrations <strong>in</strong> <strong>the</strong> tunnel6 Gas concentrations <strong>in</strong> <strong>the</strong> tunnelThe reason for fatalities <strong>in</strong> fires is most <strong>of</strong>ten due to <strong>in</strong>halation <strong>of</strong> fire gases. In several<strong>of</strong> <strong>the</strong> catastrophic fires presented <strong>in</strong> Table 2.1, people were found dead <strong>in</strong> <strong>the</strong>ircars. Increased temperature can, however, affect both <strong>the</strong> physical health and <strong>the</strong> capacityto escape. Among <strong>the</strong> fire effluents, carbon monoxide (CO) is seen to be <strong>the</strong>most important component responsible for caus<strong>in</strong>g fatalities, even if <strong>the</strong> effect <strong>of</strong>hydrogen cyanide (HCN) has been much discussed dur<strong>in</strong>g recent years [219-222]. Ina comprehensive review, Nelson showed that even if high blood concentrations <strong>of</strong>HCN were found <strong>in</strong> fire victims, most fatalities can be expla<strong>in</strong>ed by <strong>the</strong> COconcentration [223]. Therefore, <strong>the</strong> <strong>in</strong>fluence <strong>of</strong> ventilation <strong>in</strong> Section 6.2 will focuson CO and <strong>the</strong> CO/CO 2 ratio. In Section 6.3, however, HCN will be <strong>in</strong>cluded <strong>in</strong> <strong>the</strong>analyses. Fur<strong>the</strong>rmore, carbon dioxide (CO 2 ) has an important affect, both by be<strong>in</strong>gtoxic at high levels, but mostly by <strong>in</strong>creas<strong>in</strong>g <strong>the</strong> uptake <strong>of</strong> o<strong>the</strong>r fire gases, e.g. CO,due to <strong>in</strong>creas<strong>in</strong>g <strong>the</strong> breath<strong>in</strong>g rate. This is also discussed <strong>in</strong> Section 6.3.Even if fire gases do not always lead to fatalities, sublethal effects, e.g. <strong>in</strong>capacitation,reduced egress speed, reduced motor capability, decreased mental acuity, andvisual obscuration are also important [224]. Fur<strong>the</strong>r, many effluents can cause longtermor chronic effects, which is <strong>of</strong> particular importance for fire fighters and rescuepersonal.In <strong>the</strong> design <strong>of</strong> tunnel ventilation, even <strong>the</strong> ventilation <strong>of</strong> gases (e.g. CO) <strong>in</strong> a nonfiresituation is an important issue. For a description <strong>of</strong> <strong>the</strong> procedure see forexample reference [144].Ano<strong>the</strong>r issue becom<strong>in</strong>g <strong>in</strong>creas<strong>in</strong>gly important <strong>in</strong> <strong>the</strong> context <strong>of</strong> fire emissions is <strong>the</strong>effect on <strong>the</strong> environment and emissions which may pose potentially long-term hazardsto health. Some <strong>of</strong> <strong>the</strong>se issues will be discussed <strong>in</strong> Section 6.1 even if <strong>the</strong>yhave not typically been considered to be central issues for fires <strong>in</strong> tunnels.6.1 Emissions from firesThere are a number <strong>of</strong> reports and papers on <strong>the</strong> issue <strong>of</strong> fires and <strong>the</strong> environment.Some <strong>of</strong> <strong>the</strong>m present summaries <strong>of</strong> emissions from common materials or types <strong>of</strong>fires [225-227], while o<strong>the</strong>rs focus on emissions from fires <strong>in</strong> a more general senseor present results from s<strong>in</strong>gle fires that have had a large impact on <strong>the</strong> environment[228-230].The analysis <strong>of</strong> <strong>the</strong> smoke gases from an automobile fire showed that emissions witha potentially negative impact on <strong>the</strong> environment, or humans, are produced <strong>in</strong> significantconcentrations (see Paper IV). Three separate, full scale fire tests were performedunder SP’s <strong>in</strong>dustry calorimeter: a fire ignited and developed <strong>in</strong> <strong>the</strong> eng<strong>in</strong>ecompartment; a fire ignited <strong>in</strong>side <strong>the</strong> vehicle that was ext<strong>in</strong>guished <strong>in</strong> <strong>the</strong> earlystages; and a similar fire ignited <strong>in</strong>side <strong>the</strong> vehicle that was allowed to spread until<strong>the</strong> entire vehicle was <strong>in</strong>volved <strong>in</strong> <strong>the</strong> fire. Both fire gases and run-<strong>of</strong>f water wereanalysed.65
<strong>On</strong> <strong>the</strong> <strong>Characteristics</strong> <strong>of</strong> <strong>Fires</strong> <strong>in</strong> <strong>Tunnels</strong>The emissions <strong>in</strong>cluded HCl, SO 2 , VOCs (e.g. benzene), PAHs, and PCDDs/PCDFs.Sources <strong>of</strong> chlor<strong>in</strong>e <strong>in</strong> <strong>the</strong> vehicle for production <strong>of</strong> HCl and PCDDs/PCDFs <strong>in</strong>cluded,most probably: upholster<strong>in</strong>g materials, dash board components and electricalwir<strong>in</strong>gs, as <strong>in</strong>dicated from <strong>the</strong> small-scale experiments conducted on selected materialsfrom an automobile similar to that used for <strong>the</strong> full scale automobile fire.Aldehydes and isocyanates were also found <strong>in</strong> <strong>the</strong> smoke gases, both compoundswith well-documented short-term and long-term effects on humans. O<strong>the</strong>r toxiccompounds <strong>in</strong>cluded: HCN and SO 2 . These compounds have a direct effect onpeople and are <strong>of</strong> concern for rescue personal and o<strong>the</strong>rs exposed to smoke fromvehicle fires. The health effects, especially time to <strong>in</strong>capacitat<strong>in</strong>g dose for some <strong>of</strong><strong>the</strong> gases, are fur<strong>the</strong>r discussed <strong>in</strong> Section 6.3.The particles emitted from <strong>the</strong> fire had a particle size distribution with a highnumber <strong>of</strong> particles with a diameter below 1 μm. Such small particles can betransported far from <strong>the</strong> location <strong>of</strong> <strong>the</strong> fire and are respirable, imply<strong>in</strong>g that <strong>the</strong>bodies defence system aga<strong>in</strong>st particles (<strong>in</strong> <strong>the</strong> nose and throat) cannot provideadequate protection. Analysis <strong>of</strong> <strong>the</strong> content <strong>of</strong> <strong>the</strong> fire-generated particles revealedthat <strong>the</strong>se conta<strong>in</strong>ed high concentrations <strong>of</strong> z<strong>in</strong>c, lead, and chlor<strong>in</strong>e.Analysis <strong>of</strong> ext<strong>in</strong>guish<strong>in</strong>g water showed that this was severely contam<strong>in</strong>ated,conta<strong>in</strong><strong>in</strong>g elevated levels <strong>of</strong> both organic compounds and metals. Comparison withdata from o<strong>the</strong>r vehicle fires found <strong>in</strong> <strong>the</strong> literature showed that contam<strong>in</strong>ation <strong>of</strong>lead, copper, z<strong>in</strong>c, and antimony appear to be significant <strong>in</strong> water run-<strong>of</strong>f from <strong>the</strong>setypes <strong>of</strong> fires.With<strong>in</strong> <strong>the</strong> EUREKA project EU499 (FIRETUN) [54] <strong>the</strong> release <strong>of</strong> PCDD/Fs andPAHs were analysed <strong>in</strong> connection with some <strong>of</strong> <strong>the</strong> tests: an old car (1974), a newcar (1988), a German subway carriage, and a Deutsche bahn wagon with a steel bodyand a modern InterCityExpress (ICE) <strong>in</strong>terior [231]. The release <strong>in</strong>to <strong>the</strong> tunnel wasestimated by us<strong>in</strong>g 1 m 2 passive collectors (cotton and steel, respectively) and activesampl<strong>in</strong>g at different positions along <strong>the</strong> tunnel. In addition, <strong>the</strong> fire residue wasanalysed. In Table 6.1 <strong>the</strong> releases <strong>of</strong> PCDD/F and PAH <strong>in</strong>to <strong>the</strong> tunnel from <strong>the</strong>different vehicle fires are summarized. To better compare <strong>the</strong> results with resultsfrom o<strong>the</strong>r tests <strong>the</strong> values have been normalized relative to <strong>the</strong> energy content <strong>of</strong>each vehicle. The results show that <strong>the</strong> PCDD/F from <strong>the</strong> subway carriage and <strong>the</strong>ICE-wagon are similar and that <strong>the</strong>se results are approximately one order <strong>of</strong> magnitudelarger than those from <strong>the</strong> cars. Correspond<strong>in</strong>g values obta<strong>in</strong>ed <strong>in</strong> <strong>the</strong> car firesreported <strong>in</strong> Paper IV were 0.023 mg I-TEQ/GJ (0.0868 mg I-TEQ <strong>in</strong> total) forPCDD/F and 31.3 g/GJ (119 g <strong>in</strong> total) for PAH, i.e. almost an order <strong>of</strong> magnitudehigher than for <strong>the</strong> cars reported by Wichmann. Apart from actual differences <strong>in</strong> productionbetween <strong>the</strong> tests, <strong>the</strong>re are two o<strong>the</strong>r possible explanations for <strong>the</strong> differences.There might be a higher collection efficiency <strong>in</strong> <strong>the</strong> tests performed beneath<strong>the</strong> <strong>in</strong>dustry calorimeter. There is also a difference <strong>in</strong> how <strong>the</strong> total energy was calculated.In <strong>the</strong> case <strong>of</strong> <strong>the</strong> EUREKA tests, <strong>the</strong> energy content was estimated from <strong>the</strong>composition <strong>of</strong> <strong>the</strong> fuel load, while <strong>in</strong> <strong>the</strong> test presented <strong>in</strong> Paper IV <strong>the</strong> total energywas calculated from <strong>the</strong> heat release measurements. This latter difference is, however,relatively small. A comparison with <strong>the</strong> <strong>in</strong>tegrated values available for <strong>the</strong> subwaycarriage and <strong>the</strong> ICE-wagon [75] show that <strong>the</strong> estimated total energy content is66
6 Gas concentrations <strong>in</strong> <strong>the</strong> tunnelapproximately 10 % higher than <strong>the</strong> <strong>in</strong>tegrated HRR value for <strong>the</strong> subway carriageand approximately 30 % higher for <strong>the</strong> ICE-wagon .Table 6.1 Emissions <strong>of</strong> PCDD/F and PAH from vehicle fires <strong>in</strong> a tunnel andPCDD/F found <strong>in</strong> <strong>the</strong> fire residue [231]. The values are divided by <strong>the</strong>energy content.Vehicle Q tot Fire residuePCDD/FGJ mg I-TEQmg I-TEQ/GJTunnel PCDD/FmgI-TEQmg I-TEQ/GJTunnel PAHgg/GJOld car 6 0.012 0.002 0.032 0.0053 13 2.2New car 9 0.008 0.00089 0.044 0.0049 27 3.0Subway 41 0.54 0.013 2.0 0.049 NA NAcarriageICE-wagon 77 1.1 0.014 9.2 0.12 NA NAThe effect <strong>of</strong> <strong>the</strong> ventilation on <strong>the</strong> production <strong>of</strong> various chemical compounds ispresented <strong>in</strong> Paper III. How this is related to <strong>the</strong> conditions <strong>in</strong> a tunnel, and to resultsfrom tests performed <strong>in</strong> tunnels, is discussed <strong>in</strong> <strong>the</strong> next section.6.2 Influence <strong>of</strong> ventilation on <strong>the</strong> gas compositionThe ventilation is an important means to affect, and hopefully improve, <strong>the</strong> conditions<strong>in</strong> a tunnel. Longitud<strong>in</strong>al ventilation can improve <strong>the</strong> conditions upstream <strong>of</strong><strong>the</strong> fire significantly, mak<strong>in</strong>g it possible for <strong>the</strong> rescue service to reach <strong>the</strong> fire. It is,however, important to remember that <strong>the</strong> situation downstream <strong>of</strong> <strong>the</strong> fire can beexacerbated by <strong>the</strong> ventilation. In Norway, at least at some places, <strong>the</strong> ventilation isused as a part <strong>of</strong> <strong>the</strong> fire fight<strong>in</strong>g tactics where <strong>in</strong> case <strong>of</strong> fire <strong>the</strong> ventilation is used<strong>in</strong> a pre-def<strong>in</strong>ed direction [232]. Two reasons <strong>in</strong> particular are given for this methodology:first, <strong>the</strong> fire fighters know <strong>in</strong> advance <strong>the</strong> ventilation direction <strong>in</strong> <strong>the</strong> tunneland <strong>the</strong>reby what portal to attack <strong>the</strong> fire from, and second, <strong>the</strong> conditions downstream<strong>of</strong> <strong>the</strong> fire are assumed to be <strong>of</strong> no danger to people be<strong>in</strong>g <strong>in</strong> this part <strong>of</strong> <strong>the</strong>tunnel, due to dilution <strong>of</strong> <strong>the</strong> fire gases. This strategy is partly based on <strong>the</strong> resultsfrom <strong>the</strong> experiments with two passenger cars <strong>in</strong> <strong>the</strong> Byfjord tunnel <strong>in</strong> 1998 and <strong>the</strong>Bømlafjord tunnel <strong>in</strong> 2000. These results showed that downstream <strong>of</strong> <strong>the</strong> car fires,<strong>the</strong> concentrations <strong>of</strong> CO and NO x were not life threaten<strong>in</strong>g [233].In a Swedish study concern<strong>in</strong>g <strong>the</strong> heat release rate from tunnel fires, <strong>the</strong> ability <strong>of</strong><strong>the</strong> rescue service to rescue people from <strong>the</strong> tunnel and to attack <strong>the</strong> fire, and <strong>the</strong>possibility for people to escape from a tunnel fire showed that <strong>the</strong> two ma<strong>in</strong> effects<strong>of</strong> longitud<strong>in</strong>al ventilation on <strong>the</strong> conditions dur<strong>in</strong>g a tunnel fire is an <strong>in</strong>crease <strong>of</strong> <strong>the</strong>growth rate <strong>of</strong> <strong>the</strong> fire and an <strong>in</strong>creased dilution <strong>of</strong> <strong>the</strong> gases [84].A parameter commonly used to describe <strong>the</strong> ventilation conditions dur<strong>in</strong>g a fire is<strong>the</strong> equivalence ratio, φ, def<strong>in</strong>ed as:67
<strong>On</strong> <strong>the</strong> <strong>Characteristics</strong> <strong>of</strong> <strong>Fires</strong> <strong>in</strong> <strong>Tunnels</strong>φ =.m fuelṁ ṁṁoxygen( fuel oxygen ) stoich .φ = 1φ < 1φ > 1stoichiometric combustionwell ventilated combustionunder-ventilated combustion(6.1)where m&fuelis <strong>the</strong> mass loss rate <strong>of</strong> <strong>the</strong> fuel and m&oxygenis <strong>the</strong> mass flow rate <strong>of</strong>oxygen and <strong>the</strong> subscript “stoich.” refers to <strong>the</strong>se values under stoichiometric conditions.Thus, <strong>in</strong> Eq (6.1), φ is def<strong>in</strong>ed as <strong>the</strong> quotient <strong>of</strong> <strong>the</strong> actual fuel/oxygen ratioand <strong>the</strong> stoichiometric fuel/oxygen ratio.Different terms are used for <strong>the</strong> different ventilation conditions that can be atta<strong>in</strong>ed<strong>in</strong> a fire situation. The situation when more air (oxygen) is available <strong>the</strong>n is neededfor stoichiometric combustion is referred to as over-ventilated, well ventilated, fuellean,or fuel-controlled. If <strong>in</strong>sufficient air is available for stoichiometric combustion<strong>the</strong> situation is termed under-ventilated, vitiated, fuel-rich, or ventilation-controlled.In this <strong>the</strong>sis <strong>the</strong> terms well ventilated and under-ventilated, respectively, are ma<strong>in</strong>lyused and are related to <strong>the</strong> whole system. Even under well ventilated conditions <strong>the</strong>geometric conditions and flow pattern can be such that fresh air does not reach <strong>the</strong>combustion zone. Such a situation is here referred to as vitiated or locally underventilated.In cases where <strong>the</strong> spatial variation ei<strong>the</strong>r can be assumed to be small or when it isdifficult to resolve <strong>the</strong> variations, <strong>the</strong> overall combustion process is <strong>of</strong>ten studied<strong>in</strong>stead. In such cases φ can be def<strong>in</strong>ed <strong>in</strong> a more general sense us<strong>in</strong>g <strong>the</strong> equivalenceratio for <strong>the</strong> total combustion process. This is usually referred to as <strong>the</strong> globalequivalence ratio, GER. Orig<strong>in</strong>ally, this was def<strong>in</strong>ed as <strong>the</strong> ratio <strong>of</strong> <strong>the</strong> mass <strong>of</strong> gas <strong>in</strong><strong>the</strong> upper layer <strong>in</strong> an enclosure derived from <strong>the</strong> fuel divided by that <strong>in</strong>troduced fromair, normalized by <strong>the</strong> stoichiometric ratio [234]. Beyler, who was <strong>the</strong> first to correlate<strong>the</strong> species concentrations <strong>in</strong> <strong>the</strong> upper layer with <strong>the</strong> equivalence ratio, used avariant called <strong>the</strong> plume equivalence ratio def<strong>in</strong>ed as <strong>the</strong> ratio <strong>of</strong> <strong>the</strong> fuel volatilizationrate to <strong>the</strong> air entra<strong>in</strong>ment rate, normalized by <strong>the</strong> stoichiometric fuel to air ratio[235-237]. In <strong>the</strong> work presented <strong>in</strong> Paper III, <strong>the</strong> def<strong>in</strong>ition <strong>of</strong> <strong>the</strong> GER is <strong>the</strong> ratiobetween <strong>the</strong> mass loss rate <strong>of</strong> <strong>the</strong> fuel and <strong>the</strong> mass flow <strong>of</strong> oxygen enter<strong>in</strong>g <strong>the</strong>combustion room normalised by <strong>the</strong> stoichiometric ratio.In order to measure <strong>the</strong> GER <strong>in</strong> <strong>the</strong> two different test room <strong>in</strong> Paper III, a devicecalled “<strong>the</strong> phi meter” [36, 238], was constructed. The essential parts <strong>of</strong> <strong>the</strong> phimeter are <strong>the</strong> combustor, <strong>in</strong>to which <strong>the</strong> fire gases and additional pure oxygen are<strong>in</strong>troduced, and <strong>the</strong> O 2 analyser. Complete combustion <strong>of</strong> <strong>the</strong> fire gases is achieved<strong>in</strong> <strong>the</strong> combustor by <strong>the</strong> high temperature (1000 ºC was used <strong>in</strong> <strong>the</strong>se specific tests)and by us<strong>in</strong>g a plat<strong>in</strong>um catalyst and additional oxygen. The read<strong>in</strong>gs on <strong>the</strong> O 2analyser are compared with background measurements without fire gases through<strong>the</strong> phi meter. A simple computation gives <strong>the</strong> equivalence ratio. The <strong>in</strong>strumentationand <strong>the</strong> calculations needed to conduct <strong>the</strong> measurements <strong>of</strong> <strong>the</strong> equivalenceratio are described <strong>in</strong> detail <strong>in</strong> Paper III.There are not many cases reported on measured under-ventilation <strong>in</strong> tunnel fires.Most reported cases can probably be said to be ei<strong>the</strong>r fuel controlled or ventilation68
6 Gas concentrations <strong>in</strong> <strong>the</strong> tunnelcontrolled (e.g. see [5]). The latter correspond to a case where limited ventilationleads to a decrease (or control) <strong>in</strong> <strong>the</strong> fire size, but if <strong>the</strong> temperature is high acont<strong>in</strong>uous mass loss can lead to under-ventilated combustion. Among <strong>the</strong> largescalefire test series, <strong>the</strong> one <strong>in</strong> <strong>the</strong> Ofenegg tunnel is an obvious example <strong>of</strong> <strong>the</strong>effect <strong>of</strong> <strong>the</strong> ventilation (see Section 5.2), but that case was also ra<strong>the</strong>r special due to<strong>the</strong> blockage <strong>in</strong> one end <strong>of</strong> <strong>the</strong> tunnel.Ingason performed fire tests <strong>in</strong> a model tunnel (1.08 m × 1.2 m × 10.96 m) to study<strong>the</strong> effect <strong>of</strong> <strong>the</strong> ventilation on <strong>the</strong> fire behaviour [42, 43]. Under-ventilated conditionswere <strong>of</strong> special <strong>in</strong>terest and both natural ventilated and forced ventilatedscenarios were studied. In <strong>the</strong> first case <strong>the</strong> fire size and <strong>the</strong> size <strong>of</strong> <strong>the</strong> <strong>in</strong>let open<strong>in</strong>gwere varied, while <strong>in</strong> <strong>the</strong> latter case <strong>the</strong> fire size and <strong>the</strong> flow rate <strong>of</strong> <strong>in</strong>com<strong>in</strong>g airwere varied. The author describes <strong>the</strong> difficulty <strong>in</strong> achiev<strong>in</strong>g under-ventilated condition.The transition to such conditions is highly dependent on <strong>the</strong> temperature and<strong>the</strong> <strong>the</strong>rmal feed-back to <strong>the</strong> fuel. This was also seen <strong>in</strong> <strong>the</strong> test series described byLönnermark et al. [132], where a case with 0.5 m 2 chlorobenzene (test CB3) gave avery slow develop<strong>in</strong>g fire <strong>in</strong>side a room. The fire reached high temperatures andunder-ventilated conditions first after approximately 35 m<strong>in</strong>. Increas<strong>in</strong>g <strong>the</strong> pool sizeto 0.8 m 2 (test CB4) gave a significantly different fire development with muchhigher temperatures and under-ventilated conditions after approximately 6 m<strong>in</strong>utes.This illustrates <strong>the</strong> importance <strong>of</strong> <strong>the</strong> fire size. In a tunnel with ventilation, <strong>the</strong> flametilt also <strong>in</strong>fluences <strong>the</strong> <strong>the</strong>rmal feed back and <strong>the</strong>reby <strong>the</strong> mass loss rate.In <strong>the</strong> test series presented by Ingason some <strong>of</strong> <strong>the</strong> tests, however, became underventilated.Gas composition (CO, CO 2 , and O 2 ) was analyzed at three differen<strong>the</strong>ights (0.15 m, 0.5 m, and 0.9 m below <strong>the</strong> ceil<strong>in</strong>g), 4.5 m downstream <strong>of</strong> <strong>the</strong> centre<strong>of</strong> <strong>the</strong> fire, which was situated 1.5 m from <strong>the</strong> tunnel entrance. In most <strong>of</strong> <strong>the</strong> tests<strong>the</strong> ΔCO/ΔCO 2 -ratios were ra<strong>the</strong>r similar at <strong>the</strong> different sampl<strong>in</strong>g heights. The ratiowas, however, <strong>of</strong>ten somewhat higher <strong>in</strong> <strong>the</strong> highest position (0.15 m below <strong>the</strong>ceil<strong>in</strong>g) dur<strong>in</strong>g some period <strong>of</strong> <strong>the</strong> tests. In a few cases <strong>the</strong> ΔCO/ΔCO 2 -ratio washighest <strong>in</strong> <strong>the</strong> lowest position (e.g. <strong>in</strong> test 2 and test 8). In Figure 6.1 <strong>the</strong> ΔCO/ΔCO 2 -ratios for heptane pool fires are presented as a function <strong>of</strong> <strong>the</strong> equivalence ratio. Thevalues were chosen to be representative values for <strong>the</strong> position with <strong>the</strong> highestΔCO/ΔCO 2 -ratio at <strong>the</strong> selected time. Note that Ingason used an equivalence ratiobased on <strong>the</strong> air to fuel ratio, while throughout this section all equivalence ratios(<strong>in</strong>clud<strong>in</strong>g those presented <strong>in</strong> Figure 6.1) are based on fuel to air ratios. Twodifferent cases are represented <strong>in</strong> <strong>the</strong> figure: natural ventilation and forced ventilation.The values <strong>of</strong> <strong>the</strong> ΔCO/ΔCO 2 -ratios were determ<strong>in</strong>ed at <strong>the</strong> time when <strong>the</strong> massloss rate was at its maximum for each test. For <strong>the</strong> natural ventilation an exponentialcurve fit is <strong>in</strong>cluded. It fits <strong>the</strong> data po<strong>in</strong>ts very well, but due to <strong>the</strong> limited number<strong>of</strong> po<strong>in</strong>ts it should be seen as an illustration.The po<strong>in</strong>ts for <strong>the</strong> forced ventilation show a pattern different from <strong>the</strong> naturalventilation case. All cases are well ventilated, but <strong>the</strong> po<strong>in</strong>t at φ = 0.89 shows features<strong>of</strong> under-ventilation. This could have two possible explanations. There arestudies that <strong>in</strong>dicate that <strong>the</strong> CO production starts to <strong>in</strong>crease well below φ = 1, atφ ≈ 0.6 (see e.g. [234, 235]). Ano<strong>the</strong>r explanation could be <strong>the</strong> flow pattern around<strong>the</strong> fire dur<strong>in</strong>g forced ventilation. The experimental results, especially <strong>the</strong> O 2 -measurements,show a significant gradient with height, which <strong>in</strong>dicates that even if <strong>the</strong>69
<strong>On</strong> <strong>the</strong> <strong>Characteristics</strong> <strong>of</strong> <strong>Fires</strong> <strong>in</strong> <strong>Tunnels</strong>tunnel is well ventilated it could be locally under-ventilated <strong>in</strong> <strong>the</strong> combustion zone.The three-dimensional flow typically found close to <strong>the</strong> fire <strong>in</strong> a tunnel was illustratedby Ingason, show<strong>in</strong>g <strong>the</strong> ma<strong>in</strong> ways for <strong>the</strong> flows <strong>of</strong> different density [239].ΔCO/ΔCO 20.30.250.20.150.1y = 0.0035451 * e^(1.3737x) R= 0.99433ΔCO/ΔCO 2Heptane NaturalΔCO/ΔCO 2Heptane Forced0.0500 0.5 1 1.5 2 2.5 3 3.5Equivalence ratioFigure 6.1 ΔCO/ΔCO 2 -ratio as function <strong>of</strong> equivalence ratio for heptane pool firesperformed by Ingason [42, 43]. The results are given both for naturalventilation and for forced ventilation. Included for illustration is an exponentialcurve fit <strong>of</strong> <strong>the</strong> natural ventilation data. It is, however, based ononly six data po<strong>in</strong>ts.The results from <strong>the</strong> experiments with xylene and methanol are summarized <strong>in</strong> Table6.2. Compared to <strong>the</strong> experiments with heptane pool fires presented <strong>in</strong> Figure 6.1,xylene results <strong>in</strong> high values and methanol <strong>in</strong> low values <strong>of</strong> ΔCO/ΔCO 2 -ratios. Thisis <strong>in</strong> l<strong>in</strong>e with <strong>the</strong> results <strong>of</strong> Beyler show<strong>in</strong>g that oxygenated hydrocarbons producesmall amounts <strong>of</strong> CO (expressed as yield) at low equivalence ratios [235]. Aromatics(Beyler used toluene) on <strong>the</strong> o<strong>the</strong>r hand, produce a ra<strong>the</strong>r constant CO yield<strong>in</strong>dependent on <strong>the</strong> equivalence ratio; only a small <strong>in</strong>crease was reported. Thismeans that aromatics at low equivalence ratios produce relatively high CO yieldsand at high equivalence ratios produce relatively low CO yields. The variation <strong>in</strong>ΔCO/ΔCO 2 -ratio with equivalence ratio presented <strong>in</strong> Table 6.2 might be expla<strong>in</strong>edby a decrease <strong>in</strong> CO 2 production.70
6 Gas concentrations <strong>in</strong> <strong>the</strong> tunnelTable 6.2 ΔCO/ΔCO 2 -ratio as function <strong>of</strong> equivalence ratio for xylene andmethanol pool fires performed by Ingason [42, 43].FuelVentilationFire size[m 2 ]Open<strong>in</strong>g[m 2 ]φ ΔCO/ΔCO 2Xylene Natural 0.3 × 0.3 0.3 × 0.3 0.37 0.20 (0.38) a)Xylene Natural 0.3 × 0.3 0.15 × 0.15 1.01 0.30 (0.41) a)Xylene Natural 0.3 × 0.3 0.1 × 0.1 1.94 0.36 (0.43) a)Xylene Natural 0.3 × 0.3 0.2 × 0.2 0.70 0.23 (0.31) a)Xylene Forced 0.3 × 0.3 0.2 (ø=0.5m) 0.15 0.15 (0.26) a)Methanol Natural 0.4 × 0.4 0.6 × 0.6 0.04 0.003-0.035 b)Methanol Forced 0.4 × 0.4 0.2 (ø=0.5m) 0.02 -0.01 – 0.02 b)a) The ΔCO/ΔCO 2 -ratio was highest <strong>in</strong> <strong>the</strong> beg<strong>in</strong>n<strong>in</strong>g <strong>of</strong> <strong>the</strong> result period reportedand <strong>the</strong>n decreased; <strong>the</strong> maximum value (with<strong>in</strong> paren<strong>the</strong>sis) is notused (see discussion <strong>of</strong> Figure 6.3) but <strong>in</strong>stead someth<strong>in</strong>g closer to a steadystate value.b) The ΔCO/ΔCO 2 -ratio is vary<strong>in</strong>g significantly; <strong>the</strong>refore a range is given (<strong>in</strong>clud<strong>in</strong>gall <strong>the</strong> three heights).Lönnermark et al. performed under-ventilated fire experiments <strong>in</strong> an enclosure (<strong>the</strong>ISO 5705 room: 2.4 m × 3.6 m × 2.4 m), where <strong>the</strong> size <strong>of</strong> <strong>the</strong> open<strong>in</strong>g was varied[132]. Five different fuels were used: Polypropene, Nylon 66, Tetramethylthiurammonosulfid, 3-Chloro-4 nitro-benzoic acid, and Chlorobenzene. In Paper III resultsare given for CO and o<strong>the</strong>r components <strong>in</strong> <strong>the</strong> fire gases, and <strong>the</strong>ir dependence on <strong>the</strong>equivalence ratio. For comparison with <strong>the</strong> results from model scale tunnel testspresented <strong>in</strong> Figure 6.1, CO/CO 2 -ratios have been calculated from tests <strong>in</strong> <strong>the</strong> enclosurefires [132]. Note that here absolute concentrations have been used and notchanges from background values as <strong>in</strong> <strong>the</strong> case presented by Ingason.In Figure 6.2 CO/CO 2 -ratios for polypropene, Nylon 66, and chlorobenzene poolfires (polypropene and Nylon 66 were solid polymers <strong>in</strong> form <strong>of</strong> pellets) arepresented as function <strong>of</strong> <strong>the</strong> equivalence ratio. For all three materials, results are presentedfor measurements both <strong>in</strong> <strong>the</strong> open<strong>in</strong>g from <strong>the</strong> enclosure and <strong>in</strong> <strong>the</strong> exhaustduct connected to <strong>the</strong> hood collect<strong>in</strong>g <strong>the</strong> fire gases. For illustration an exponentialcurve-fit for <strong>the</strong> results from <strong>the</strong> open<strong>in</strong>g for polypropene is <strong>in</strong>cluded. This fit seemsto be qualitatively representative for <strong>the</strong> o<strong>the</strong>r cases also, even if <strong>the</strong>re aredifferences between <strong>the</strong> materials.The effect <strong>of</strong> combustion outside <strong>the</strong> open<strong>in</strong>g dur<strong>in</strong>g under-ventilated conditions canbe seen for Nylon 66. This effect is also obvious for chlorobenzenene. For heptane<strong>the</strong> CO/CO 2 -ratio are ra<strong>the</strong>r similar <strong>in</strong> <strong>the</strong> open<strong>in</strong>g and duct for most values <strong>of</strong> <strong>the</strong>equivalence ratios reported. From <strong>the</strong> figure it can be seen that when pass<strong>in</strong>g fromwell ventilated to under-ventilated conditions (pass<strong>in</strong>g <strong>the</strong> po<strong>in</strong>t φ = 1), <strong>the</strong> CO/CO 2 -ratios <strong>in</strong>creases above approximately 0.05. This is comparable to <strong>the</strong> natural ventilatedtests with heptane <strong>in</strong> <strong>the</strong> model scale tunnel performed by Ingason (see Figure6.1). For <strong>the</strong> cases with forced ventilation <strong>the</strong> differences are larger. The explanationsfor this, besides differences between materials, were discussed above.71
<strong>On</strong> <strong>the</strong> <strong>Characteristics</strong> <strong>of</strong> <strong>Fires</strong> <strong>in</strong> <strong>Tunnels</strong>0.40.35y = 0.0074225 * e^(1.9678x) R= 0.91465CO/CO 20.30.250.20.150.10.05Polypropene, open<strong>in</strong>gPolypropene, ductNylon 66, open<strong>in</strong>gNylon 66, ductChlorobenzene, open<strong>in</strong>gChlorobenzene, duct00 0.5 1 1.5 2 2.5 3Equivalence ratioFigure 6.2 CO/CO 2 -ratio as function <strong>of</strong> equivalence ratio for polypropene,Nylon 66, and chlorobenzene. For all three materials, results are givenfor measurements <strong>in</strong> <strong>the</strong> open<strong>in</strong>g <strong>of</strong> <strong>the</strong> enclosure and <strong>in</strong> <strong>the</strong> exhaust ductconnected to <strong>the</strong> hood collect<strong>in</strong>g <strong>the</strong> fire gases. An exponential curve fitis <strong>in</strong>cluded for polypropene (open<strong>in</strong>g).Grant and Drysdale presented analyses <strong>of</strong> CO and CO 2 for <strong>the</strong> EUREKA projectEU499 (FIRETUN). The heat release rate calculations based on <strong>the</strong>se measurementswere presented above. The calculated CO/CO 2 -ratios show that high values(maximum 0.2 30 m downstream <strong>of</strong> <strong>the</strong> fire and 0.13 100 m downstream <strong>of</strong> <strong>the</strong> fire)are obta<strong>in</strong>ed dur<strong>in</strong>g <strong>the</strong> <strong>in</strong>itial phase before <strong>the</strong> HRR starts to <strong>in</strong>crease rapidly, i.e.when <strong>the</strong> fire spreads to <strong>the</strong> trailer. Dur<strong>in</strong>g <strong>the</strong> most <strong>in</strong>tense part <strong>of</strong> <strong>the</strong> fire <strong>the</strong>CO/CO 2 -ratios 100 m downstream stay below 0.02. At 100 m downstream <strong>of</strong> <strong>the</strong> fire<strong>the</strong> CO/CO 2 -ratio are also approximately 0.02 or lower, but a clear <strong>in</strong>crease dur<strong>in</strong>g<strong>the</strong> period when <strong>the</strong> ventilation was switched <strong>of</strong>f can be seen. The maximum valuegiven is 0.05, but <strong>the</strong> peak value dur<strong>in</strong>g this time period could be higher s<strong>in</strong>ce valuesare miss<strong>in</strong>g for a few m<strong>in</strong>utes. Compar<strong>in</strong>g <strong>the</strong>se results with those presented <strong>in</strong>Figure 6.1 and Figure 6.2 <strong>in</strong>dicates under-ventilated combustion dur<strong>in</strong>g this timeperiod, which is understandable due to low ventilation dur<strong>in</strong>g a period <strong>of</strong> high temperaturesand probably high mass loss rates.Similar results were found <strong>in</strong> <strong>the</strong> four Runehamar tests, i.e. high CO/CO 2 -ratiosdur<strong>in</strong>g <strong>the</strong> <strong>in</strong>itial phase <strong>of</strong> <strong>the</strong> fire and low values dur<strong>in</strong>g <strong>the</strong> <strong>in</strong>tense fire and <strong>the</strong>decay period (see Figure 6.3). The gas analyses (CO and CO 2 ) were performed attwo different heights (2.9 m and 5.1 m respectively above <strong>the</strong> road surface), 458 mfrom <strong>the</strong> centre <strong>of</strong> <strong>the</strong> fire. Analyses <strong>of</strong> O 2 were also performed <strong>in</strong> <strong>the</strong>se positionsand at <strong>the</strong> height 0.7 m (see Paper II for detailed description <strong>of</strong> <strong>the</strong> measurement setupand analysers). It can be seen from Figure 6.3 (<strong>in</strong> comparison with Figure 6.2)72
6 Gas concentrations <strong>in</strong> <strong>the</strong> tunnelthat all <strong>the</strong> tests seem well ventilated. The high values at <strong>the</strong> beg<strong>in</strong>n<strong>in</strong>g <strong>of</strong> <strong>the</strong> testscan be expla<strong>in</strong>ed by <strong>in</strong>complete combustion. The temperature <strong>in</strong> <strong>the</strong> combustionzone may have affected <strong>the</strong> results. It is known from fire experiments <strong>in</strong>compartments that both <strong>the</strong> residence time and <strong>the</strong> temperature <strong>in</strong> <strong>the</strong> upper layer areimportant factors for <strong>the</strong> production <strong>of</strong> CO [240]. Even for well ventilatedconditions, high CO concentrations can be measured if <strong>the</strong> temperature is belowapproximately 800 K. The situation looks similar to <strong>the</strong> one called pre-flam<strong>in</strong>gcombustion described by Tsuchiya and discussed below [241]. The highest values(not shown <strong>in</strong> <strong>the</strong> figure) are also dependent on <strong>the</strong> absolute relationship between <strong>the</strong>CO and CO 2 analyses. A small difference <strong>in</strong> response time or time to reach aconcentration above <strong>the</strong> detection limit, significantly affects <strong>the</strong> <strong>in</strong>itial values. Tobetter be able to compare <strong>the</strong> CO/CO 2 -ratios with <strong>the</strong> HRR and <strong>the</strong> temperaturemeasurements near <strong>the</strong> fire, <strong>the</strong> time scales <strong>in</strong> Figure 6.3 were corrected for <strong>the</strong>transport time between <strong>the</strong> fire and <strong>the</strong> measurement station. This transport timevaries with <strong>the</strong> HRR and <strong>the</strong> procedure to calculate this is described <strong>in</strong> Paper II. Theestimated transport time varies between 1.5 and 2.5 m<strong>in</strong> depend<strong>in</strong>g on <strong>the</strong> HRR.0.20.15T1, 2.9mT2, 2.9mT3, 2.9mT4, 2.9mCO/CO 20.10.0500 10 20 30 40 50Time [m<strong>in</strong>]Figure 6.3 CO/CO2-ratio as function <strong>of</strong> time for <strong>the</strong> Runehamar tests. The gasanalyses were performed at 458 m from <strong>the</strong> centre <strong>of</strong> <strong>the</strong> fire, 2.9 mabove <strong>the</strong> road surface.The results from <strong>the</strong> Runehamar tests look similar to those reported by Bettis et al.[113] where <strong>the</strong> tests were well ventilated, apart from a short period dur<strong>in</strong>g one <strong>of</strong><strong>the</strong> tests. The CO/CO 2 ratios ranged, <strong>in</strong> most cases, from 0.005 to 0.025. In a fewcases <strong>the</strong>re was a higher value (0.05 - >0.1) <strong>in</strong> <strong>the</strong> beg<strong>in</strong>n<strong>in</strong>g <strong>of</strong> <strong>the</strong> test followed by acont<strong>in</strong>uous decrease. A steady state value as high as 0.05-0.06 was reported <strong>in</strong> onlyone test (Test 6). The fire was partly sheltered due to <strong>the</strong> set-up and this can haveaffected <strong>the</strong> local ventilation conditions.73
<strong>On</strong> <strong>the</strong> <strong>Characteristics</strong> <strong>of</strong> <strong>Fires</strong> <strong>in</strong> <strong>Tunnels</strong>Dur<strong>in</strong>g ventilated conditions <strong>in</strong> a tunnel, <strong>the</strong> situation at <strong>the</strong> fuel can be ventilationcontrolled or locally under-ventilated if <strong>the</strong> fuel set-up is such that <strong>the</strong> air flow doesnot reach <strong>the</strong> vaporized or pyrolized fuel. This was discussed <strong>in</strong> Section 5.2 and wasalso mentioned <strong>in</strong> relation to <strong>the</strong> <strong>in</strong>itial period <strong>of</strong> fires discussed above. In Section5.2 <strong>the</strong> effect <strong>of</strong> <strong>the</strong> local availability <strong>of</strong> oxygen on <strong>the</strong> decomposition rate wasalso briefly discussed.Tewarson performed an extensive work on collect<strong>in</strong>g data on yield <strong>of</strong> CO and CO 2 ,respectively, for different materials, and on how <strong>the</strong>se yields depend on <strong>the</strong>equivalence ratio [35]. From <strong>the</strong> result he developed relasionships <strong>of</strong> <strong>the</strong> ratio <strong>of</strong>actual yield to well-ventilated yield as function <strong>of</strong> equivalence ratio. Comb<strong>in</strong><strong>in</strong>g hisresults gives <strong>the</strong> follow<strong>in</strong>g equation:XXCOCO2⎡ β44⎢1+exp=⎣⎡ 128⎢1−⎣ exp−ξ( 2.5φ)⎤⎥ y⎦CO,wvy−1.2⎥ CO2, wv( φ / 2.15))⎤⎦(6.2)where y is <strong>the</strong> yield [g/g], β and ξ are correlation coefficients, and <strong>the</strong> <strong>in</strong>dex wvcorresponds to well ventilated conditions. The values <strong>of</strong> <strong>the</strong> different parameters aregiven for four selected materials <strong>in</strong> Table 6.3. The CO/CO 2 ratio as a function <strong>of</strong> φbased on Eq. (6.2) is given for three materials <strong>in</strong> Figure 6.4. Polypropene was not<strong>in</strong>cluded s<strong>in</strong>ce it is almost identical to polye<strong>the</strong>ne. The curves diverge from eacho<strong>the</strong>r, but for all three fuels <strong>the</strong> CO/CO 2 ratio at φ = 1 is between 0.03 and 0.05Table 6.3 Yields <strong>of</strong> CO and CO 2 dur<strong>in</strong>g well ventilated conditions and values <strong>of</strong>correlation coefficients <strong>in</strong> Eq. (6.2) given for four materials [35].Material yCO, wv[g/g] yCO2 , wv[g/g] β ξPolye<strong>the</strong>ne (PE) 0.024 2.76 10 2.8Polypropene (PP) 0.024 2.79 10 2.8Polystyrene (PS) 0.060 2.33 2 2.5Wood 0.005 1.33 44 3.5Different fuels utilize available oxygen at high equivalence ratios to very differentextents. Beyler reported residual oxygen <strong>in</strong> exhaust gases from a hood system simulat<strong>in</strong>g<strong>the</strong> upper layer <strong>in</strong> a two-layer situation at φ > 1.2 for different types <strong>of</strong> fuels[235]. These results are summarized <strong>in</strong> Table 6.4. There is a wide range <strong>in</strong> residualoxygen for <strong>the</strong> different fuels, from 0.1 % (methanol and ethanol) to 8.0 % (toluene).These values can be compared to <strong>the</strong> m<strong>in</strong>imum oxygen concentration measured <strong>in</strong>each test <strong>in</strong> <strong>the</strong> Runehamar tunnel: 6.4 %, 8.6 %, 11.7 %, and 15.9 % for T1, T2, T3,and T4, respectively (values corrected for estimated H 2 O concentration; see alsoTable 6.7).74
6 Gas concentrations <strong>in</strong> <strong>the</strong> tunnelCO/CO 20.40.350.30.250.20.150.10.05Polye<strong>the</strong>nePolystyreneWood00 0.5 1 1.5 2 2.5 3Equivalence ratioFigure 6.4 CO/CO 2 ratio for polye<strong>the</strong>ne, polystyrene, and wood as a function <strong>of</strong> φ,based on <strong>the</strong> work by Tewarson (Eq. (6.2)) [35].Table 6.4 Residual oxygen for combustion <strong>of</strong> different fuels at φ > 1.2 [235].Fuel Chemical formula Residual O 2 [%]Propane C 3 H 8 0.5Propene C 3 H 6 2.0Hexanes C 6 H 14 3.0Toluene C 7 H 8 8.0Methanol CH 3 OH 0.1Ethanol C 2 H 5 OH 0.1Isopropanol C 3 H 7 OH 2.0Acetone C 3 H 6 O 0.7The CO/CO 2 -ratio depends on <strong>the</strong> mode <strong>of</strong> combustion. For combustion <strong>of</strong> wood <strong>the</strong>combustion can be divided <strong>in</strong>to three stages: 1) pre-flam<strong>in</strong>g pyrolysis, 2) flam<strong>in</strong>gcombustion, and 3) char combustion or glow<strong>in</strong>g [241]. Tsuchiya presented meanvalues <strong>of</strong> CO/CO 2 -ratios for <strong>the</strong> three phases <strong>of</strong> combustion for plywood: 0.9 (pyrolysis),0.0035 (flam<strong>in</strong>g combustion), and 0.25 (glow<strong>in</strong>g), respectively. In <strong>the</strong> discussionabove, <strong>the</strong> mode <strong>of</strong> combustion has been considered to be flam<strong>in</strong>g <strong>in</strong> all cases.There is an abrupt transistion from pre-flam<strong>in</strong>g pyrolysis to flam<strong>in</strong>g combustion.Tsuchiya showed that this transition occurred when <strong>the</strong> O 2 concentration was higherthan a certa<strong>in</strong> value that depends on <strong>the</strong> <strong>in</strong>cident heat flux accord<strong>in</strong>g to:C O= 19.4 − 0.19 ⋅Q&′(6.3)275
<strong>On</strong> <strong>the</strong> <strong>Characteristics</strong> <strong>of</strong> <strong>Fires</strong> <strong>in</strong> <strong>Tunnels</strong>where COis <strong>the</strong> concentration <strong>of</strong> O22 (<strong>in</strong> %) and Q & ′is <strong>the</strong> <strong>in</strong>cident heat flux (<strong>in</strong>kW/m 2 ).Modes o<strong>the</strong>r than flam<strong>in</strong>g combustion will not be discussed fur<strong>the</strong>r here. Tsuchiyaalso presented CO/CO 2 -ratios for liquids and non-charr<strong>in</strong>g plastics under differentlevels <strong>of</strong> <strong>in</strong>cident radiation <strong>in</strong> <strong>the</strong> cone calorimeter. Some selected materials <strong>of</strong> particular<strong>in</strong>terest for <strong>the</strong> discussion <strong>in</strong> this section are presented <strong>in</strong> Table 6.5.There are large differences between <strong>the</strong> different types <strong>of</strong> fuels. When rank<strong>in</strong>g fuelsaccord<strong>in</strong>g to <strong>the</strong>ir produced CO/CO 2 -ratio (from low to high) <strong>the</strong>y can be listed asalcohols and oxygen conta<strong>in</strong><strong>in</strong>g fuels, hydrocarbons, and f<strong>in</strong>ally aromatics. Thisorder is valid for well ventilated conditions. For under-ventilated condition <strong>the</strong>rank<strong>in</strong>g is reversed [235, 242].Table 6.5 CO/CO 2 -ratios for selected liquids and non-charform<strong>in</strong>g plastics combusted<strong>in</strong> normal air <strong>in</strong> <strong>the</strong> cone calorimeter [241].Material Radiation [kW/m 2 ] CO/CO 2Methanol 5 0.0002Ethanol 5 0.0004n-Heptane 5 0.010Benzene 5 0.065Xylene 5 0.056Polypropene 30 0.024Polypropene 50 0.025Polystyrene 25 0.046Polystyrene 40 0.0516.3 ToxicityIn Sections 6.1 and 6.2, <strong>the</strong> importance <strong>of</strong> CO <strong>in</strong> determ<strong>in</strong><strong>in</strong>g <strong>the</strong> hazard posed by afire, and <strong>the</strong> difference <strong>in</strong> production <strong>of</strong> CO <strong>in</strong> different situations, was discussed. Inthis section <strong>the</strong> effect on humans <strong>of</strong> CO and o<strong>the</strong>r important combustion gases willbe quantified us<strong>in</strong>g <strong>the</strong> results from <strong>the</strong> Runehamar tests as an example.A group <strong>of</strong> important gases <strong>in</strong> connection with a fire are <strong>the</strong> asphyxiant gases. Thesegases ma<strong>in</strong>ly affect <strong>the</strong> central nervous system and cause bra<strong>in</strong> tissue hypoxia. Thema<strong>in</strong> gases with<strong>in</strong> <strong>the</strong> asphyxiant group are CO and hydrogen cyanide (HCN),although low oxygen concentrations and high CO 2 concentrations will also beconsidered s<strong>in</strong>ce <strong>the</strong>se can have asphyxiant effects. The toxic effect <strong>of</strong> CO is due toits comb<strong>in</strong>ation with haemoglob<strong>in</strong> <strong>in</strong> <strong>the</strong> blood to form carboxyhaemoglob<strong>in</strong>(COHb). In Table 6.6 health effects at different COHb concentrations <strong>in</strong> <strong>the</strong> bloodare summarized.The toxicity <strong>of</strong> CO and its relationship to COHb and effects on <strong>the</strong> oxygen-carry<strong>in</strong>gblood capacity is well-known, but CO can have o<strong>the</strong>r adverse affects, e.g. <strong>in</strong>terruption<strong>of</strong> energy production <strong>of</strong> cells, <strong>in</strong>terference <strong>of</strong> oxygen delivery, and o<strong>the</strong>r cellularactivities [223]. These latter effects are not as well understood or widely discussedas <strong>the</strong> b<strong>in</strong>d<strong>in</strong>g <strong>of</strong> CO produc<strong>in</strong>g COHb, result<strong>in</strong>g both <strong>in</strong> <strong>the</strong> haemoglob<strong>in</strong> not be<strong>in</strong>g76
6 Gas concentrations <strong>in</strong> <strong>the</strong> tunnelable to transport as much oxygen and <strong>the</strong> oxygen be<strong>in</strong>g more tightly bonded to <strong>the</strong>haemoglob<strong>in</strong>. The values <strong>in</strong> Table 6.6 should be seen as examples and not as exactlimits. A concentration <strong>of</strong> 50 % COHb is <strong>of</strong>ten taken as a threshold for lethality;Purser reports a range <strong>of</strong> 50 % to 70 % [222]. Nelson, however, reports that a largervariety can be expected and that <strong>the</strong> actual limit depends on <strong>the</strong> situation. A lowerlevel and longer exposure can result <strong>in</strong> effects on <strong>the</strong> cellular processes and this canlead to fatalities at lower levels <strong>of</strong> COHb than if a person is subjected to shorter andhigher exposures.Table 6.6 Summary <strong>of</strong> health effects at different COHb levels [243].COHb level [%] Effect10 Asymptomatic or headache20 Dizz<strong>in</strong>ess, nausea, and dyspnea30 Visual disturbance40 Confusion and syncope50 Seizures and coma≥ 60 Cardiopulmonary dysfunction and deathWhile CO decreases <strong>the</strong> possibilities for <strong>the</strong> blood to take up, carry, and deliveroxygen to <strong>the</strong> tissues, HCN decreases <strong>the</strong> ability to use <strong>the</strong> oxygen delivered to <strong>the</strong>tissues [222]. The dynamics <strong>of</strong> HCN <strong>in</strong> <strong>the</strong> human body is, however, poorly understoodand blood cyanide is not analysed as rout<strong>in</strong>ely as COHb. This is partly due todifficulties associated with <strong>the</strong> measurement <strong>of</strong> HCN <strong>in</strong> <strong>the</strong> blood <strong>of</strong> a fire victimand <strong>the</strong> decay <strong>of</strong> HCN levels <strong>in</strong> <strong>the</strong> blood after mortality. To date <strong>the</strong>re is nostandardised method to determ<strong>in</strong>e <strong>the</strong> concentration <strong>of</strong> HCN <strong>in</strong> <strong>the</strong> blood <strong>of</strong> firevictims, although work is underway with<strong>in</strong> ISO TC92/SC3 to develop such astandard.Low oxygen concentrations can cause hypoxia effects similar to those caused by COand HCN. CO 2 affects <strong>the</strong> time to <strong>in</strong>capacitation <strong>in</strong> two ways. At low concentratons,CO 2 stimulates breath<strong>in</strong>g, i.e. <strong>in</strong>creases <strong>the</strong> breath<strong>in</strong>g rate (RMV). This <strong>in</strong>creases <strong>the</strong>uptake <strong>of</strong> o<strong>the</strong>r toxic gases. At high concentrations (above approximately 5 %) CO 2becomes an asphyxiant. Its asphyxiant effect is, however, not additive to <strong>the</strong> effects<strong>of</strong> CO and HCN.Irritant gases are important when determ<strong>in</strong><strong>in</strong>g <strong>the</strong> possibility for people to escapefrom a fire. These gases can be both <strong>in</strong>organic (e.g. hydrogen chloride (HCl)) andorganic (e.g. acrole<strong>in</strong>). The ma<strong>in</strong> effect is irritation <strong>of</strong> mucous membranes, e.g., <strong>in</strong><strong>the</strong> eyes, upper respiratory tract, and to some extent <strong>the</strong> lungs. Ano<strong>the</strong>r effect is that<strong>the</strong> gases can cause oedema and <strong>in</strong>flammation <strong>in</strong> <strong>the</strong> lungs, lead<strong>in</strong>g to death 6 to 24hours after exposure [222]. No irritant gases were analysed dur<strong>in</strong>g <strong>the</strong> Runehamartests. Therefore, <strong>the</strong>se gases are not discussed fur<strong>the</strong>r here.The smoke conta<strong>in</strong>s particles hazardous to health. The decreased visibility due to <strong>the</strong>smoke also <strong>in</strong>fluences <strong>the</strong> walk<strong>in</strong>g speed <strong>of</strong> <strong>the</strong> people try<strong>in</strong>g to escape from a fire <strong>in</strong>a tunnel. Nei<strong>the</strong>r <strong>of</strong> <strong>the</strong>se effects is discussed fur<strong>the</strong>r <strong>in</strong> this <strong>the</strong>sis.77
<strong>On</strong> <strong>the</strong> <strong>Characteristics</strong> <strong>of</strong> <strong>Fires</strong> <strong>in</strong> <strong>Tunnels</strong>The focus <strong>in</strong> <strong>the</strong> follow<strong>in</strong>g discussion will be <strong>the</strong> time to <strong>in</strong>capacitation (or partial<strong>in</strong>capacitation). The calculations are based on <strong>the</strong> expressions given by Purser [222]:F( t − t )−51.0363.317⋅10⋅YCO,n⋅ RMV ⋅n n−= (6.4)I1I CO , nwhere F I is <strong>the</strong> fraction <strong>of</strong> an <strong>in</strong>capacitat<strong>in</strong>g dose, Y CO,n is <strong>the</strong> concentration <strong>of</strong> CO(<strong>in</strong> ppm) dur<strong>in</strong>g <strong>the</strong> time step, RMV is <strong>the</strong> breath<strong>in</strong>g rate (25 L/m<strong>in</strong> for lightactivity), t n -t n-1 is <strong>the</strong> length <strong>of</strong> <strong>the</strong> time step (m<strong>in</strong>), and I is <strong>the</strong> COHb concentrationat <strong>in</strong>capacitation (30 % for light activity).− tn n−1FICN , n=expHCN , nt( 5.396 − 0.023Y)(6.5)where Y HCN,n is <strong>the</strong> concentration <strong>of</strong> HCN (<strong>in</strong> ppm) dur<strong>in</strong>g <strong>the</strong> time step.− tFIO , n=2exp9O2, ntn n−1( 8.13 − 0.54( 20. − C)(6.6)whereCO , n2is <strong>the</strong> concentration <strong>of</strong> O 2 (<strong>in</strong> %) dur<strong>in</strong>g <strong>the</strong> time step.The fraction <strong>of</strong> an <strong>in</strong>capacitat<strong>in</strong>g dose for all asphynxiant gases (exclud<strong>in</strong>g effects <strong>of</strong>irritants), F IN , can <strong>the</strong>n be written (for a certa<strong>in</strong> time step):( FI, n+ FI, n) ⋅VCO, nFInFIN , n+COCN2 O ,2= (6.7)whereVCO2, n( 0.1903C+ 2.0004)expCO2, n= (6.8)RMVris <strong>the</strong> multiply<strong>in</strong>g factor for <strong>the</strong> enhanced uptake <strong>of</strong> asphixiant gases (o<strong>the</strong>r thanCO 2 ) due to <strong>in</strong>duced hyperventilation, CCO2 , nis <strong>the</strong> concentration <strong>of</strong> CO 2 (<strong>in</strong> %)dur<strong>in</strong>g <strong>the</strong> time step, and RMV r is <strong>the</strong> rest<strong>in</strong>g RMV (7.1 L/m<strong>in</strong> is used). The totalfraction <strong>of</strong> an <strong>in</strong>capacitat<strong>in</strong>g dose is calculated as <strong>the</strong> sumFIN( t = ) = ∑t NF IN , n(6.9)n=2S<strong>in</strong>ce <strong>the</strong> asphyxiant effect <strong>of</strong> CO 2 is not additative to <strong>the</strong> effects <strong>of</strong> <strong>the</strong> o<strong>the</strong>r gases itis not <strong>in</strong>cluded <strong>in</strong> Eq (6.7). However, <strong>the</strong> fraction <strong>of</strong> an <strong>in</strong>capacitat<strong>in</strong>g dose <strong>of</strong> CO 2can be calculated separately as78
6 Gas concentrations <strong>in</strong> <strong>the</strong> tunnel− tFICO , n=2exp 5189CO2, ntn n−1( 6.1623 − 0. C )(6.10)In Figure 6.5 fractions <strong>of</strong> an <strong>in</strong>capacitat<strong>in</strong>g dose based on results from <strong>the</strong>Runehamar tests us<strong>in</strong>g <strong>the</strong> equations above are presented. The gas analyses wereperformed us<strong>in</strong>g an Uras 3G HCN gas analyser at <strong>the</strong> measurements station, 458 mfrom <strong>the</strong> centre <strong>of</strong> <strong>the</strong> fire. The measurement station is described <strong>in</strong> Paper II. S<strong>in</strong>cesome <strong>of</strong> <strong>the</strong> measurements are only available at <strong>the</strong> height 2.9 m above <strong>the</strong> road, allgas concentrations has been evaluated as this height. This is higher than <strong>the</strong> heightrepresentative for a person <strong>in</strong> <strong>the</strong> tunnel, but this choice was made to be able tocompare <strong>the</strong> different contributions to <strong>the</strong> fraction <strong>of</strong> an <strong>in</strong>capacitat<strong>in</strong>g dose.The HCN analyses are described by Brandt [244].The HCN concentrations are affectedwith some uncerta<strong>in</strong>ties. The HCN concentration is, for example, below zerodur<strong>in</strong>g different time periods <strong>in</strong> <strong>the</strong> tests T1, T3, and T4 (only positive values havebeen used <strong>in</strong> <strong>the</strong> calculations). Therefore, <strong>the</strong> total fraction <strong>of</strong> an <strong>in</strong>capacitat<strong>in</strong>g doseis given both with and without <strong>the</strong> effect <strong>of</strong> HCN. In Figure 6.5 <strong>the</strong> <strong>in</strong>dividualcontributions <strong>of</strong> O 2 and CO, respectively, are presented separately. In <strong>the</strong> figure <strong>the</strong>fraction <strong>of</strong> an <strong>in</strong>capacitat<strong>in</strong>g dose due to <strong>the</strong> asphynxiant effect <strong>of</strong> CO 2 (Eq (6.10)) isalso <strong>in</strong>cluded. This effect is not additive to <strong>the</strong> effect <strong>of</strong> <strong>the</strong> o<strong>the</strong>r gases and is not<strong>in</strong>cluded <strong>in</strong> <strong>the</strong> total fraction <strong>of</strong> an <strong>in</strong>capacitat<strong>in</strong>g dose. In Table 6.7 <strong>the</strong> extremevaluels <strong>of</strong> CO, CO 2 , HCN, O 2 , and T, respectively, are given for each <strong>of</strong> <strong>the</strong> Runehamartests. Fur<strong>the</strong>r details on <strong>the</strong> gas analyses performed <strong>in</strong> <strong>the</strong> tests <strong>in</strong> <strong>the</strong> Runehamartunnel are planned to be published separately.Table 6.7 Peak values for CO, CO 2 , HCN, and T and m<strong>in</strong>imum values for O 2 <strong>in</strong> <strong>the</strong>Runehamar tests. All values correspond to a position 2.9 m above <strong>the</strong>road, 458 m from <strong>the</strong> centre <strong>of</strong> <strong>the</strong> fire.T1 T2 T3 T4CO max [ppm] 1810 2430 491 741CO 2,max [%] 11.7 9.2 6.7 3.9HCN max [ppm] 298 218 66 94O 2,m<strong>in</strong> [%] 6.4 8.6 11.7 15.9T max [ºC] 137 97 79 76In all cases <strong>the</strong> HCN concentration significantly affects <strong>the</strong> time to <strong>in</strong>capacitation(F I = 1), even if <strong>the</strong> effect is largest <strong>in</strong> test T1 and T2. In <strong>the</strong>se tests, <strong>in</strong>capacitation isquickly reached (with<strong>in</strong> a few m<strong>in</strong>utes from <strong>the</strong> start <strong>of</strong> <strong>the</strong> <strong>in</strong>crease). In all fourtests, significant amounts <strong>of</strong> HCN were produced. HCN is formed <strong>in</strong> a fire dur<strong>in</strong>gcombustion <strong>of</strong> nitrogen-conta<strong>in</strong><strong>in</strong>g materials. In <strong>the</strong> Runehamar test series, <strong>the</strong>polyurethane mattresses <strong>in</strong> test T2 are <strong>the</strong> most obvious nitrogen source (analysesshow 4.6 % (by weight) nitrogen). Fur<strong>the</strong>r, <strong>the</strong> fuel was placed on particle boards <strong>in</strong>all <strong>the</strong> tests. The nitrogen content <strong>of</strong> <strong>the</strong>se boards were not analysed, but a nitrogencontent <strong>of</strong> <strong>the</strong> order <strong>of</strong> a few percent has been reported <strong>in</strong> o<strong>the</strong>r cases [245, 246].Wood also conta<strong>in</strong>s nitrogen, but to a lower extent, 0.1 % to 0.2 % (by weight) [245,247, 248]. The formation <strong>of</strong> HCN is affected by <strong>the</strong> combustion conditions. High79
<strong>On</strong> <strong>the</strong> <strong>Characteristics</strong> <strong>of</strong> <strong>Fires</strong> <strong>in</strong> <strong>Tunnels</strong>temperatures and under-ventilated or vitiated condition favour <strong>the</strong> formation <strong>of</strong> HCN[219, 249, 250].Even without HCN <strong>in</strong>cluded, <strong>in</strong>capacitat<strong>in</strong>g dose is reached fairly quickly, approximatelyfive m<strong>in</strong>utes after <strong>the</strong> start <strong>of</strong> <strong>the</strong> <strong>in</strong>crease. It should be noted that <strong>the</strong>transport time is not subtracted, i.e. <strong>the</strong> time <strong>in</strong> <strong>the</strong> graphs is <strong>the</strong> time at <strong>the</strong> measurementstation after ignition. For test T3 and T4 <strong>in</strong>capacitat<strong>in</strong>g dose was not reach for<strong>the</strong> time period studied. This does not mean that a person <strong>in</strong> <strong>the</strong> tunnel would not beaffected. Purser suggests a value <strong>of</strong> 0.1F I to ensure safe escape.1.5T11.5T2O 2O 21CO*VCO 2AsphynxiantsAsph. (excl HCN)CO 21CO*VCO 2AsphynxiantsAsp (excl HCN)CO 2FI [-]FI [-]0.50.500 5 10 15 20Time [m<strong>in</strong>]T31.500 5 10 15 20Time [m<strong>in</strong>]T41.5O 2O 21CO*VCO 2AsphynxiantsAsphyxiants (excl HCN)CO 21CO*VCO 2AsphynxiantsAsphyxiants (excl HCN)CO 2FI [-]FI [-]0.50.500 5 10 15 20Time [m<strong>in</strong>]00 5 10 15 20Time [m<strong>in</strong>]Figure 6.5 Fraction <strong>of</strong> an <strong>in</strong>capacitat<strong>in</strong>g dose for asphyxiant gases analysed dur<strong>in</strong>g<strong>the</strong> four tests <strong>in</strong> <strong>the</strong> Runehamar tunnel.So far <strong>the</strong> discussion has regarded <strong>the</strong> gas composition. However, <strong>the</strong> temperature(heat exposure) also affects an escap<strong>in</strong>g occupant. The heat exposure can cause both<strong>in</strong>capacitation and death due to hyper<strong>the</strong>rmia.The tenability limit for radiant heat flux on sk<strong>in</strong> is, accord<strong>in</strong>g to Purser,approximately 2.5 kW/m 2 [222]. This level was never reached at <strong>the</strong> measurementstation. For convective heat, Purser presents a relationship that is <strong>the</strong> same as <strong>the</strong> onefor a unclo<strong>the</strong>d or lightly clo<strong>the</strong>d person accord<strong>in</strong>g to ISO/TS 13571:2002 [251]:Ft− tn n−1I _ , n=(6.11)conv L7 −3.45 ⋅10T80
6 Gas concentrations <strong>in</strong> <strong>the</strong> tunnelwhere T is <strong>the</strong> gas temperature (°C). In <strong>the</strong> ISO standard <strong>the</strong>re is also an expressionfor exposure <strong>of</strong> convective heat for a fully clo<strong>the</strong>d person:Ft− tn n−1I _ , n=(6.12)conv F8 −3.614.1⋅10T1.51Conv,LConv,FAsphyxiantsAsph. (excl HCN)T11.51T2Conv,LConv,FAsphyxiantsAsph. (excl HCN)FI [-]FI [-]0.50.500 5 10 15 20 25 30Time [m<strong>in</strong>]T31.500 5 10 15 20 25 30Time [m<strong>in</strong>]T41.51Conv,LConv,FAsphyxiantsAsphyxiants (excl HCN)1Conv,LConv,FAsphyxiantsAsphyxiants (excl HCN)FI [-]FI [-]0.50.500 5 10 15 20 25 30Time [m<strong>in</strong>]00 5 10 15 20 25 30Time [m<strong>in</strong>]Figure 6.6 Fraction <strong>of</strong> an <strong>in</strong>capacitat<strong>in</strong>g dose for convective heat exposurecompared with asphyxiant gases for <strong>the</strong> four tests <strong>in</strong> <strong>the</strong> Runehamartunnel.The fraction <strong>of</strong> an <strong>in</strong>capacitat<strong>in</strong>g dose for heat exposure based on <strong>the</strong> Runehamartests is compared with <strong>the</strong> results for asphyxiant gases <strong>in</strong> Figure 6.6. Incapacitat<strong>in</strong>gdose for a lightly clo<strong>the</strong>d person is reached <strong>in</strong> test T1 to T3, but <strong>the</strong> time to thissituation differs. In T1 <strong>the</strong> curve is similar to that for asphyxiant gases without HCN,but lags somewhat. In T2 <strong>the</strong> convection curve is far beh<strong>in</strong>d <strong>the</strong> one for asphyxiantgases. In test T3 <strong>the</strong> curve for convective heat exposure passes <strong>the</strong> asphyxiantcurves. In <strong>the</strong> case with a fully clo<strong>the</strong>d person <strong>the</strong> level <strong>of</strong> <strong>in</strong>capacitat<strong>in</strong>g dose isnever reached <strong>in</strong> <strong>the</strong> cases discussed. It should be remembered that <strong>the</strong> calculationspresented here are based on measurements performed 458 m from <strong>the</strong> seat <strong>of</strong> <strong>the</strong> fire.The effect <strong>of</strong> <strong>the</strong> heat exposure will <strong>in</strong>crease closer to <strong>the</strong> fire. In <strong>the</strong> work presentedby Ingason et al. it was shown that <strong>in</strong> most cases (scenarios) <strong>the</strong> temperature andradiation quickly <strong>in</strong>creases above critical values for <strong>the</strong> occupants <strong>in</strong> <strong>the</strong> tunnel [84].Ano<strong>the</strong>r conclusion from <strong>the</strong> same work was that <strong>the</strong> calculations showed a criticalvalue <strong>of</strong> 75 MW above which it can be difficult for <strong>the</strong> occupants <strong>in</strong> <strong>the</strong> tunnel toreach <strong>the</strong> escape routes and survive <strong>the</strong> fire. If no evacuation is stated, only <strong>the</strong>81
<strong>On</strong> <strong>the</strong> <strong>Characteristics</strong> <strong>of</strong> <strong>Fires</strong> <strong>in</strong> <strong>Tunnels</strong>smallest fire (8 MW) can be survived. Dur<strong>in</strong>g a bus fire (25 MW) critical levels canbe reached after long exposition times and for larger fires <strong>the</strong> critical values arerelatively rapidly reached. The occupants <strong>in</strong> <strong>the</strong> cases <strong>of</strong> no evacuation wereassumed to be ei<strong>the</strong>r 70 m or 150 m from <strong>the</strong> fire.The results given <strong>in</strong> this section should be seen as an example <strong>of</strong> <strong>the</strong> <strong>in</strong>fluence <strong>of</strong> gascomposition and heat on <strong>the</strong> fraction <strong>of</strong> an <strong>in</strong>capacitat<strong>in</strong>g dose. The conditions <strong>in</strong> aspecific situation dur<strong>in</strong>g a fire <strong>in</strong> a tunnel are very complex and several parameters,e.g. <strong>the</strong> degree <strong>of</strong> activity <strong>of</strong> <strong>the</strong> occupants, affect <strong>the</strong> results. It should also be notedthat age and different k<strong>in</strong>ds <strong>of</strong> impairment (e.g. disease and physical conditions)significantly affects <strong>the</strong> critical COHb level (COHb levels found <strong>in</strong> victims) [223].The results do confirm, however, <strong>the</strong> importance <strong>of</strong> <strong>the</strong> first m<strong>in</strong>utes dur<strong>in</strong>g a tunnelfire for <strong>the</strong> ability <strong>of</strong> <strong>the</strong> occupants <strong>in</strong> <strong>the</strong> tunnel to escape <strong>the</strong> <strong>in</strong>cident.82
7 Application <strong>of</strong> <strong>the</strong> results7 Application <strong>of</strong> <strong>the</strong> resultsIn this section <strong>the</strong> importance and application <strong>of</strong> some <strong>of</strong> <strong>the</strong> results described <strong>in</strong> this<strong>the</strong>sis are briefly discussed. An overview <strong>of</strong> a few areas with<strong>in</strong> <strong>the</strong> field <strong>of</strong> fires <strong>in</strong>tunnels is given. The reader should keep <strong>in</strong> m<strong>in</strong>d that <strong>the</strong>se discussions are not exhaustiveand shall be seen as examples <strong>of</strong> how to use <strong>the</strong> results for different applicationsor fur<strong>the</strong>r studies.7.1 Effects on <strong>the</strong> tunnel structureIn <strong>the</strong> Sections 2.2.2 and 3.3 <strong>the</strong> temperature <strong>in</strong> a tunnel dur<strong>in</strong>g different types <strong>of</strong>fires was discussed. The temperature is important for several different processes <strong>in</strong><strong>the</strong> tunnel, e.g. <strong>the</strong> safety and evacuation <strong>of</strong> people (see Section 6.3), fire spread (seeSection 4), <strong>the</strong> possibility <strong>of</strong> <strong>the</strong> rescue service to manage <strong>the</strong> <strong>in</strong>cident, etc. <strong>On</strong>e processthat has ga<strong>in</strong>ed much <strong>in</strong>terest lately is <strong>the</strong> spall<strong>in</strong>g <strong>of</strong> concrete, i.e. <strong>the</strong> almostexplosive dis<strong>in</strong>tegration <strong>of</strong> concrete when exposed to high temperatures. The f<strong>in</strong>d<strong>in</strong>gs<strong>in</strong> Paper I are <strong>of</strong> <strong>in</strong>terest when def<strong>in</strong><strong>in</strong>g what heat load (temperature-time curve)<strong>the</strong> tunnel structure may be exposed to.Spall<strong>in</strong>g and <strong>the</strong> effects on tunnel l<strong>in</strong><strong>in</strong>gs have been proven to be important results <strong>of</strong>fires <strong>in</strong> tunnels (see Table 2.1). The effects <strong>of</strong> spall<strong>in</strong>g <strong>of</strong> rocks was also seen dur<strong>in</strong>g<strong>the</strong> tests <strong>in</strong> <strong>the</strong> Runehamar tunnel, where rocks fell down from <strong>the</strong> ceil<strong>in</strong>g both upstreamand downstream <strong>of</strong> <strong>the</strong> fire [252]. The rocks fall<strong>in</strong>g down upstream <strong>of</strong> <strong>the</strong> fireemphasizes <strong>the</strong> importance <strong>of</strong> <strong>the</strong> backlayer<strong>in</strong>g <strong>in</strong> determ<strong>in</strong><strong>in</strong>g <strong>the</strong> risk to tunneloccupants <strong>of</strong> <strong>the</strong> develop<strong>in</strong>g fire <strong>in</strong>cident. Downstream <strong>of</strong> <strong>the</strong> fire <strong>in</strong> <strong>the</strong> Runehamartunnel <strong>the</strong> road was covered with debris almost all <strong>the</strong> way to <strong>the</strong> measurementstation 458 m from <strong>the</strong> centre <strong>of</strong> <strong>the</strong> fire.Much research is presently underway to improve our understand<strong>in</strong>g <strong>of</strong> <strong>the</strong> spall<strong>in</strong>gbehaviour <strong>of</strong> <strong>the</strong> modern high performance and self-compact<strong>in</strong>g concrete. For fur<strong>the</strong>rdetails on <strong>the</strong> subject <strong>of</strong> spall<strong>in</strong>g see for example references [253-256].7.2 Rescue operationsThe measurements presented above show that after an <strong>in</strong>itial delay <strong>the</strong> <strong>in</strong>crease <strong>in</strong>HRR and temperature is fast and <strong>the</strong> actions undertaken dur<strong>in</strong>g this <strong>in</strong>itial firegrowth are crucial for <strong>the</strong> outcome <strong>of</strong> <strong>the</strong> fire. It is difficult to ext<strong>in</strong>guish an <strong>in</strong>tensefire. The high temperature and radiation associated with an <strong>in</strong>tense fire prevent <strong>the</strong>fire-fighters from com<strong>in</strong>g close enough to <strong>the</strong> seat <strong>of</strong> <strong>the</strong> fire to be able to ext<strong>in</strong>guishit. Tests performed with fire-fighters <strong>in</strong> protective cloth<strong>in</strong>g [257] show that <strong>the</strong>y feelpa<strong>in</strong> after approximately five m<strong>in</strong>utes when exposed to a radiation <strong>of</strong> 5 kW/m 2 . For<strong>the</strong> fire-fighters to withstand radiation dur<strong>in</strong>g a longer time period and to be able tocarry out hard labour, <strong>the</strong> radiation level must be even lower. This can be comparedwith <strong>the</strong> results from <strong>the</strong> Runehamar tests where <strong>the</strong> radiation upstream <strong>of</strong> <strong>the</strong> firewas well above 5 kW/m 2 , 10 m from <strong>the</strong> fire for <strong>the</strong> tests T1 to T3 (see Figure 7.1).At a distance <strong>of</strong> 20 m from <strong>the</strong> fire <strong>the</strong> radiation was 2 kw/m 2 to 3 kW/m 2 <strong>in</strong> <strong>the</strong>setests (see Table 7.1). It is presently not known if fire-fighters would be able to effectivelyfight a large fire from this distance. If <strong>the</strong> fire is not ext<strong>in</strong>guished dur<strong>in</strong>g <strong>the</strong>time period when <strong>the</strong> fire is still small, it may not be able to be ext<strong>in</strong>guished until <strong>the</strong>83
<strong>On</strong> <strong>the</strong> <strong>Characteristics</strong> <strong>of</strong> <strong>Fires</strong> <strong>in</strong> <strong>Tunnels</strong>fire has decreased <strong>in</strong> <strong>in</strong>tensity after its peak – long after egress is an issue for occupants.The <strong>of</strong>ten long distances to <strong>the</strong> seat <strong>of</strong> <strong>the</strong> fire also pose problems for <strong>the</strong> firefighters and if <strong>the</strong>y are to reach <strong>the</strong> fire much personnel and equipment are <strong>of</strong>tenneeded.20T1Heat flux [kW/m 2 ]15105T2T300 10 20 30 40 50Time [m<strong>in</strong>]Figure 7.1 Radiation 10 m from <strong>the</strong> upstream end <strong>of</strong> <strong>the</strong> HGV set-up <strong>in</strong> <strong>the</strong> Runehamartests (T1 to T3).Table 7.1 Peak radiation values upstream <strong>of</strong> <strong>the</strong> HGV fires <strong>in</strong> <strong>the</strong> Runehamartunnel [252, 258]. The distances are measured from <strong>the</strong> upstream end <strong>of</strong><strong>the</strong> HGV set-up.Test idRadiation 5 mupstream <strong>of</strong> <strong>the</strong>fire [kW/m 2 ]Radiation 10 mupstream <strong>of</strong> <strong>the</strong>fire [kW/m 2 ]Radiation 20 mupstream <strong>of</strong> <strong>the</strong>fire [kW/m 2 ]T1 80 14 2T2 35 18 3T3 20 9 2T4 40 10 4 (15 m)Ingason et al. drew <strong>the</strong> conclusion that even a relatively small fire <strong>of</strong> 25 MW canpose problems for fire fighters, depend<strong>in</strong>g on where <strong>the</strong> fire is situated and whe<strong>the</strong>r<strong>the</strong> ext<strong>in</strong>guishment operation needs to be proceeded by a BA operation (BA =breath<strong>in</strong>g apparatus) [84]. For fires <strong>of</strong> sizes 75 MW or higher <strong>the</strong> radiation will beso high that <strong>the</strong> ext<strong>in</strong>guishment work has to be performed at least 15 m to 20 m from<strong>the</strong> fire. This means that a high water flow rate and much equipment are needed. Ageneral conclusion was also that current methods used <strong>in</strong> BA operations are notsuitable for fires <strong>in</strong> tunnels and new methods should be developed.84
7 Application <strong>of</strong> <strong>the</strong> resultsS<strong>in</strong>ce <strong>in</strong> many situations it will be difficult to ext<strong>in</strong>guish <strong>the</strong> fire dur<strong>in</strong>g <strong>the</strong> <strong>in</strong>itialphase or even to reach <strong>the</strong> tunnel <strong>in</strong> time, it is very important that people reactquickly and start <strong>the</strong> evacuation prior to fire brigade <strong>in</strong>tervention. However, typicalhuman behaviour is to sit and wait <strong>in</strong> <strong>the</strong> car to get more <strong>in</strong>formation or for <strong>the</strong>queue to start to move [259]. This wait<strong>in</strong>g can result <strong>in</strong> people not reach<strong>in</strong>g <strong>the</strong>escape routes, shelters or o<strong>the</strong>r safe havens. After <strong>the</strong> fire <strong>in</strong> <strong>the</strong> Mont Blanc tunnelsome victims were found sitt<strong>in</strong>g <strong>in</strong> <strong>the</strong>ir cars with <strong>the</strong>ir seat-belts on.The high temperatures presented <strong>in</strong> Paper I and Paper VII toge<strong>the</strong>r with <strong>the</strong> longflames from large tunnel fires and low visibility makes it almost impossible to attacka fire from <strong>the</strong> downstream side. Ventilation can be an effective tool <strong>in</strong> mak<strong>in</strong>g <strong>the</strong>conditions upstream <strong>of</strong> <strong>the</strong> fire tenable. This tool must, however, be used with cautions<strong>in</strong>ce <strong>the</strong> conditions downstream <strong>of</strong> <strong>the</strong> fire can be made more severe by <strong>the</strong>ventilation and people try<strong>in</strong>g to escape can be trapped <strong>in</strong> <strong>the</strong> flames or fire gases. Inconnection with <strong>the</strong> ventilation it is also important to consider different phenomena,e.g. backlayer<strong>in</strong>g, an <strong>in</strong>crease <strong>of</strong> <strong>the</strong> fire <strong>in</strong>tensity and fire spread, etc. Pulsations <strong>of</strong><strong>the</strong> k<strong>in</strong>d observed <strong>in</strong> two <strong>of</strong> <strong>the</strong> tests <strong>in</strong> <strong>the</strong> Runehamar tunnel (see Section 5.4 andPapers V and VI) have not been reported from any real large-scale fire <strong>in</strong> a tunnel,but under certa<strong>in</strong> conditions such pulsations could occur.7.3 Spr<strong>in</strong>kler and o<strong>the</strong>r water-based ext<strong>in</strong>guishment systemsThe construction and exact use <strong>of</strong> spr<strong>in</strong>kler and o<strong>the</strong>r water-based ext<strong>in</strong>guishmentsystems have not been focused on <strong>in</strong> this <strong>the</strong>sis. However, <strong>the</strong> results <strong>in</strong> Paper VIIshow that <strong>the</strong>re is a significant risk <strong>of</strong> fire spread to a vehicle far from a burn<strong>in</strong>gHGV. This has also been seen <strong>in</strong> real fires, e.g. <strong>in</strong> <strong>the</strong> recent fire <strong>in</strong> <strong>the</strong> Fréjus tunnel.In Japan water ext<strong>in</strong>guishment systems are widely used <strong>in</strong> tunnels and test<strong>in</strong>g hasbeen performed to design and support this use [260, 261]. Similary <strong>in</strong> Australia, <strong>the</strong>use <strong>of</strong> fire suppression systems <strong>in</strong> tunnels is widespread. In Europe, however, <strong>the</strong>rehas been a reluctance to use spr<strong>in</strong>kler <strong>in</strong> tunnels. This reluctance is based on a fear <strong>of</strong><strong>in</strong>creas<strong>in</strong>g <strong>the</strong> hazard <strong>in</strong> <strong>the</strong> tunnel, e.g. destroy<strong>in</strong>g <strong>the</strong> smoke stratification and <strong>the</strong>rebydecreas<strong>in</strong>g <strong>the</strong> visibility, spread<strong>in</strong>g liquid fuel over a larger area and <strong>the</strong>rebyspread<strong>in</strong>g <strong>the</strong> fire, <strong>the</strong> risk for explosion, <strong>the</strong> production <strong>of</strong> steam affect<strong>in</strong>g <strong>the</strong> people<strong>in</strong>side <strong>the</strong> tunnel, etc. The large <strong>in</strong>stallation costs have also played an importantrole.This reluctance to consider <strong>the</strong> <strong>in</strong>stallation <strong>of</strong> ext<strong>in</strong>guishment system has also affected<strong>the</strong> will<strong>in</strong>gness to fund research with<strong>in</strong> this field and until only a few yearsago much <strong>of</strong> <strong>the</strong> experience was based on tests performed <strong>in</strong> 1965 [55]. However, <strong>in</strong>recent years more <strong>in</strong>terest has been paid to <strong>the</strong> benefits <strong>of</strong> ext<strong>in</strong>guishment systems[262]. Large-scale test<strong>in</strong>g has also been performed [60]. In 2004, a large test serieswith ext<strong>in</strong>guishment test was performed with<strong>in</strong> <strong>the</strong> UPTUN project. The results <strong>of</strong>this test series are still to be published.<strong>On</strong>e argument aga<strong>in</strong>st spr<strong>in</strong>kler systems is that <strong>the</strong>y cannot reach <strong>the</strong> seat <strong>of</strong> <strong>the</strong> fireand <strong>the</strong>refore not ext<strong>in</strong>guish <strong>the</strong> fire. However, by reduc<strong>in</strong>g <strong>the</strong> gas temperature and<strong>the</strong> radiation one also dramatically decreases <strong>the</strong> risk for fire spread, which can mean85
<strong>On</strong> <strong>the</strong> <strong>Characteristics</strong> <strong>of</strong> <strong>Fires</strong> <strong>in</strong> <strong>Tunnels</strong><strong>the</strong> difference between a manageable fire and a catastrophic fire. This area,<strong>the</strong>refore, needs fur<strong>the</strong>r attention and studies.86
8 Conclusions8 ConclusionsThe recent catastrophic fires and <strong>the</strong> experimental results from tunnel fire testspresented and discussed <strong>in</strong> this <strong>the</strong>sis have shown <strong>the</strong> high temperatures and heatrelease rates that can be reached dur<strong>in</strong>g such fires, and <strong>the</strong> effect <strong>the</strong>se can have,both on <strong>the</strong> safety <strong>of</strong> people, and on <strong>the</strong> structure <strong>of</strong> <strong>the</strong> tunnels. Experience fromreal fires has shown that HGVs pose special risks when <strong>the</strong>y are <strong>in</strong>volved <strong>in</strong> fires <strong>in</strong>tunnels. The tests <strong>in</strong> <strong>the</strong> Runehamar tunnel show that even non-hazardous goods cangive rise to high HRRs, considerably higher <strong>the</strong>n cited <strong>in</strong> tunnel design guidel<strong>in</strong>es.This also places a focus on <strong>the</strong> fire load and fire behaviour <strong>of</strong> <strong>the</strong> vehicles <strong>in</strong>volved<strong>in</strong> fires <strong>in</strong> tunnels. A correlation between <strong>the</strong> total energy content and <strong>the</strong> maximumHRR has been presented for passenger cars and HGVs, but <strong>the</strong> validation <strong>of</strong> thiscorrelation requires fur<strong>the</strong>r <strong>in</strong>vestigation.Ano<strong>the</strong>r important issue is <strong>the</strong> rapid <strong>in</strong>crease <strong>in</strong> temperature and heat release rateafter an <strong>in</strong>itial development period, e.g. after fire spread from <strong>the</strong> vehicle to <strong>the</strong>cargo <strong>in</strong> an HGV. This means that <strong>the</strong>re is only a short period <strong>of</strong> time for <strong>the</strong>occupants <strong>in</strong> a tunnel to beg<strong>in</strong> evacuation and f<strong>in</strong>d a safe haven. Fur<strong>the</strong>r, <strong>the</strong> toxicitycalculations corroborate this conclusion. It is a question <strong>of</strong> m<strong>in</strong>utes available foregress. This means that occupants need to be quickly aware <strong>of</strong> <strong>the</strong> fire and be able toevacuate by <strong>the</strong>mselves, s<strong>in</strong>ce <strong>the</strong> rescue services seldom are able to reach a tunnelfire <strong>in</strong> <strong>the</strong> short time frame available.It has also been shown <strong>in</strong> <strong>the</strong> Runehamar tests that a fire <strong>in</strong> an HGV can spread along distance downstream, <strong>of</strong> <strong>the</strong> order <strong>of</strong> 100 m. This is approximately <strong>the</strong> samemaximum flame length that was estimated <strong>in</strong> <strong>the</strong> Runehamar tests based on temperaturemeasurements. These results comply very well with what was experienced <strong>in</strong><strong>the</strong> fire <strong>in</strong> <strong>the</strong> Fréjus tunnel <strong>in</strong> June 2005, where <strong>the</strong> fire spread over 100 m betweenvehicles. Based on <strong>the</strong> test results and real <strong>in</strong>cidents one must also emphasize <strong>the</strong> importance<strong>of</strong> <strong>the</strong> operation dur<strong>in</strong>g <strong>the</strong> first five to ten m<strong>in</strong>utes <strong>of</strong> <strong>the</strong> fire. The actions<strong>of</strong> <strong>the</strong> people <strong>in</strong>side <strong>the</strong> tunnel and <strong>the</strong> rescue personnel dur<strong>in</strong>g this time period canbe crucial to <strong>the</strong> outcome.Results presented <strong>in</strong> <strong>the</strong> literature has shown that <strong>the</strong> ventilation significantly affects<strong>the</strong> heat release rate and <strong>the</strong> conditions <strong>in</strong> a tunnel dur<strong>in</strong>g a fire, but it is <strong>of</strong>tendifficult to determ<strong>in</strong>e <strong>the</strong> ventilation conditions related to a certa<strong>in</strong> case or a specific<strong>in</strong>crease <strong>in</strong> <strong>the</strong> HRR. The combustion conditions need to be taken <strong>in</strong>to account whenstudy<strong>in</strong>g <strong>the</strong> effect <strong>of</strong> <strong>the</strong> ventilation on <strong>the</strong> <strong>in</strong>crease <strong>in</strong> HRR and <strong>the</strong> maximum HRR.This needs to be studied fur<strong>the</strong>r.Ventilation can be an important tool for <strong>the</strong> rescue service s<strong>in</strong>ce evacuation <strong>of</strong> smokeimproves <strong>the</strong> operation conditions (e.g. visibility, heat exposure, etc.). However, itcan also make <strong>the</strong> conditions <strong>in</strong>side <strong>the</strong> tunnel more severe by <strong>in</strong>creas<strong>in</strong>g <strong>the</strong> <strong>in</strong>tensity<strong>of</strong> <strong>the</strong> fire, by spread<strong>in</strong>g <strong>the</strong> fire, or by trapp<strong>in</strong>g <strong>the</strong> occupants <strong>in</strong> <strong>the</strong> tunnel <strong>in</strong>smoke and flames. Rescue operations and <strong>the</strong> use <strong>of</strong> fans should, <strong>the</strong>refore, be carefullyplanned <strong>in</strong> advance based on different types <strong>of</strong> fires scenarios. <strong>On</strong>e aim <strong>of</strong> this<strong>the</strong>sis has been to present data and <strong>in</strong>formation that can be used when describ<strong>in</strong>gsuch scenarios and develop<strong>in</strong>g action plans.87
<strong>On</strong> <strong>the</strong> <strong>Characteristics</strong> <strong>of</strong> <strong>Fires</strong> <strong>in</strong> <strong>Tunnels</strong>The radiation level upstream <strong>of</strong> a fire <strong>in</strong> a tunnel can be significant, both due todirect radiation from <strong>the</strong> flames and due to backlayer<strong>in</strong>g. This severely complicatesan ext<strong>in</strong>guishment operation s<strong>in</strong>ce <strong>the</strong> firefighters must try to ext<strong>in</strong>guish <strong>the</strong> firefrom a distance. The backlayer<strong>in</strong>g appears when <strong>the</strong> air velocity is below a criticalvelocity. In <strong>the</strong> Runehamar tests <strong>the</strong> air velocity decreased dur<strong>in</strong>g <strong>the</strong> most <strong>in</strong>tenseperiod <strong>of</strong> <strong>the</strong> fire. Calculations have shown that <strong>the</strong> ma<strong>in</strong> factor <strong>in</strong>fluenc<strong>in</strong>g thisdecrease was <strong>the</strong> <strong>the</strong>rmal resistance due to <strong>the</strong> slope <strong>of</strong> <strong>the</strong> tunnel.Pulsations were observed <strong>in</strong> two <strong>of</strong> <strong>the</strong> Runehamar tests, dur<strong>in</strong>g <strong>the</strong> most <strong>in</strong>tense part<strong>of</strong> <strong>the</strong> fire (when <strong>the</strong> HRR was above 125 MW to 135 MW). This phenomenon hasnever previously been discussed or observed when consider<strong>in</strong>g road or rail tunnelsafety. The reasons for <strong>the</strong> pulsations have been discussed <strong>in</strong> this <strong>the</strong>sis and explanationsfor <strong>the</strong> observed periods <strong>of</strong> <strong>the</strong> pulsations (4 s and 18 s, respectively) weregiven based two different method: an acoustic approach and a frequency analysisbased on an impedance approach. Both methods show that <strong>the</strong> observed periods areresults <strong>of</strong> <strong>the</strong> tunnel as a system. The conditions for <strong>in</strong>stability are ma<strong>in</strong>lydeterm<strong>in</strong>ed by <strong>the</strong> position <strong>of</strong> <strong>the</strong> fire <strong>in</strong> <strong>the</strong> tunnel, <strong>the</strong> HRR, and <strong>the</strong> air flow ratethrough <strong>the</strong> tunnel. These pulsations appeared <strong>in</strong> real scale fire experiments <strong>in</strong> atunnel. This means that <strong>the</strong>re is a risk that this k<strong>in</strong>d <strong>of</strong> pulsations can occur also <strong>in</strong>real fires <strong>in</strong> tunnels. Such a situation could pose an extra threat to <strong>the</strong> people <strong>in</strong>side<strong>the</strong> tunnel, especially <strong>the</strong> rescue personal try<strong>in</strong>g to reach <strong>the</strong> fire from <strong>the</strong> upstreamside.Work with safety <strong>in</strong> tunnels is an ongo<strong>in</strong>g process <strong>in</strong> many countries, on differentlevels, and with<strong>in</strong> different eng<strong>in</strong>eer<strong>in</strong>g fields. Even if research <strong>in</strong> recent years hasimproved our knowledge on fires <strong>in</strong> tunnels and tunnel safety, <strong>the</strong>re is still a need formore knowledge. Some areas where more <strong>in</strong>formation is needed, related to <strong>the</strong> workpresented <strong>in</strong> this <strong>the</strong>sis, are presented <strong>in</strong> <strong>the</strong> next section.88
9 Future work9 Future workTwo <strong>of</strong> <strong>the</strong> most important parameters <strong>in</strong> connection with a fire <strong>in</strong> a tunnel are <strong>the</strong>heat release rate and <strong>the</strong> temperature. These parameters are affected by <strong>the</strong> fuel, <strong>the</strong>geometry <strong>of</strong> <strong>the</strong> fuel, <strong>the</strong> geometry <strong>of</strong> <strong>the</strong> tunnel, <strong>the</strong> ventilation, etc. These effectshave been observed <strong>in</strong> different studies, but <strong>the</strong>re exist very few studies where <strong>the</strong>relationship between <strong>the</strong>se parameters is studied extensively, i.e. systematically variedkeep<strong>in</strong>g o<strong>the</strong>r parameters constant. Such a study is planned, with model scaletests planned <strong>in</strong> <strong>the</strong> beg<strong>in</strong>n<strong>in</strong>g <strong>of</strong> 2006.The effect <strong>of</strong> <strong>the</strong> ventilation on <strong>the</strong> development and maximum size <strong>of</strong> a fire <strong>in</strong> atunnel is <strong>of</strong> particular <strong>in</strong>terest. To better assess <strong>the</strong> effect <strong>of</strong> <strong>the</strong> ventilation, responseto specific conditions, i.e. whe<strong>the</strong>r <strong>the</strong> conditions are well ventilated or under-ventilated,needs to be def<strong>in</strong>ed. A method <strong>of</strong> relat<strong>in</strong>g <strong>the</strong> change <strong>in</strong> HRR as a function <strong>of</strong><strong>the</strong> change <strong>in</strong> air velocity needs to be developed.Dur<strong>in</strong>g two <strong>of</strong> <strong>the</strong> tests <strong>in</strong> <strong>the</strong> Runehamar test series presented <strong>in</strong> this <strong>the</strong>sis, longperiodpulsations were observed. Plausible explanations were given <strong>in</strong> Paper V andPaper VI and <strong>the</strong> results have been compared with <strong>the</strong> f<strong>in</strong>d<strong>in</strong>gs from o<strong>the</strong>r field, e.g.combustion, <strong>in</strong> more detail <strong>in</strong> this <strong>the</strong>sis. This work shows two important parameters.<strong>On</strong>e is <strong>the</strong> transfer function for <strong>the</strong> transfer <strong>of</strong> heat from <strong>the</strong> process to <strong>the</strong> flow fieldand <strong>the</strong> oscillations. The o<strong>the</strong>r is <strong>the</strong> stability limit, which determ<strong>in</strong>es with<strong>in</strong> whatregions <strong>in</strong> <strong>the</strong> HRR – mass flow rate graph <strong>the</strong> system becomes unstable and whereit is stable. Most studies on <strong>the</strong> transfer function and <strong>the</strong> stability limit have beenperformed ei<strong>the</strong>r with premixed combustion or with electrically heated wires <strong>in</strong>side atube. To better understand this phenomena <strong>the</strong>se parameters, <strong>the</strong>refore, need to bestudied under conditions similar to those prevail<strong>in</strong>g dur<strong>in</strong>g fires <strong>in</strong> tunnels, and <strong>the</strong>significance <strong>of</strong> this phenomenon for egress and fire-fight<strong>in</strong>g needs to be established.89
<strong>On</strong> <strong>the</strong> <strong>Characteristics</strong> <strong>of</strong> <strong>Fires</strong> <strong>in</strong> <strong>Tunnels</strong>90
10 References10 References1. Carvel, R. O. and Marlair, G., "A history <strong>of</strong> fire <strong>in</strong>cidents <strong>in</strong> tunnels". In Thehandbook <strong>of</strong> Tunnel Fire Safety (A. N. Beard and R. O. Carvel, Eds.),Thomas Telford Publish<strong>in</strong>g, 3-41, London, UK, 2005.2. "Fire and Smoke Control <strong>in</strong> Road <strong>Tunnels</strong>", PIARC, 05.05B-1999, 1999.3. Andersen, T. and Paaske, B. J., "Railroad and Metro Tunnel Accidents", DetNorske Veritas (DNV), http://home.no.net/lotsberg/artiklar/andersen/en_-table_1.html.4. Thamm, B., "The new EU directive on road tunnel safety", Proceed<strong>in</strong>gs <strong>of</strong><strong>the</strong> International Symposium on Catastrophic Tunnel <strong>Fires</strong>, SP Report2004:05, 19-30, Borås, Sweden, 20-21 November, 2003.5. Ingason, H., "Fire Development <strong>in</strong> Catastrophic Tunnel <strong>Fires</strong> (CTF)",International Symposium on Catastrophic Tunnel <strong>Fires</strong> (CTF), 31-47, Borås,Sweden, 20-21 November, 2003.6. Bettel<strong>in</strong>i, M., Neuenschwander, H., Henke, A., Gagliardi, M., and Ste<strong>in</strong>er,W., "The Fire <strong>in</strong> <strong>the</strong> St Gotthard Tunnel <strong>of</strong> October 24, 2001", InternationalSymposium on Catastrophic Tunnel <strong>Fires</strong> (CTF), 49-68, Borås, Sweden, 20-21 November, 2003.7. "Closure <strong>of</strong> <strong>the</strong> Fréjus tunnel: Europe must ensure that <strong>the</strong> Alps can becrossed more safely and <strong>in</strong> a less pollut<strong>in</strong>g way", IP/05/690, Brussels,Belgium, 2005.8. "Directive 2004/54/EC <strong>of</strong> <strong>the</strong> European Parliament and <strong>of</strong> <strong>the</strong> Council <strong>of</strong> 29April 2004 on m<strong>in</strong>imum safety requirements for tunnels <strong>in</strong> <strong>the</strong> Trans-European Road Network", In Official Journal <strong>of</strong> <strong>the</strong> European Union, 2004.9. Høj, N. P., "Guidel<strong>in</strong>es for Fire Safe Design Compared Fire Safety Featuresfor Road <strong>Tunnels</strong>", 1st International Symposium on Safe & Reliable <strong>Tunnels</strong>,127-138, Prague, Czech Republic, 4-6 February, 2004.10. Zuber, P., "Compared Safety Features for Rail <strong>Tunnels</strong>", 1st InternationalSymposium on Safe & Reliable <strong>Tunnels</strong>, 139-148, Prague, Czech Republic,4-6 February, 2004.11. Gabay, D., "Compared Fire Safety Features for Metro <strong>Tunnels</strong>", 1st InternationalSymposium on Safe & Reliable <strong>Tunnels</strong>, 149-156, Prague, CzechRepublic, 4-6 February, 2004.12. Bendelius, A., "Tunnel ventilation - state <strong>of</strong> <strong>the</strong> art". In The Handbook <strong>of</strong>Tunnel Fire Safety (A. N. Beard and R. O. Carvel, Eds.), Thomas TelfordPublish<strong>in</strong>g, 127-143, London, UK, 2005.13. Heselden, A., "Studies <strong>of</strong> fire and smoke behavior relevant to tunnels", 2ndInt Symp on Aerodynamics and Ventilation <strong>of</strong> Vehicle <strong>Tunnels</strong>, J1-1 -- J1-18, Cambridge, UK, 23-25 March, 1976.14. Heselden, A. J. M., "Studies <strong>of</strong> fire and smoke behaviour relevant totunnels", Build<strong>in</strong>g Research Establishment, CP 66/78, Borehamwood, UK,1978.15. NFPA 502, "Standard for Road <strong>Tunnels</strong>, Bridges, and o<strong>the</strong>r Limited AccessHighways", 2004 ed., National Fire Protection Association, 2004.91
<strong>On</strong> <strong>the</strong> <strong>Characteristics</strong> <strong>of</strong> <strong>Fires</strong> <strong>in</strong> <strong>Tunnels</strong>16. Bendelius, A. and Br<strong>in</strong>ckerh<strong>of</strong>f, P., "The Latest PIARC Road Tunnel Fireand Smoke Control Publications", In Jo<strong>in</strong>t Issue ITA/PIARC <strong>of</strong> Route-Roadson Fire Safety <strong>in</strong> <strong>Tunnels</strong>, 2004.17. Lacroix, D., "New French Recommendations for Fire Ventilation <strong>in</strong> Road<strong>Tunnels</strong>", 9th International Conference on Aerodynamics and Ventilation <strong>of</strong>Vehicle <strong>Tunnels</strong>, Aosta Valley, Italy, 6-8 October, 1997.18. NFPA 502, "Road <strong>Tunnels</strong>, Bridges, and O<strong>the</strong>r Limited Access Highways",2001 ed., National Fire Protection Association, 2001.19. Lacroix, D., "Guidel<strong>in</strong>es for Fire Safe Design: Syn<strong>the</strong>sis and Current HarmonisationProcesses", 1st International Symposium on Safe & Reliable<strong>Tunnels</strong>, 107-115, Prague, Czech Republic, 4-6 February, 2004.20. prEN 45545-2, "Railway application - Fire protection on railway vehicle -Part 2: Requirement for fire behaviour <strong>of</strong> materials and components", 2004-02, CEN/CENELEC/TC, 2004.21. NFPA 130, "Standard for Fixed Guideway Transit and Passenger RailSystems", 2003 ed., 7 August, National Fire Protection Association, 2003.22. Brousse, B., "Comparison <strong>of</strong> Fire Safety Problems for <strong>the</strong> Various TransportModes <strong>in</strong> <strong>Tunnels</strong>", 1st International Symposium on Safe & Reliable <strong>Tunnels</strong>,117-126, Prague, Czech Republic, 4-6 February, 2004.23. ISO 834-1, "Fire-resistance tests - Elements <strong>of</strong> build<strong>in</strong>g construction - Part 1:General requirements", First ed., 1999-09-15, International Organization forStandardization, 1999.24. EN 1363-2, "Fire resistance tests - Part 2: Alternative and additional procedures",First ed., 1999-09-24, European Committee for Standardization,1999.25. "Richtl<strong>in</strong>ien für Ausstattung und Betrieb von Tunneln (RABT)", Ausgabe1985 ed., Forschungsgesellschaft für Straßen- und Verkehrswesen, 1985.26. "Beproev<strong>in</strong>g van het gedrag bij verhitt<strong>in</strong>g van twee isolatiematerialen terbescherm<strong>in</strong>g van tunnels bij brand", Instituut TNO voor Bouwmaterialen enBouwconstructies, B-79-391, Delft, The Ne<strong>the</strong>rlands, 1979.27. "Rapport betreffende de beproev<strong>in</strong>g van het gedrag van twee isolatiematerialenter bescherm<strong>in</strong>g van tunnels tegen brand", Instituut TNO voorBouwmaterialen en Bouwconstructies, Rapport B-80-33, Delft, The Ne<strong>the</strong>rlands,1980.28. "Systems and Equipment for Fire and Smoke Control <strong>in</strong> Road <strong>Tunnels</strong>",PIARC Committee on Road Tunnel Operation (C-5), Work<strong>in</strong>g group No. 6,To be published.29. Lacroix, D. and Haack, A., "PIARC Design Criteria for Resistance to Fire forRoad Tunnel Structures", In Jo<strong>in</strong>t Issue ITA/PIARC <strong>of</strong> Route-Roads on FireSafety <strong>in</strong> <strong>Tunnels</strong>, 2004.30. Russell, H. A., "ITA Guidel<strong>in</strong>es for Structural Fire Resistance <strong>of</strong> Road <strong>Tunnels</strong>",In Jo<strong>in</strong>t Issue ITA/PIARC <strong>of</strong> Route-Roads on Fire Safety <strong>in</strong> <strong>Tunnels</strong>,2004.31. "ATB Tunnel 2004", Vägverket (The Swedish Road Adm<strong>in</strong>istration),Publikation 2004:124, Borlänge, Sweden (<strong>in</strong> Swedish), 2004.92
10 References32. Babrauskas, V. and Peacock, R. D., "Heat Release Rate: The S<strong>in</strong>gle MostImportant Variable <strong>in</strong> Fire Hazard", Fire Safety Journal, 18, 255-272, 1992.33. Huggett, C., "Estimation <strong>of</strong> Rate <strong>of</strong> Heat Release by Means <strong>of</strong> Oxygen ConsumptionMeasurements", Fire and Materials, 4, 2, 61-65, 1980.34. Parker, W. J., "Calculations <strong>of</strong> <strong>the</strong> Heat Release Rate by Oxygen Consumptionfor Varios Applications", National Bureau <strong>of</strong> Standards, NBSIR81-2427, Gai<strong>the</strong>rsburg, USA, 1982.35. Tewarson, A., "Generation <strong>of</strong> Heat and Chemical Compounds <strong>in</strong> <strong>Fires</strong>". InThe SFPE Handbook <strong>of</strong> Fire Protection Eng<strong>in</strong>eer<strong>in</strong>g (P. J. DiNenno, D.Drysdale, C. L. Beyler, W. D. Walton, R. L. P. Custer, J. R. Hall, and J. M.Watts, Eds.), National Fire Protection Association, 3-82 -- 3-161, Qu<strong>in</strong>cy,MA, USA, 2002.36. Lönnermark, A. and Babrauskas, V., "TOXFIRE - Fire <strong>Characteristics</strong> andSmoke Gas Analyses <strong>in</strong> Under-ventilated Large-scale Combustion Experiments:Theoretical Background and Calculations", SP Swedish NationalTest<strong>in</strong>g and Research Institute, SP REPORT 1996:49, Borås, Sweden, 1997.37. Drysdale, D., An Introduction to Fire Dynamics, John Wiley & Sons, 1992.38. Casale, E. and Marlair, G., "Heptane Fire Tests with Forced Ventialtion",Proceed<strong>in</strong>gs <strong>of</strong> <strong>the</strong> International Conference on <strong>Fires</strong> <strong>in</strong> <strong>Tunnels</strong>, 36-50,Borås, Sveden, 10-11 October, 1994.39. Takeda, H. and Akita, K., "Critical Phenomenon <strong>in</strong> Compartment <strong>Fires</strong> withLiquid Fuels", Eighteenth Symposium (International) on Combustion, 519-527, Waterloo, Canada, 17-22 August, 1980.40. Carvel, R. O., Beard, A. N., and Jowitt, P. W., "How Much do <strong>Tunnels</strong>Enhance <strong>the</strong> Heat Release Rate <strong>of</strong> <strong>Fires</strong>", Proc. 4th Int. Conf on Safety <strong>in</strong>Road and Rail <strong>Tunnels</strong>, 457-466, Madrid, Spa<strong>in</strong>, 2-6 April, 2001.41. Saito, N., Yamada, T., Sekizawa, A., Yanai, E., Watanabe, Y., and Miyazaki,S., "Experimental Study on Fire Behavior <strong>in</strong> a W<strong>in</strong>d Tunnel with a ReducedScale Model", Second International Conference on Safety <strong>in</strong> Road and Rail<strong>Tunnels</strong>, 303-310, Granada, Spa<strong>in</strong>, 3-6 April, 1995.42. Ingason, H., "Fire Experiments <strong>in</strong> a Model Tunnel us<strong>in</strong>g Pool <strong>Fires</strong> -Experimental Data", SP Swedish National Test<strong>in</strong>g and Research Institute, SPAR 1995:52, Borås, Sweden, 1995.43. Ingason, H., "Effects <strong>of</strong> Ventilation on Heat Release Rate <strong>of</strong> Pool <strong>Fires</strong> <strong>in</strong> aModel Tunnel", SP Swedish National Test<strong>in</strong>g and Research Institute, SPREPORT 1995:55, Borås, Sweden, 1995.44. Carvel, R. O., Beard, A. N., and Jowitt, P. W., "How Does <strong>the</strong> Shape <strong>of</strong> aTunnel Affect <strong>the</strong> Heat Release Rate <strong>of</strong> a Fire?" Proc. 9th Int. Fire Science &Eng<strong>in</strong>eer<strong>in</strong>g Conf. (Interflam 2001), 1355-1360, Ed<strong>in</strong>burgh, Scotland, 17-19September, 2001.45. Carvel, R. O. and Drysdale, D. D., "The Influence <strong>of</strong> Tunnel Geometry andVentilation on <strong>the</strong> Heat Release Rate <strong>of</strong> a Fire", Fire Technology, 40, 5-26,2004.46. Ingason, H., Nireus, K., and Werl<strong>in</strong>g, P., "Fire Tests <strong>in</strong> a Blasted RockTunnel", FOA, Report FOA-R-97-00581-990-SE, Sweden, 1997.93
<strong>On</strong> <strong>the</strong> <strong>Characteristics</strong> <strong>of</strong> <strong>Fires</strong> <strong>in</strong> <strong>Tunnels</strong>47. Heskestad, G., "Flame Height <strong>of</strong> Fuel Arrays with Combustion <strong>in</strong> Depth",Fire Safety Science - Proceed<strong>in</strong>gs <strong>of</strong> <strong>the</strong> Fifth International Symposium, 427-438, Melbourne, Australia, 3-7 March, 1997.48. "Memorial Tunnel Fire Ventilation Test Program - Test Report", MassachusettsHighway Department and Federal Highway Adm<strong>in</strong>istration, 1995.49. Grant, G. B. and Drysdale, D., "Estimat<strong>in</strong>g Heat Release Rates from LargescaleTunnel <strong>Fires</strong>", Fire Safety Science - Proceed<strong>in</strong>gs <strong>of</strong> <strong>the</strong> Fifth InternationalSymposium, 1213-1224, Melbourne, 1995.50. Enright, T. and Fleischmann, C., "An Uncerta<strong>in</strong>ty Analysis <strong>of</strong> CalorimetricTechniques", Poster Notes - 5th International Symposium on Fire SafetyScience, 1332, Melbourne, Australia, 3-7 March, 1997.51. Enright, P. A. and Fleischmann, C. M., "Uncerta<strong>in</strong>ty <strong>of</strong> Heat Release RateCalculation <strong>of</strong> <strong>the</strong> ISO5660-1 Cone Calrimeter Standard Test Method", FireTechnology, 35, 2, 153-169, 1999.52. Axelsson, J., Andersson, P., Lönnermark, A., Van Hees, P., and Wetterlund,I., "Uncerta<strong>in</strong>ties <strong>in</strong> Measur<strong>in</strong>g Heat and Smoke Release Rates <strong>in</strong> <strong>the</strong>Room/Corner Test and <strong>the</strong> SBI", SP Swedish National Test<strong>in</strong>g and ResearchInstitute, SP REPORT 2001:04, Borås, Sweden, 2001.53. Axelsson, J., Andersson, P., Lönnermark, A., Van Hees, P., and Wetterlund,I., "Uncerta<strong>in</strong>ty <strong>of</strong> HRR and SPR Measurements <strong>in</strong> SBI and Room/cornerTest", 9th International Fire Science & Eng<strong>in</strong>eer<strong>in</strong>g Conference (Interflam2001), 507-518, Ed<strong>in</strong>burgh, Scotland, 17-19 September, 2001.54. "<strong>Fires</strong> <strong>in</strong> Transport <strong>Tunnels</strong>: Report on Full-Scale Tests", edited by StudiensgesellschaftStahlanwendung e. V., EUREKA-Project EU499:FIRETUN,Düsseldorf, Germany, 1995.55. "Schlussbericht der Versuche im Ofenegg Tunnel von 17.5 - 31.5 1965",Kommission für Sicherheitsmassnahmen <strong>in</strong> Strassentunneln, 1965.56. Feizlmayr, A., "Research <strong>in</strong> Austria on tunnel fire, Paper J2, BHRA", 2nd IntSymp on Aerodynamics and Ventilation <strong>of</strong> Vehicle <strong>Tunnels</strong>, 19 - 40, Cambrigde,UK, 1976.57. "State <strong>of</strong> <strong>the</strong> Road Tunnel Equipment <strong>in</strong> Japan - Ventilation, Light<strong>in</strong>g, SafetyEquipment", Public Works Research Institute, Technical note, Vol. 61,Japan, 1993.58. Keski-Rahkonen, O., Holmlund, C., Loikkanen, P., Ludvigsen, H., andMikkola, E., "Two full scale pilot fire experiments <strong>in</strong> a tunnel", TechnicalResearch Centre <strong>of</strong> F<strong>in</strong>land, Research Reports 453, Espoo, F<strong>in</strong>land, 1986.59. Keski-Rahkonen, O., "Tunnel Fire Tests <strong>in</strong> F<strong>in</strong>land", Proceed<strong>in</strong>gs <strong>of</strong> <strong>the</strong>International Conference on <strong>Fires</strong> <strong>in</strong> <strong>Tunnels</strong>, 222 -237, Borås, 10 - 11 October1994, 1994.60. Lemaire, A., van de Leur, P. H. E., and Kenyon, Y. M., "Safety Proef: TNOMet<strong>in</strong>gen Beneluxtunnel - Meetrapport", TNO, TNO-Rapport 2002-CVB-R05572, 2002.61. Haerter, A., "Fire Tests <strong>in</strong> <strong>the</strong> Ofenegg-Tunnel <strong>in</strong> 1965", International Conferenceon <strong>Fires</strong> <strong>in</strong> <strong>Tunnels</strong>, SP REPORT 1994:54, 195-214, Borås, Sweden,10-11 October, 1994.94
10 References62. ILF, "Brandversuche <strong>in</strong> e<strong>in</strong>em Tunnel", Ingenieurgeme<strong>in</strong>schaft Lässer-Feizlmayr; Bundesm<strong>in</strong>isterium f. Bauten u. Technik, Strassenforschung,P0244, 1976.63. Pucher, K., "Fire Tests <strong>in</strong> <strong>the</strong> Zwenberg Tunnel (Austria)", InternationalConference on <strong>Fires</strong> <strong>in</strong> <strong>Tunnels</strong>, 187-194, Borås, Sweden, 1994.64. Kunikane, Y., Kawabata, N., Ishikawa, T., Takekuni, K., and Shimoda, A.,"Thermal Fumes and Smoke Induced by Bus Fire Accident <strong>in</strong> Large CrossSectional Tunnel", The fifth JSME-KSME Fluids Eng<strong>in</strong>eer<strong>in</strong>g Conference,Nagoya, Japan, 17-21 November, 2002.65. "Project 'Safety Test' - Report on Fire Tests", Directorate-General for PublicWorks and Water Management, Utrecht, The Ne<strong>the</strong>rlands, 2002.66. Ingason, H. and Lönnermark, A., "Heat Release Rates and Temperaturesdur<strong>in</strong>g <strong>Fires</strong> <strong>in</strong> <strong>Tunnels</strong>", To be submitted.67. Carvel, R. O. and Marlair, G., "A history <strong>of</strong> tunnel fire experiments". In Thehandbook <strong>of</strong> tunnel fire safety (A. N. Beard and R. O. Carvel, Eds.), ThomasTelford Publish<strong>in</strong>g, 201-230, London, 2005.68. Ingason, H. and Lönnermark, A., "Recent Achievements Regard<strong>in</strong>g Measur<strong>in</strong>g<strong>of</strong> Time-heat and Time-temperature Development <strong>in</strong> <strong>Tunnels</strong>", 1st InternationalSymposium on Safe & Reliable <strong>Tunnels</strong>, Prague, Czech Republic, 4-6 February, 2004.69. Mangs, J. and Keski-Rahkonen, O., "Characterization <strong>of</strong> <strong>the</strong> Fire Behavior <strong>of</strong>a Burn<strong>in</strong>g Passenger Car. Part I: Car Fire Experiments", Fire Safety Journal,23, 17-35, 1994.70. Mangs, J. and Keski-Rahkonen, O., "Characterization <strong>of</strong> <strong>the</strong> Fire Behavior <strong>of</strong>a Burn<strong>in</strong>g Passenger Car. Part II: Parametrization <strong>of</strong> Measured Rate <strong>of</strong> HeatRelease Curves", Fire Safety Journal, 23, 37-49, 1994.71. Ste<strong>in</strong>ert, C., "Smoke and Heat Production <strong>in</strong> Tunnel <strong>Fires</strong>", The InternationalConference on <strong>Fires</strong> <strong>in</strong> <strong>Tunnels</strong>, 123-137, Borås, Sweden, 10-11 October,1994.72. Ste<strong>in</strong>ert, C., "Experimentelle Untersuchhungen zum Abbrand-und Feuerubersprungsverhaltenvon Personenkraftwagen", vfdb-Zeitschrift, Forschung,Technik und Management im Brandschutz, 4, 163-172, 2000.73. Shipp, M. and Spearpo<strong>in</strong>t, M., "Measurements <strong>of</strong> <strong>the</strong> Severity <strong>of</strong> <strong>Fires</strong> Involv<strong>in</strong>gPrivate Motor Vehicles", Fire and Materials, Vol. 19, 143-151,1995.74. Joyeux, D., "Development <strong>of</strong> Design Rules for Steel Structures Subjected toNatural <strong>Fires</strong> <strong>in</strong> Closed Car Parks", Centre Technique Industriel de laConstruction Métallique, INC-96/294d-DJ/VG, Sa<strong>in</strong>t-Rémy-lès-Chevreuse,France, 1997.75. Ingason, H., "Heat Release Rate Measurements <strong>in</strong> Tunnel <strong>Fires</strong>", InternationalConference on <strong>Fires</strong> <strong>in</strong> <strong>Tunnels</strong>, 86-103, Borås, Sweden, October 10-11, 1994, 1994.76. Ingason, H. and Lönnermark, A., "Fire development <strong>of</strong> Large Vehicles <strong>in</strong>Road <strong>Tunnels</strong>", Proceed<strong>in</strong>gs <strong>of</strong> <strong>the</strong> Fifth International Conference on Tunnelfires, 203-212, London, UK, 25-27 October, 2004.95
<strong>On</strong> <strong>the</strong> <strong>Characteristics</strong> <strong>of</strong> <strong>Fires</strong> <strong>in</strong> <strong>Tunnels</strong>77. Barber, C., Gard<strong>in</strong>er, A., and Law, M., "Structural Fire Design <strong>of</strong> <strong>the</strong>Øresund Tunnel", Proceed<strong>in</strong>gs <strong>of</strong> <strong>the</strong> International Conference on <strong>Fires</strong> <strong>in</strong><strong>Tunnels</strong>, 313-332, Borås, Sweden, 10-11 October, 1994.78. Ingason, H., Gustavsson, S., and Dahlberg, M., "Heat Release Rate Measurements<strong>in</strong> Tunnel <strong>Fires</strong>", SP Swedish National Test<strong>in</strong>g and Research Institute,SP Report 1994:08, Borås, Sweden, 1994.79. Wickström, U., "Application <strong>of</strong> <strong>the</strong> Standard Fire Curve for Express<strong>in</strong>gNatural <strong>Fires</strong> for Design Purposes". In Fire Safety: Science and Eng<strong>in</strong>eer<strong>in</strong>g,ASTM STP 882 (T. Z. Harmathy, Ed.), American Society for Test<strong>in</strong>g andMaterials, 145-159, Philadelphia, USA, 1985.80. ISO, "Revision <strong>of</strong> ISO - 1975. Fire resistance tests - Elements <strong>of</strong> build<strong>in</strong>gconstruction. Part 3 - Guidance on test method and test data application.Third Draft", ISO, ISO TC92/SC2/WG1 N270, 1987.81. Wickström, U., "Expression for <strong>the</strong> HC curve based on a sum <strong>of</strong> exponentialfunctions", Personal communication, Borås, Sweden, 2005.82. Wickström, U., "Natural <strong>Fires</strong> for Design <strong>of</strong> Steel and Concrete Structures -A Swedish Approach", International Symposium on Fire Eng<strong>in</strong>eer<strong>in</strong>g forBuild<strong>in</strong>g Structures and Safety, 67-72, Melbourne, Australia, 14-15 November,1989.83. Carvel, R. O., Beard, A. N., and Jowitt, P. W., "The Influence <strong>of</strong> Longitud<strong>in</strong>alVentilation and Tunnel Size on HGV <strong>Fires</strong> <strong>in</strong> Tunnel", 10th InternationalFire Science & Eng<strong>in</strong>eer<strong>in</strong>g Conference (Interflam 2004), 815-820, Ed<strong>in</strong>burgh,Scotland, 5-7 July, 2004.84. Ingason, H., Bergqvist, A., Lönnermark, A., Frantzich, H., and Hasselrot, K.,"Räddn<strong>in</strong>gs<strong>in</strong>satser i vägtunnlar", Räddn<strong>in</strong>gsverket, P21-459/05 (<strong>in</strong> Swedish),2005.85. Carlotti, P. and Voeltzel, A., "The impact <strong>of</strong> wall heat<strong>in</strong>g on longitud<strong>in</strong>alventilation", Tunnel Management International, 7, 2, 40-46, 2004.86. Ingason, H. and Lönnermark, A., "Ventilation <strong>of</strong> <strong>the</strong> Runehamar tunneltests", To be submitted.87. Rew, C. and Deaves, D., "Fire spread and flame length <strong>in</strong> ventilated tunnels -a model used <strong>in</strong> Channel tunnel assessments", Proceed<strong>in</strong>gs <strong>of</strong> <strong>the</strong> InternationalConference on Tunnel <strong>Fires</strong> and Escape from <strong>Tunnels</strong>, 397-406,Lyon, France, 5-7 May, 1999.88. Beyler, C. L., "Fire Plumes and Ceil<strong>in</strong>g Jets", Fire Safety Journal, 11, 53-75,1986.89. McCaffrey, B., "Flame height". In The SFPE Handbook <strong>of</strong> Fire ProtectionEng<strong>in</strong>eer<strong>in</strong>g (P. J. DiNenno, Ed.), National Fire Protection Association, 2-1 -- 2-8, 1995.90. Heskestad, G., "Fire Plumes, Flame Height, and Air Entraiment". In TheSFPE Handbook <strong>of</strong> Fire Protection Eng<strong>in</strong>eer<strong>in</strong>g (P. J. DiNenno, Ed.), NationalFire Protection Association, 2-1 -- 2-17, Qu<strong>in</strong>cy, Massachusetts, USA,2002.91. Heskestad, G., "Lum<strong>in</strong>ous Heights <strong>of</strong> Turbulent Diffusion Flames", FireSafety Journal, 5, 103-108, 1983.96
10 References92. Heskestad, G., "Dynamics <strong>of</strong> <strong>the</strong> Fire Plume", Phil. Trans. R. Soc. Lond.,356, 2815-2833, 1998.93. Zukoski, E. E., "Fluid Dynamic Aspects <strong>of</strong> Room <strong>Fires</strong>", Proceed<strong>in</strong>gs <strong>of</strong> <strong>the</strong>First International Symposium on Fire Safety Science, 1-30, Gai<strong>the</strong>rsburg,USA, 7-11 October, 1985.94. Babrauskas, V., "Flame Lengths under Ceil<strong>in</strong>g", Fire and Materials, 4, 3,119-126, 1980.95. Heskestad, G. and Hamada, T., "Ceil<strong>in</strong>g Jets <strong>of</strong> Strong Fire Plumes", FireSafety Journal, 21, 69-82, 1993.96. Alpert, R. L., "Calculation <strong>of</strong> Response Time <strong>of</strong> Ceil<strong>in</strong>g- Mounted FireDetectors", Fire Technology, 8, 3, 181-195, 1972.97. Alpert, R. L., "Ceil<strong>in</strong>g Jet Flows". In SFPE Handbook <strong>of</strong> Fire ProtectionEng<strong>in</strong>eer<strong>in</strong>g (P. J. DiNenno, Ed.), National Fire Protection Association, 2-18-- 2-31, Qu<strong>in</strong>cy, MA, USA, 2002.98. Sugawa, O., Satoh, H., and Oka, Y., "Flame Height from Rectangular FireSources Consider<strong>in</strong>g Mix<strong>in</strong>g Factor", Proceed<strong>in</strong>gs <strong>of</strong> <strong>the</strong> Third InternationalSymposium on Fire safety Science, 435-444, Ed<strong>in</strong>burgh, Scotland, 8-12 July,1991.99. Oka, Y., "Flame Behaviour <strong>in</strong> a Tunnel", Third International Conference onSafety <strong>in</strong> Road and Rail <strong>Tunnels</strong>, 159-168, Nice, France, 9-11 March, 1998.100. Delichatsios, M. A., "The Flow <strong>of</strong> Fire Gases under a Beamed Ceil<strong>in</strong>g",Combustion and Flame, 43, 1-10, 1981.101. Motevalli, V. and Ricciuti, C., "Characterization <strong>of</strong> <strong>the</strong> Conf<strong>in</strong>ed Ceil<strong>in</strong>g Jet<strong>in</strong> <strong>the</strong> Presence <strong>of</strong> an Upper Layer <strong>in</strong> Transient and Steady-State Conditions",NIST, NIST-GCR-92-613, Gai<strong>the</strong>rsburg, Maryland, USA, 1992.102. Yuan, Z. P. and Motevalli, V., "Steady State Ceil<strong>in</strong>g Jet Behavior under anUnconf<strong>in</strong>ed Ceil<strong>in</strong>g with Beams", SFPE Bullet<strong>in</strong>, September/October, 6-12,1994.103. Newman, J. S. and Tewarson, A., "Flame Propagation <strong>in</strong> Ducts", Combustionand Flame, 51, 347-355, 1983.104. McAdams, W. H., Heat Transmission, 3rd ed., McGraw-Hill, New York,1954.105. Kuwana, H., "Scale Effect on Temperature Properties <strong>in</strong> Tunnel Fire", ThirdInternational Conference on Safety <strong>in</strong> Road and Rail <strong>Tunnels</strong>, 87-96, Nice,France, 9-11 March, 1998.106. Beard, A. N., Drysdale, D. D., and Bishop, S. R., "A Non-l<strong>in</strong>ear Model <strong>of</strong>Major Fire Spread <strong>in</strong> a Tunnel", Fire Safety Journal, 24, 333-357, 1995.107. Beard, A. N., "A Model for Predict<strong>in</strong>g Fire Spread <strong>in</strong> <strong>Tunnels</strong>", Journal <strong>of</strong>Fire Sciences, 15, July/August, 277-307, 1997.108. Beard, A. N., "Major Fire Spread <strong>in</strong> a Tunnel: A Non-l<strong>in</strong>ear Model", FourthInternational Conference on Safety <strong>in</strong> Road and Rail <strong>Tunnels</strong>, 467-476,Madrid, Spa<strong>in</strong>, 2-6 April, 2001.109. Beard, A. N., "Major Fire Spread <strong>in</strong> a Tunnel: A Non-l<strong>in</strong>ear Model withFlame Imp<strong>in</strong>gement", Proceed<strong>in</strong>gs <strong>of</strong> <strong>the</strong> 5th International Conference onSafety <strong>in</strong> Road and Rail <strong>Tunnels</strong>, 511-521, Marseille, France, 6-10 October,2003.97
<strong>On</strong> <strong>the</strong> <strong>Characteristics</strong> <strong>of</strong> <strong>Fires</strong> <strong>in</strong> <strong>Tunnels</strong>110. Beard, A. N., "Major Fire Spread <strong>in</strong> a Tunnel, Assum<strong>in</strong>g Flame Imp<strong>in</strong>gement:Effect <strong>of</strong> Separation and Ventilation Velocity", Fifth InternationalConference on Tunnel <strong>Fires</strong>, 317-326, London, UK, 25-27 October, 2004.111. Kurioka, H., Oka, Y., Satoh, H., and Sugawa, O., "Fire properties <strong>in</strong> nearfield <strong>of</strong> square fire source with longitud<strong>in</strong>al ventilation <strong>in</strong> tunnels", FireSafety Journal, 38, 319-340, 2003.112. Apte, V. B., Green, A. R., and Kent, J. H., "Pool Fire Plume Flow <strong>in</strong> a Large-Scale W<strong>in</strong>d Tunnel", Proceed<strong>in</strong>gs <strong>of</strong> <strong>the</strong> Third International Symposium onFire Safety Science, 425-434, Ed<strong>in</strong>burgh, Scotland, 8-12 July, 1991.113. Bettis, R. J., Jagger, S. F., and Wu, Y., "Interim Validation <strong>of</strong> Tunnel FireConsequence Models: Summary <strong>of</strong> Phase 2 Tests", Health and SafetyExecutive, IR/L/FR/93/11, Buxton, Derbyshire, UK, 1993.114. Carvel, R. O., Beard, A. N., and Jowitt, P. W., "The Influence <strong>of</strong>Longitud<strong>in</strong>al Ventilation on Fire Spread between HGV <strong>Fires</strong> <strong>in</strong> <strong>Tunnels</strong>",Fifth International Conference on Tunnel <strong>Fires</strong>, 307-316, London, UK, 25-27October, 2004.115. Br<strong>in</strong>son, A., "Fire <strong>in</strong> French Tunnel Kills Two", Eurospr<strong>in</strong>kler, 2005.116. Beard, A. N., "Requirements for acceptable model use", Fire Safety Journal,40, 477-484, 2005.117. Jagger, S. and Grant, G., "Use <strong>of</strong> tunnel ventilation for fire safety". In TheHandbook <strong>of</strong> Tunnel Fire Safety (A. N. Beard and R. O. Carvel, Eds.),Thomas Telford Publish<strong>in</strong>g, 144-183, London, UK, 2005.118. Guigas, X., Wea<strong>the</strong>rill, A., Trottet, Y., Casale, E., and Houseaux, B., "TheNew Ventilation Systems <strong>of</strong> <strong>the</strong> Mont Blanc Tunnel. Specificities and Performances<strong>of</strong> <strong>the</strong> Fire Ventilation", Fourth International Conference on Tunnel<strong>Fires</strong>, 105-113, Basel Switzerland, 2-4 December, 2002.119. Brichet, N., Wea<strong>the</strong>rill, A., Crausaz, B., and Casale, E., "The New VentilationSystems <strong>of</strong> <strong>the</strong> Mont Blanc Tunnel Active Smoke Control: FromSimulation to Successful Operation", Fourth International Conference onTunnel <strong>Fires</strong>, 95-104, Basel Switzerland, 2-4 December, 2002.120. Casale, E., Brousse, B., Wea<strong>the</strong>rill, A., and Marlier, E., "Full Scale Fire TestsPerformed <strong>in</strong> <strong>the</strong> Mont Blanc Tunnel - Evaluation <strong>of</strong> <strong>the</strong> Efficiency <strong>of</strong> <strong>the</strong>Fully Automatic Ventilation Responses", Fourth International Conference on<strong>Fires</strong> <strong>in</strong> <strong>Tunnels</strong>, 313 - 325, Basel, Switzerland, 2-4 December, 2002.121. Brousse, B. and Voeltzel, A., "Comparison <strong>of</strong> <strong>the</strong> Performance <strong>of</strong> <strong>the</strong> SmokeClear<strong>in</strong>g System <strong>of</strong> <strong>the</strong> Mont Blanc Tunnel before and after RenovationWorks", Proceed<strong>in</strong>gs <strong>of</strong> <strong>the</strong> Fifth International Conference on Safety <strong>in</strong> Roadand Rail <strong>Tunnels</strong>, 49-58, Marseille, France, 6-10 October, 2003.122. Carvel, R. O., Beard, A. N., and Jowitt, P. W., "The Effect <strong>of</strong> ForcedLongitud<strong>in</strong>al Ventilation on a HGV Fire <strong>in</strong> a Tunnel", Proceed<strong>in</strong>gs <strong>of</strong> <strong>the</strong>International Conference on Tunnel <strong>Fires</strong> and Escape from <strong>Tunnels</strong>, 191-199,Lyon, France, 5-7 May, 1999.123. French, S. E., "EUREKA 499 - HGV Fire Test (Nov. 1992) - SummaryReport". In Proceed<strong>in</strong>gs <strong>of</strong> <strong>the</strong> International Conference on <strong>Fires</strong> <strong>in</strong> <strong>Tunnels</strong>(E. Ivarson, Ed.), SP Swedish National Test<strong>in</strong>g and Research Institute, 63-85,Borås, Sweden, 1994.98
10 References124. Bettis, R. J., Jagger, S. F., and Moodie, K., "Reduced Scale Simulations <strong>of</strong><strong>Fires</strong> <strong>in</strong> Partially Blocked <strong>Tunnels</strong>", Proceed<strong>in</strong>gs <strong>of</strong> <strong>the</strong> International Conferenceon <strong>Fires</strong> <strong>in</strong> <strong>Tunnels</strong>, 162-186, Borås, Sweden, 10-11 October, 1994.125. Huijben, J. W., "The Influence <strong>of</strong> Longitud<strong>in</strong>al Ventilation on Fire Size andDevelopment", Fourth International Conference on Tunnel <strong>Fires</strong>, 115-124,Basel Switzerland, 2-4 December, 2002.126. Carvel, R. O., Beard, A. N., Jowitt, P. W., and Drysdale, D. D., "Variation <strong>of</strong>Heat Release Rate with Forced Longitud<strong>in</strong>al Ventilation for Vehicle <strong>Fires</strong> <strong>in</strong><strong>Tunnels</strong>", Fire Safety Journal, 36, 6, 569-596, 2001.127. Carvel, R. O., Beard, A. N., and Jowitt, P. W., "The Influence <strong>of</strong> Longitud<strong>in</strong>alVentilation on Fire Size <strong>in</strong> Tunnel: Update", Fifth International Conferenceon safety <strong>in</strong> Road and Rail <strong>Tunnels</strong>, 431-440, Marseille, France, 6-10October, 2003.128. Carvel, R. O., Beard, A. N., and Jowitt, P. W., "A Bayesian Estimation <strong>of</strong> <strong>the</strong>Effect <strong>of</strong> Forced Ventilation on a Pool Fire <strong>in</strong> a Tunnel", Civil. Eng. and Env.Syst., 18, 279-302, 2001.129. Ingason, H. and Werl<strong>in</strong>g, P., "Experimental Study <strong>of</strong> Smoke Evacuation <strong>in</strong> aModel Tunnel", FOA Defence Research Establishment, FOA-R--99-01267-311--SE, Tumba, Sweden, 1999.130. Babrauskas, V., "Heat <strong>of</strong> Combustion and Potential Heat". In Heat Release <strong>in</strong><strong>Fires</strong> (V. Babrauskas and S. J. Grayson, Eds.), E & FN Spon, London, UK,1995.131. Babrauskas, V., "Burn<strong>in</strong>g rates". In In SFPE Handbook <strong>of</strong> Fire ProtectionEng<strong>in</strong>eer<strong>in</strong>g P. J. DiNenno, C. L. Beyler, R. L. P. Custer, P. D. Walton, J. M.Watts, D. D. Drysdale, and J. R. Hall, Eds.), The Natioanl Fire ProtectionAssociation, USA, 3.1 - 3.15, 1995.132. Lönnermark, A., Blomqvist, P., Månsson, M., and Persson, H., "TOXFIRE -Fire <strong>Characteristics</strong> and Smoke Gas Analysis <strong>in</strong> Under-ventilated Large-scaleCombustion Experiments: Tests <strong>in</strong> <strong>the</strong> ISO 9705 Room", SP Swedish NationalTest<strong>in</strong>g and Research Institute, SP REPORT 1996:45, Borås, Sweden,1997.133. Liew, S. K. and Deaves, D. M., "Eurotunnel HGV fire on 18th November1996 - Fire devlopment and effects", Proceed<strong>in</strong>gs <strong>of</strong> <strong>the</strong> third InternationalConference on Safety <strong>in</strong> Road and Rail <strong>Tunnels</strong>, 29-40, Nice, France, 1998.134. Malhotra, H. L., "Goods Vehicle Fire Test <strong>in</strong> a Tunnel", Second <strong>in</strong>ternationalConference on Safety <strong>in</strong> Road and Rail <strong>Tunnels</strong>, 237-244, Granada, Spa<strong>in</strong>, 3-6 April, 1995.135. Richter, E. and Vauquel<strong>in</strong>, O., "Description <strong>of</strong> Measur<strong>in</strong>g Techniques used <strong>in</strong><strong>the</strong> Eureka-project", Proceed<strong>in</strong>gs <strong>of</strong> <strong>the</strong> International Conference on <strong>Fires</strong> <strong>in</strong><strong>Tunnels</strong>, 20-35, Borås, Sweden, 10-11 October, 1994.136. Ingason, H. and Lönnermark, A., "Large-scale Fire Tests <strong>in</strong> <strong>the</strong> Runehamartunnel - Heat Release Rate (HRR)", International Symposium on CatastrophicTunnel <strong>Fires</strong> (CTF), SP Report 2004:05, p.81-92, Borås, Sweden, 20-21November, 2003.137. Ingason, H., "Estimation <strong>of</strong> heat release rates <strong>in</strong> Runehamar tests", SPSwedish National Test<strong>in</strong>g and Research Institute, Borås, Sweden, 2003.99
<strong>On</strong> <strong>the</strong> <strong>Characteristics</strong> <strong>of</strong> <strong>Fires</strong> <strong>in</strong> <strong>Tunnels</strong>138. Cullis, C. F., "The Involvement <strong>of</strong> Oxygen <strong>in</strong> <strong>the</strong> Primary DecompositionStage <strong>of</strong> Polymer Combustion", Fire Safety Science - Proceed<strong>in</strong>gs <strong>of</strong> <strong>the</strong>First International Symposium, 371-380, Gai<strong>the</strong>rsburg, MD, USA, 7-11October, 1985.139. Carvel, R. O., Beard, A. N., and Jowitt, P. W., "CERBERUS: A New Modelto Estimate Size and Spread for <strong>Fires</strong> <strong>in</strong> <strong>Tunnels</strong> with Longitud<strong>in</strong>alVentilation", Proc. Int. Conf. on Tunnel Safety & Ventilation, NewDeveleopments <strong>in</strong> Tunnel Safety, 69-76, Graz, Austria, 8-10 April, 2002.140. Carvel, R. O., Beard, A. N., and Jowitt, P. W., "HGV <strong>Fires</strong> <strong>in</strong> <strong>Tunnels</strong>: HowSevere are They and under what Conditions will They Spread", FourthInternational Conference on Tunnel <strong>Fires</strong>, 171-177, Basel Switzerland, 2-4December, 2002.141. Thomas, P. H., "The Movement <strong>of</strong> Smoke <strong>in</strong> Horizontal Passages Aga<strong>in</strong>st anAir Flow", Fire Research Station, Fire Research Note No 723, 1968.142. de Ris, J., "Duct <strong>Fires</strong>", Combustion and Science Technology, 2, 239-258,1970.143. H<strong>in</strong>kley, P. L., "The Flow <strong>of</strong> Hot Gases Along an Enclosed Shopp<strong>in</strong>g Mall -A Tentative Theory", Fire Research Station, Fire Research Note No 807,1970.144. Danziger, N. H. and Kennedy, W. D., "Longitud<strong>in</strong>al Ventilation Analysis for<strong>the</strong> Glenwood Canyon <strong>Tunnels</strong>", Fourth International Symposium on <strong>the</strong>Aerodynamics & Ventilation <strong>of</strong> Vehicle <strong>Tunnels</strong>, 169-186, York, UK, 23-25March, 1982.145. Guelzim, A., Souil, J. M., Vantelon, J. P., Son, D. K., Gabay, D., and Dallest,D., "Modell<strong>in</strong>g <strong>of</strong> a Reverse Layer <strong>of</strong> Fire-Induced Smoke <strong>in</strong> a Tunnel",Proceed<strong>in</strong>gs <strong>of</strong> <strong>the</strong> Fourth International Symposium on Fire Safety Science,277-288, Ottawa, Canada, 13-17 June, 1994.146. Oka, Y. and Atk<strong>in</strong>son, G. T., "Control <strong>of</strong> Smoke Flow <strong>in</strong> Tunnel <strong>Fires</strong>", FireSafety Journal, 25, 305-322, 1995.147. Atk<strong>in</strong>son, G. T., and Wu, Y., "Smoke Control <strong>in</strong> Slop<strong>in</strong>g <strong>Tunnels</strong>", FireSafety Journal, 27, 335-341, 1996.148. Kunikane, Y., Kawabata, N., Okukawa, S., Okubo, K., and Shimoda, A.,"Influence <strong>of</strong> Stationary Vehicles on Backlayer<strong>in</strong>g <strong>Characteristics</strong> <strong>of</strong> FirePlume <strong>in</strong> a Large Cross Section Tunnel", Proceed<strong>in</strong>gs <strong>of</strong> <strong>the</strong> Fifth InternationalConference on Safety <strong>in</strong> Road and Rail <strong>Tunnels</strong>, 599-608, Marseille,France, 6-10 October, 2003.149. Kunsch, J. P., "Simple Model for Control <strong>of</strong> Fire Gases <strong>in</strong> a VentilatedTunnel", Fire Safety Journal, 37, 67-81, 2002.150. Wu, Y. and Bakar, M. Z. A., "Control <strong>of</strong> smoke flow <strong>in</strong> tunnel fires us<strong>in</strong>glongitud<strong>in</strong>al ventilation systems - a study <strong>of</strong> <strong>the</strong> critical velocity", Fire SafetyJournal, 35, 363-390, 2000.151. Grant, G. B., Jagger, S. F., and Lea, C. J., "<strong>Fires</strong> <strong>in</strong> tunnels", Phil. Trans. R.Soc. Lond., 356, 2873-2906, 1998.152. Casale, E. and Biollay, H., "A Fully Controlled Ventilation Response <strong>in</strong> <strong>the</strong>Case <strong>of</strong> a Tunnel Fire. The 'Conf<strong>in</strong>ement' Velocity", Proceed<strong>in</strong>gs <strong>of</strong> <strong>the</strong>100
10 ReferencesFourth International Conference on Safety <strong>in</strong> Road and Rail <strong>Tunnels</strong>, 477-485, Madrid, Spa<strong>in</strong>, 2-6 April, 2001.153. Telle, D., Vauquel<strong>in</strong>, O., and Biollay, H., "An Experimental Evaluation <strong>of</strong><strong>the</strong> ", Fourth International Conference on Tunnel<strong>Fires</strong>, 161-170, Basel Switzerland, 2-4 December, 2002.154. Vauquel<strong>in</strong>, O. and Telle, D., "Def<strong>in</strong>ition and experimental evaluation <strong>of</strong> <strong>the</strong>smoke "conf<strong>in</strong>ement velocity" <strong>in</strong> tunnel fires", Fire Safety Journal, 40, 320-330, 2005.155. McCaffrey, B. J., "Purely Buoyant Diffusion Flames: Some ExperimentalResults", National Bureau <strong>of</strong> Standards, NBSIR 79-1910, Wash<strong>in</strong>gton, D.C.,USA, 1979.156. Cetegen, B. M. and Ahmed, T. A., "Experiments on <strong>the</strong> Periodic Instability<strong>of</strong> Buoyant Plumes and Pool <strong>Fires</strong>", Combustion and Flame, 93, 157-184,1993.157. Malalasekera, W. M. G., Versteeg, H. K., and Gilchrist, K., "A Review <strong>of</strong>Research and an Experimental Study on <strong>the</strong> Pulsation <strong>of</strong> Buoyant DiffusionFlames and Pool <strong>Fires</strong>", Fire and Materials, 20, 261-271, 1996.158. Weckman, E. J. and Sobiesiak, A., "The Oscillatory Behaviour, <strong>of</strong> MediumscalePool <strong>Fires</strong>", Twenty-Second Symposium (International) on Combustion,1299-1310, 1988.159. Ham<strong>in</strong>s, A., Yang, J. C., and Kashiwagi, T., "An Experimental Investigation<strong>of</strong> <strong>the</strong> Pulsation Frequency <strong>of</strong> Flames", Twenty-fourth Symposium (International)on Combustion, 1695-1702, 1992.160. Kim, K. I., Ohtani, H., and Uehara, Y., "Experimental Study on Oscillat<strong>in</strong>gBehaviour <strong>in</strong> a Small-Scale Compartment Fire", Fire Safety Journal, 20, 377-384, 1993.161. Utiskul, Y., Qu<strong>in</strong>tiere, J. G., Rangwala, A. S., R<strong>in</strong>gwelski, B. A., Wakatsuki,K., and Naruse, T., "Compartment fire phenomena under limited ventilation",Fire Safety Journal, 40, 367-390, 2005.162. Fleischmann, C. M., Pagni, P. J., and Williamson, R. B., "Exploatory BackdraftExperiments", Fire Technology, 29, 298-316, 1993.163. Gottuk, D. T., Peatross, M. J., Farley, J. P., and Williams, F. W., "Thedevelopment and mitigation <strong>of</strong> backdraft: a real-scale shipboard study", FireSafety Journal, 33, 261-282, 1999.164. Prétrel, H. and Such, J. M., "Pressure Variations Induced by Large ScalePool <strong>Fires</strong> <strong>in</strong> Forced-Ventilated Enclosures", 9th International Fire Science &Eng<strong>in</strong>eer<strong>in</strong>g Conference (Interflam 2001), 1429-1434, Ed<strong>in</strong>burgh, Scotland,17-19 September, 2001.165. Prétrel, H., Mélis, S., M<strong>in</strong>etian, S., and Querre, P., "Experimental Observations<strong>of</strong> Pressure Instabilities dur<strong>in</strong>g a Pool Fire <strong>in</strong> a Conf<strong>in</strong>ed andVentilated Enclosure", 4th Int. Sem. on Fire and Explosion Hazards,Londonderry, Nor<strong>the</strong>rn Ireland, 8-12 September, 2003.166. Tang, Y. M., Waldherr, G., Jagoda, J. I., and Z<strong>in</strong>n, B. T., "Heat ReleaseTim<strong>in</strong>g <strong>in</strong> a Nonpremixed Helmholtz Pulse Combustor", Combustion andFlame, 100, 251-261, 1995.101
<strong>On</strong> <strong>the</strong> <strong>Characteristics</strong> <strong>of</strong> <strong>Fires</strong> <strong>in</strong> <strong>Tunnels</strong>167. L<strong>in</strong>dholm, A., "Pulsat<strong>in</strong>g Combustion - Combustion <strong>Characteristics</strong> and Reduction<strong>of</strong> Emissions", In Department <strong>of</strong> Heat and Power Eng<strong>in</strong>eer<strong>in</strong>g, LundInstitute <strong>of</strong> Technology, Lund, Sweden, 1999.168. Tyndall, J., Sound, Sixth ed., Longmans, Green, and Co., London, 1895.169. Higg<strong>in</strong>s, B., "<strong>On</strong> <strong>the</strong> Sound Produced by a Current <strong>of</strong> Hydrogen Gas Pass<strong>in</strong>gthrough a Tube", Nicholson's Journal <strong>of</strong> Natural Philosophy, 50, 129, 1802.170. Richardson, E. G., "The Theory <strong>of</strong> <strong>the</strong> S<strong>in</strong>g<strong>in</strong>g Flame", Proc. Phys. Soc.(London), 35, 47-55, 1922.171. Wood, A., Acoustics, Blackie & Son, Glasgow, 1943.172. Jones, A. T., "S<strong>in</strong>g<strong>in</strong>g Flames", The Journal <strong>of</strong> <strong>the</strong> Acoustical Society <strong>of</strong>America, 16, 4, 254-266, 1945.173. Rayleigh, J. W. S., "The Explanation <strong>of</strong> Certa<strong>in</strong> Acoustical Phenomena",Nature, July, 319-321, 1878.174. Putnam, A. A., Combustion-Driven Oscillations <strong>in</strong> Industry, AmericanElsevier Publish<strong>in</strong>g Company Inc., New York, 1971.175. Castro, I. P., "Vortex shedd<strong>in</strong>g from a r<strong>in</strong>g <strong>in</strong> oscillatory flow", Journal <strong>of</strong>W<strong>in</strong>d Eng<strong>in</strong>eer<strong>in</strong>g and Industrial Aerodynamics, 69-71, 387-398, 1997.176. Schadow, K. C. and Gutmark, E., "Combustion Instability Related to VortexShedd<strong>in</strong>g <strong>in</strong> Dump Combustors and <strong>the</strong>ir Passive Control", Progress <strong>in</strong>Energy and Combustion Science, 18, 117-132, 1992.177. Putnam, A. A., Belles, F. E., and Kentfield, J. A. C., "Pulse Combustion",Progress <strong>in</strong> Energy and Combustion Science, 12, 43-79, 1986.178. Z<strong>in</strong>n, B. T., "Pulsat<strong>in</strong>g Combustion". In Advanced Combustion Methods (F.We<strong>in</strong>berg, J., Ed.), Academic Press, 113-181, London, 1986.179. Keller, J. O., Bramlette, T. T., Barr, P. K., and Alvarez, J. R., "NO x and COEmissions from a Pulse Combustor Operat<strong>in</strong>g <strong>in</strong> a Lean Premixed Mode",Combustion and Flame, 99, 460-466, 1994.180. Lundgren, E., Marksten, U., and Möller, S.-I., "The Enhancement <strong>of</strong> HeatTransfer <strong>in</strong> <strong>the</strong> Tail Pipe <strong>of</strong> a Pulse Combustor", Proceed<strong>in</strong>gs <strong>of</strong> <strong>the</strong> 27thSymposium (International) on Combustion, 3215-3220, Boulder, Colorado,USA, 2-7 August, 1998.181. Culick, F. E. C., "Nonl<strong>in</strong>ear behavior <strong>of</strong> acoustic waves <strong>in</strong> combustionchambers - I", Acta Astronautica, 3, 715-734, 1976.182. Culick, F. E. C., "Nonl<strong>in</strong>ear behavior <strong>of</strong> acoustic waves <strong>in</strong> combustion chambers- II", Acta Astronautica, 3, 735-757, 1976.183. Dowl<strong>in</strong>g, A. P., "Nonl<strong>in</strong>ear self-excited oscillations <strong>of</strong> a ducted flame",Journal <strong>of</strong> Fluid Mechanics, 346, 271-290, 1997.184. Langhorne, P. J., "Reheat buzz: an acoustical coupled combustion <strong>in</strong>stability.Part 1. Experiment", Journal <strong>of</strong> Fluid Mechanics, 193, 417-443, 1988.185. Bloxsidge, G. J., Dowl<strong>in</strong>g, A. P., and Langhorne, P. J., "Reheat buzz: anacoustically coupled combustion <strong>in</strong>stability. part 2. Theory", Journal <strong>of</strong> FluidMechanics, 193, 445-473, 1988.186. Dowl<strong>in</strong>g, A. P., "The Calculation <strong>of</strong> Thermoacoustic Oscillations", Journal<strong>of</strong> Sound and Vibration, 180, 4, 557-581, 1995.102
10 References187. Dowl<strong>in</strong>g, A. P., "A k<strong>in</strong>ematic model <strong>of</strong> a ducted flame", Journal <strong>of</strong> FluidMechanics, 394, 51-72, 1999.188. Macquisten, M. A. and Dowl<strong>in</strong>g, A. P., "Low-frequency Combustion Oscillations<strong>in</strong> a Model Afterburner", Combustion and Flame, 94, 253-264, 1993.189. Culick, F. E. C., "Combustion Instabilities <strong>in</strong> Liquid-fueled PropulsionSystems - An Overview", AGARD Conference Proceed<strong>in</strong>gs 1988:450, 1-1 --1-73, 1988.190. Chu, Y.-C., Dowl<strong>in</strong>g, A. P., and Glover, K., "Robust Control <strong>of</strong> CombustionOscillations", Proceed<strong>in</strong>gs <strong>of</strong> <strong>the</strong> 1998 IEEE International Conference onControl Applications, 1165-1169, Trieste, Italy, 1-4 September, 1998.191. Fleifil, M., Annaswamy, A. M., Ghoniem, A. F., and Ghoniem, Z. A.,"Active Control <strong>of</strong> Thermoacoustic Instability <strong>in</strong> Combustion Systems",Proceed<strong>in</strong>gs <strong>of</strong> <strong>the</strong> 4th IEEE Conference on Control Applications, 685-696,Albany, New York, USA, 28-29 September, 1995.192. Annaswamy, A. M., El Rifai, O. M., Fleifil, M., and Ghoniem, A. F., "AModel-Based Active-Adaptive Controller for Thermoacoustic Instability",Proceed<strong>in</strong>gs <strong>of</strong> <strong>the</strong> 1997 IEEE International Conference on ControlApplications, 842-847, Hartford, CT, USA, 5-7 October, 1997.193. Rumsey, J. W., Fleifil, M., Annaswamy, A. M., Hathout, J.-P., and Ghoniem,A. F., "The Role <strong>of</strong> Active Control <strong>in</strong> Suppress<strong>in</strong>g Thermoacoustic Instability",Proceed<strong>in</strong>gs <strong>of</strong> <strong>the</strong> American Control Conference, 2697-2702, Albuquerque,New Mexico, USA, June, 1997.194. Hathout, J.-P., Fleifil, M., Rumsey, J. W., Annaswamy, A. M., and Ghoniem,A. F., "Model-Based Analysis and Design <strong>of</strong> Active Control <strong>of</strong> ThermoacousticInstability", Proceed<strong>in</strong>gs <strong>of</strong> <strong>the</strong> 1997 IEEE International Conferenceon Control Applications, 830-835, Hartford, CT, USA, 5-7 October, 1997.195. Rumsey, J. W., Fleifil, M., Annaswamy, A. M., and Ghoniem, A. F., "LoworderNonl<strong>in</strong>ear Models <strong>of</strong> Thermoacoustic Instabilities and Model-basedControl", Proceed<strong>in</strong>gs <strong>of</strong> <strong>the</strong> 1998 IEEE International Conference on ControlApplications, 1419-1423, Trieste, Italy, 1-4 September, 1998.196. Fleifil, M., Annaswamy, A. M., Rumsey, J. W., Kojic, A., and Ghoniem, A.F., "A Physically Based Nonl<strong>in</strong>ear Model <strong>of</strong> Combustion Instability andActive Control", Proceed<strong>in</strong>gs <strong>of</strong> <strong>the</strong> 1998 IEEE International Conference onControl Applications, 1185-1189, Trieste, Italy, 1-4 September, 1998.197. Fleifil, M., Annaswamy, A. M., Hathout, J.-P., and Ghoniem, A. F.,"Reduced-Order Dynamic Models for Control <strong>of</strong> Reactive Fluid-flows",Proceed<strong>in</strong>gs <strong>of</strong> <strong>the</strong> 38th Conference on Decision & Control, 2857-2862,Phoenix, Arizona, USA, December, 1999.198. Annaswamy, A. M., Fleifil, M., Rumsey, J. W., Prasanth, R., Hathout, J.-P.,and Ghoniem, A. F., "Thermoacoustic Instability: Model-Based OptimalControl Design and Experimental Validation", IEEE Transactions on ControlSystems Technology, 8, 6, 905-918, 2000.199. Paschereit, C. O., Gutmark, E., and Weisenste<strong>in</strong>, W., "Acoustic Control <strong>of</strong>Combustion Instabilities and Emissions <strong>in</strong> a Gas-Turb<strong>in</strong>e Combustor",Proceed<strong>in</strong>gs <strong>of</strong> <strong>the</strong> 1998 IEEE International Conference on ControlApplications, 1175-1179, Trieste, Italy, 1-4 September, 1998.103
<strong>On</strong> <strong>the</strong> <strong>Characteristics</strong> <strong>of</strong> <strong>Fires</strong> <strong>in</strong> <strong>Tunnels</strong>200. Rijke, P. L., "Notiz über e<strong>in</strong>e neue Art, die <strong>in</strong> e<strong>in</strong>er an beiden Enden <strong>of</strong>fenenRörhre enthaltene Luft <strong>in</strong> Sw<strong>in</strong>gungen zu versetzen", Annalen der Physik undChemie, 107, 339-343, 1859.201. Neur<strong>in</strong>ger, J. L., and Hudson, G. E., "An Investigation <strong>of</strong> Sound Vibrations<strong>in</strong> a Tube Conta<strong>in</strong><strong>in</strong>g a Heat Source", The Journal <strong>of</strong> <strong>the</strong> Acoustical Society<strong>of</strong> America, 24, 6, 667-674, 1952.202. Carrier, G. F., "The Mechanics <strong>of</strong> <strong>the</strong> Rijke Tube", Quarterly AppliedMa<strong>the</strong>matics, 12, 4, 383-395, 1955.203. Mal<strong>in</strong>g Jr, G. C., "Simplified Analysis <strong>of</strong> <strong>the</strong> Rijke Phenomenon", Journal <strong>of</strong><strong>the</strong> Acoustical Society <strong>of</strong> America, 35, 1058-1060, 1963.204. Feldman Jr, K. T., "Review <strong>of</strong> <strong>the</strong> Literature on Rijke ThermoacousticPhenomena", Journal <strong>of</strong> Sound and Vibration, 7, 1, 83-89, 1968.205. Kwon, Y.-P. and Lee, B.-H., "Stability <strong>of</strong> <strong>the</strong> Rijke <strong>the</strong>rmoacoustic oscillation",Journal <strong>of</strong> <strong>the</strong> Acoustical Society <strong>of</strong> America, 78, 4, 1414-1420, 1985.206. Carvalho Jr., J. A., Ferreira, M. A., Bressan, C., and Ferreira, J. L. G.,"Def<strong>in</strong>ition <strong>of</strong> Heater Location to Drive Maximum Amplitude AcousticOscillations <strong>in</strong> a Rijke Tube", Combustion and Flame, 76, 17-27, 1989.207. Heckl, M. A., "Non-l<strong>in</strong>ear Acoustic Effects <strong>in</strong> <strong>the</strong> Rijke Tube", Acustica, 72,63-71, 1990.208. Yoon, H.-G., Peddieson Jr, J., and Purdy, K. R., "Ma<strong>the</strong>matical model<strong>in</strong>g <strong>of</strong>a generalized Rijke tube", International Journal <strong>of</strong> Eng<strong>in</strong>eer<strong>in</strong>g Science, 36,1235-1264, 1998.209. Hantschk, C.-C. and Vortmeyer, D., "Numerical Simulation <strong>of</strong> Self-excitedThermoacoustic Instabilities <strong>in</strong> a Rijke Tube", Journal <strong>of</strong> Sound andVibration, 277, 3, 511-522, 1999.210. Yoon, H.-G., Peddieson, J., and Purdy, K. R., "Non-l<strong>in</strong>ear response <strong>of</strong> ageneralized Rijke tube", International Journal <strong>of</strong> Eng<strong>in</strong>eer<strong>in</strong>g Science, 39,1707-1723, 2001.211. Pun, W., "Measurements <strong>of</strong> Thermo-Acoustic Coupl<strong>in</strong>g", California Institute<strong>of</strong> Technology, Pasadena, California, USA, 2001.212. Agost<strong>in</strong>o, F., Bald<strong>in</strong>i, G., Bittanti, S., Poncia, G., Prandoni, W., andScarpell<strong>in</strong>i, M., "Nonl<strong>in</strong>ear Identification <strong>of</strong> Thermoacoustic Instabilitieswith Limit Cycles <strong>in</strong> a Rijke Tube", Proceed<strong>in</strong>gs <strong>of</strong> <strong>the</strong> 2002 IEEE InternationalConference on Control Applications, 1147-1152, Glasgow, Scotland,18-20 September, 2002.213. Entezam, B., Van Moorhem, W. K., and Majdalani, J., "Two-dimensionalNumerical Verification <strong>of</strong> <strong>the</strong> Unsteady Thermoacoustic Field <strong>in</strong>side a RijkePulse Combustor", Numerical Heat Transfer, Part A, 41, 245-262, 2002.214. F<strong>in</strong>l<strong>in</strong>son, J. C., Nelson, M. A., and Beckstead, M. W., "Characterization <strong>of</strong> aModified Rijke Burner for Measurement <strong>of</strong> Distributed Combustion", 24thJANNAF Combustion Meet<strong>in</strong>g, 13-25, 1987.215. Matveev, K., "Thermoacoustic Instabilities <strong>in</strong> <strong>the</strong> Rijke Tube: Experimentsand Model<strong>in</strong>g", California Institute <strong>of</strong> Technology, Pasadena, California,USA, 2003.104
10 References216. Bittanti, S., De Marco, A., Poncia, G., and Prandoni, W., "Identification <strong>of</strong> aModel for Thermoacoustic Instabilities <strong>in</strong> a Rijke Tube", IEEE Transactionson Control Systems Technology, 10, 4, 490-502, 2002.217. Matveev, K. I., "Energy consideration <strong>of</strong> <strong>the</strong> nonl<strong>in</strong>ear effects <strong>in</strong> a Rijketube", Journal <strong>of</strong> Fluids and Structures, 18, 783-794, 2003.218. Wylie, E. B., and Streeter, V. L., Fluid Transients, McGraw-Hill Inc., USA,1978.219. Simonson, M., Tuov<strong>in</strong>en, H., and Emanuelsson, V., "Formation <strong>of</strong> HydrogenCyanide <strong>in</strong> <strong>Fires</strong> - A Literature and Experimental Investigation", SP SwedishNational Test<strong>in</strong>g and Research Institute, SP REPORT 2000:27, Borås,Sweden, 2000.220. Purser, D. A., "Toxic product yields and hazard assessment for fully encloseddesign fires", Polymer International, 49, 1232-1255, 2000.221. Ferrari, L. A., Arado, M. G., Giannuzzi, L., Mastrantonio, G., and Guatelli,M. A., "Hydrogen cyanide and carbon monoxide <strong>in</strong> blood <strong>of</strong> convicted dead<strong>in</strong> a polyurethane combustion: a proposition for <strong>the</strong> data analysis", ForensicScience International, 121, 140-143, 2001.222. Purser, D. A., "Toxicity Assessment <strong>of</strong> Combustion Products". In SFPEHandbook <strong>of</strong> Fire Protection Eng<strong>in</strong>eer<strong>in</strong>g (P. J. DiNenno, Ed.), National FireProtection Association, Inc, 2-83 -- 2-171, Qu<strong>in</strong>cy, Massachusetts, USA,2002.223. Nelson, G. L., "Carbon Monoxide and Fire Toxicity: A Review and Analysis<strong>of</strong> Recent Work", Fire Technology, 34, 1, 39-58, 1998.224. Gann, R. G., "Sublethal Effects <strong>of</strong> Fire Smoke", Fire Technology, 40, 95-99,2004.225. Persson, B., Simonson, M., and Månsson, M., "Utsläpp från bränder tillatmosfären", SP Sveriges Provn<strong>in</strong>gs- och Forskn<strong>in</strong>gs<strong>in</strong>stitut, SP RAPPORT1995:70, Borås, Sweden (<strong>in</strong> Swedish), 1995.226. Blomqvist, P., Persson, B., and Simonson, M., "Utsläpp från bränder tillmiljön - Utsläpp av diox<strong>in</strong>, PAH och VOC till luften", Räddn<strong>in</strong>gsverket(Swedish Rescue Services Agency), P21-407/02, Karlstad, Sweden (<strong>in</strong>Swedish), 2002.227. Persson, B. and Simonson, M., "Fire Emissions <strong>in</strong>to <strong>the</strong> Atmosphere", FireTechnology, 34, 3, 266-279, 1998.228. Hölemann, H., "Environmental Problems Caused by <strong>Fires</strong> and Fire-Figth<strong>in</strong>gAgents", Fire Safety Science - Proceed<strong>in</strong>gs <strong>of</strong> <strong>the</strong> Fourth InternationalSymposium, 61-77, Ottawa, Canada, 13-17 June, 1994.229. Ahrens, M. and Rohr, K. D., "Fire and <strong>the</strong> Environment: Issues and Events",Proceed<strong>in</strong>gs <strong>of</strong> <strong>the</strong> Fire Risk and Hazard Assessment Research ApplicationSymposium, Baltimore, Maryland, USA, 9-11 July, 2003.230. Marlair, G., Simonson, M., and Gann, R. G., "Environmental Concerns <strong>of</strong><strong>Fires</strong>: Facts, Figures, Questions and New Challenges for <strong>the</strong> Future", 10thInternational Fire Science & Eng<strong>in</strong>eer<strong>in</strong>g Conference (Interflam 2004), 325-337, Ed<strong>in</strong>burgh, Scotland, 5-7 July, 2004.105
<strong>On</strong> <strong>the</strong> <strong>Characteristics</strong> <strong>of</strong> <strong>Fires</strong> <strong>in</strong> <strong>Tunnels</strong>231. Wichmann, H., Lorenz, W., and Bahadir, M., "Release <strong>of</strong> PCDD/F and PAHdur<strong>in</strong>g Vehicle <strong>Fires</strong> <strong>in</strong> Traffic <strong>Tunnels</strong>", Chemosphere, 31, 2, 2755-2766,1995.232. Maur<strong>in</strong>g, T., Personal communication, Åndalsnes, Norway, 2003.233. Nilsen, A. R., L<strong>in</strong>dvik, P. A., and Log, T., "Full-scale Fire Test<strong>in</strong>g <strong>in</strong> Sub SeaPublic Road <strong>Tunnels</strong>", Interflam 2001, 913-924, Ed<strong>in</strong>burgh, Scotland, 17-19September, 2001.234. Pitts, W. M., "The Global Equivalence Ratio Concept and <strong>the</strong> Prediction <strong>of</strong>Carbon Monoxide Formation <strong>in</strong> Enclosure <strong>Fires</strong>", National Institute <strong>of</strong>Standards and Technology, NIST Monograph 179, Gai<strong>the</strong>rsburg, MD, USA,1994.235. Beyler, C. L., "Major Species Production by Diffusion Flames <strong>in</strong> a Two-layerCompartment Fire Environment", Fire Safety Journal, 10, 47-56, 1986.236. Gottuk, D. T., "Carbon Monoxide Production <strong>in</strong> Compartment <strong>Fires</strong>",Journal <strong>of</strong> Fire Protection Eng<strong>in</strong>eer<strong>in</strong>g, 4, 4, 133-150, 1992.237. Gottuk, D. T. and Lattimer, B. Y., "Effect <strong>of</strong> Combustion Conditions onSpecies Production". In SFPE Handbook <strong>of</strong> Fire Protection Eng<strong>in</strong>eer<strong>in</strong>g (P.J. DiNenno, Ed.), National Fire Protection Association, Inc, 2-54 -- 2-82,Qu<strong>in</strong>cy, Massachusetts, USA, 2002.238. Babrauskas, V., Parker, W. J., Mulholland, G., and Twilley, W. H., "The phimeter: A simple, fuel-<strong>in</strong>dependent <strong>in</strong>strument for monitor<strong>in</strong>g combustionequivalence ratio", Rev. Sci Instrum., 65, 7, 2367-2375, 1994.239. Ingason, H., "Fire Dynamics <strong>in</strong> <strong>Tunnels</strong>". In The Handbook <strong>of</strong> Tunnel FireSafety (R. O. Carvel and A. N. Beard, Eds.), Thomas Telford Publish<strong>in</strong>g,231-266, London, 2005.240. Gottuk, D. T., Roby, R. J., and Beyler, C. L., "The Role <strong>of</strong> Temperature onCarbon Monoxide Production <strong>in</strong> Compartment <strong>Fires</strong>", Fire Safety Journal,24, 315-331, 1995.241. Tsuchiya, Y., "CO/CO 2 Ratios <strong>in</strong> Fire", Fire Safety Science - Proceed<strong>in</strong>gs <strong>of</strong><strong>the</strong> Fourth International Symposium, 515-526, Ottawa, Canada, 13-17 June,1994.242. Beyler, C. L., "Major Species Production by Solid Fuels <strong>in</strong> a Two LayerCompartment Fire Environment", Fire Safety Science - Proceed<strong>in</strong>gs <strong>of</strong> <strong>the</strong>First International Symposium, 431-440, Gai<strong>the</strong>rsburg, USA, 7-11 October,1985.243. Varon, J., Marik, P. E., Fromm, R. E., and Gueler, A., "Carbon MonoxidePoison<strong>in</strong>g: A Review for Cl<strong>in</strong>icians", The Journal <strong>of</strong> Emergency Medic<strong>in</strong>e,17, 1, 87-93, 1999.244. Brandt, A. B., "Presentation <strong>of</strong> test result from large scale fire tests at <strong>the</strong>Runehamar tunnel", International Symposium on Catastrophic Tunnel <strong>Fires</strong>(CTF), SP Report 2004:05, 117-120, Borås, Sweden, 20-21 November, 2003.245. Lighty, J. S. and Persh<strong>in</strong>g, D. W., "Control <strong>of</strong> Pollutant Emissions fromWaste Burn<strong>in</strong>g", University <strong>of</strong> Utah, Project number AQ93-4, 1993.246. Risholm-Sundman, M., and Vest<strong>in</strong>, E., "Emissions dur<strong>in</strong>g combustion <strong>of</strong>particleboard and glued veneer", Holz als Roh- und Werkst<strong>of</strong>f, 63, 179-185,2005.106
10 References247. Grønli, M., "A Theoretical and Experimental Study <strong>of</strong> <strong>the</strong> Thermal Degradation<strong>of</strong> Biomass", In Department <strong>of</strong> Thermal Energy and Hydropower, TheNorwegian University <strong>of</strong> Science and Technology, Trondheim, Norway,1996.248. Zevenhoven, R., Axelsen, E. P., Kilp<strong>in</strong>en, P., and Hupa, M., "Nitrogenoxides from nitrogen-conta<strong>in</strong><strong>in</strong>g waste fuels at FBC conditions - Part 1", The39th IEA FBC meet<strong>in</strong>g, Madrid, Spa<strong>in</strong>, 22-24 November, 1999.249. Tuov<strong>in</strong>en, H. and Blomqvist, P., "Modell<strong>in</strong>g <strong>of</strong> Hydrogen Cyanide Formation<strong>in</strong> Room <strong>Fires</strong>", SP Swedish National Test<strong>in</strong>g and Research Institute, SPREPORT 2003:10, Borås, Sweden, 2003.250. Hansson, K.-M., Samuelsson, J., Tull<strong>in</strong>, C., and Åmand, L.-E., "Formation <strong>of</strong>HNCO, HCN, and NH 3 from <strong>the</strong> pyrolysis <strong>of</strong> bark and nitrogen-conta<strong>in</strong><strong>in</strong>gmodel compounds", Combustion and Flame, 137, 265-277, 2004.251. ISO/TS 13571:2002(E), "Life-threaten<strong>in</strong>g components <strong>of</strong> fire - Guidel<strong>in</strong>esfor <strong>the</strong> estimation <strong>of</strong> time available for escape us<strong>in</strong>g fire data", First ed.,2002-08-01, ISO, 2002.252. Lönnermark, A. and Ingason, H., "Large Scale Fire Tests <strong>in</strong> <strong>the</strong> RunehamarTunnel - Gas Temperature and Radiation", International Symposium onCatastrophic Tunnel <strong>Fires</strong> (CTF), SP Report 2004:05, p. 93-103, Borås,Sweden, 20-21 November, 2003.253. Harmathy, T. Z., Fire Safety Design and Concrete, Longman Scientific &Technical, 1993.254. Boström, L., "Spall<strong>in</strong>g <strong>of</strong> Tunnel Structure L<strong>in</strong><strong>in</strong>gs - New Swedish Results",International Symposium on Catastrophic Tunnel <strong>Fires</strong> (CTF), 69-79, Borås,Sweden, 2003.255. Boström, L., "Methodology for Measurement <strong>of</strong> Spall<strong>in</strong>g <strong>of</strong> Concrete", Fireand Materials 2005, 121-129, Fisherman's Wharf, San Francisco, USA, 31Jan. - 1 Feb., 2005.256. Høj, N. P. and Pedersen, L., "Full Scale Tests for Assessment <strong>of</strong> Fire Risk",Third International Conference on Safety <strong>in</strong> Road and Rail <strong>Tunnels</strong>, 225-236,Nice, France, 9-11 March, 1998.257. Persson, H., "Basutrustn<strong>in</strong>g för skumsläckn<strong>in</strong>g - Försöksresultat och rekommendationersom underlag för dimensioner<strong>in</strong>g och utförande", SP SwedishNational Test<strong>in</strong>g and Research Institute, SP RAPPORT 1990:36, Borås,Sweden (<strong>in</strong> Swedish), 1990.258. Lemaire, T., "Runehamar Tunnel Fire Tests: Radiation, Fire Spread and BackLayer<strong>in</strong>g", International Symposium on Catastrophic Tunnel <strong>Fires</strong> (CTF), SPReport 2004:05, 105-116, Borås, Sweden, 20-21 November, 2003.259. Frantzich, H., "Problems <strong>of</strong> evacuation <strong>in</strong> catastrophic tunnel fires", InternationalSymposium on Catastrophic Tunnel <strong>Fires</strong> (CTF), 177-185, Borås,Sweden, 2003.260. Setoyama, S., Ichikawa, A., Shimizu, K., Gunki, S., and Kimura, T.,"Effective Operation <strong>of</strong> Water Spray System for a Tunnel Fire", Proceed<strong>in</strong>gs<strong>of</strong> <strong>the</strong> Fifth International Conference on Safety <strong>in</strong> Road and Rail <strong>Tunnels</strong>,547-551, Marseille, France, 6-10 October, 2003.107
<strong>On</strong> <strong>the</strong> <strong>Characteristics</strong> <strong>of</strong> <strong>Fires</strong> <strong>in</strong> <strong>Tunnels</strong>261. Yoshimochi, T., Gunki, S., Kobayashi, A., and Yokota, M., "Full ScaleTest<strong>in</strong>g and Ma<strong>in</strong>tenance <strong>of</strong> Water Spray<strong>in</strong>g Equipment <strong>in</strong> a Large Tunnel",Proceed<strong>in</strong>gs <strong>of</strong> <strong>the</strong> Fifth International Conference on Safety <strong>in</strong> Road and Rail<strong>Tunnels</strong>, 565-572, Marseille, France, 6-10 October, 2003.262. Arvidson, M., "Alternative Fire Spr<strong>in</strong>kler Systems for Roadway <strong>Tunnels</strong>",Proceed<strong>in</strong>gs <strong>of</strong> <strong>the</strong> International Symposium on Catastrophic Tunnel <strong>Fires</strong>,193-201, Borås, Sweden, 20-21 November, 2003.108