KYMA SHIP PERFORMANCE - Net
KYMA SHIP PERFORMANCE - Net
KYMA SHIP PERFORMANCE - Net

Create successful ePaper yourself
Turn your PDF publications into a flip-book with our unique Google optimized e-Paper software.
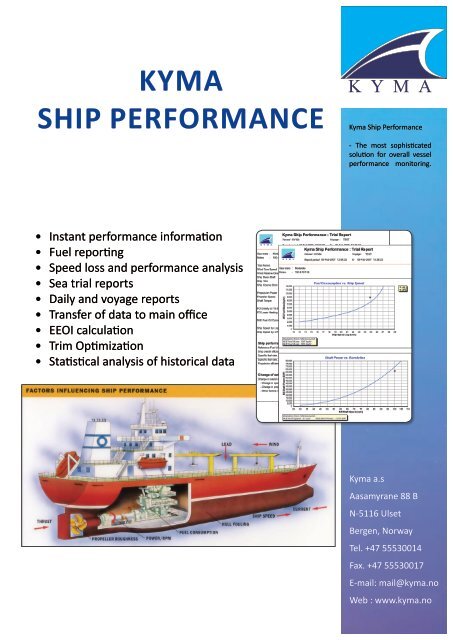
KymaShip PerformanceK Y M AKyma Ship Performance- The most sophisticatedsolution for overall vesselperformance monitoring.• Instant performance information• Fuel reporting• Speed loss and performance analysis• Sea trial reports• Daily and voyage reports• Transfer of data to main office• EEOI calculation• Trim Optimization• Statistical analysis of historical dataKyma a.sAasamyrane 88 BN-5116 UlsetBergen, NorwayTel. +47 55530014Fax. +47 55530017E-mail: mail@kyma.noWeb : www.kyma.no
<strong>KYMA</strong> a.s have been working with ship performancesystems for more than 30 years and are one of theleading suppliers within this field of technologyPropulsion economy is based on fuelefficiency and ship reliability. To achieve anoptimum result you need the best balancebetween fuel consumption, power outputand ship speed. This can be obtained fromaccurate information provided by high qualityinstrumentation.Kyma Performance Monitoring provides bridgeand engine officers with vital propulsion data forcost-effective operation of the ship.Reduced fuel consumptionAs fuel consumption is a major cost factor, the useof Kyma Performance Monitoring can contributesignificantly to an improved bottom line.Hull fouling and propeller roughness indicationKyma Performance Monitoring makes it possible toevaluate the economic impact of reduced propellerefficiency and increased hull resistance. It can showthe effect of any action taken to improve hull orpropeller smoothness.Performance evaluationContracts for new buildings are based on performanceestimates from model tank testing.Kyma Performance Monitoring can confirm preciselyto the contract performance parameters or to anyspecified deviations.Environmental informationEmission calculation of CO2 and SO2 is included in ShipPerformance and EEOI will be continuously calculated.Trim optimizationKyma Ship Performance can be used to optimizevessel operation by the use of empirical data. In order tooptimize ship trim for a given power and draft thefunctions LOGGING HISTORY and TRIAL are included inthe KSP program.Diagnostic ToolboxAn optional trend analysis toolbox is available fordetailed statistical analysis of speed loss andperformance information.Overload protectionEarly warning signals provide a further benefit for thecontinuous monitoring of propulsion components.These can indicate the overload stress of componentsand thus prevent unexpected breakdown.
A separate Kyma Office Application is available forfleet performance evaluationFleet Performance Summary:Vessel Name Voyage ID Last updated Performance StatusM/V Vessel 1 Voyage 110 22.10.2010 23:59:59M/V Vessel 2 Voyage 121 21.10.2010 23:59:59M/V Vessel 3 Voyage 89 23.10.2010 23:59:59M/V Vessel 4 Voyage 76B 22.10.2010 23:59:59M/V Vessel 5 Voyage 14A 20.10.2010 23:59:59Diagnostic ToolboxThe Diagnostic Toolbox is an efficienttool giving the operator and ship ownera clear indication of vessel conditionrelated to hull, machinery or propeller bythe use of coloured flags forperformance status indication.Performance status okPerformance to be observedPerformance not ok
Kyma Ship Performance - Instant ValuesA wide range of output information is available from the systemcomputer. All output may be presented in SI or metric units as required.a) NumericalAll logged and calculated parameters can be output to computer monitor and printer.Typical updating time is 15 sec.The following real-time values are available:• Revolutionsrpm• Shaft TorquekNm• Shaft ThrustkN• Shaft PowerkW• Ship speed by logknots• Ship speed by GPSknots• M/E specific fuel consumption g/kWhr• Propulsion efficiencym/kWhr• Ship overall efficiencykg/nm• M/E fuel consumptionkg/hr• G/E’s fuel consumption kg/hr• Aux. Boiler’s fuel consumption kg/hr• Type of F.O. in use (HFO or MDO) -• Fuel Temperature at flow meters C o• HFO density at 15°Ckg/l• MDO density at 15°Ckg/l• HFO low calorific value (LCV) kJ/kg• MDO low calorific value (LCV) kJ/kg• CO2 emissionston/ day• Energy Efficiency Operational Index,EEOI (CO2 Index)g CO2 /ton, nm• SO2 emissionston/day• Wind speed, rel.knots• Wind speed, trueknots• Wind direction, rel.Deg• GPS position, latitudeDeg.Min.Sec• GPS position, longitude Deg.Min.Sec• GPS, ship courseDeg• Draft fwd/aftm• Draft MS, port /starboard m• Trim/Listmb) Graphic modePresentation of performance curves where the actualcondition is indicated as a plot in the graph with numericalindication and deviation from the performance curve.Performance curves are derived from model tank data orsea trial data.• Shaft Power versus Revolutions• Shaft Power versus Ship Speed• Daily Fuel Consumption versus Ship Speed• Specific Fuel Rate versus Shaft PowerTrend curves:• Long-term trend capability over the life of the vessel ofselected vessel performance data subject to changeover time, such as speed loss due to hull fouling andincrease of main engine specific fuel rate.• Short-term trending of any five selectable parameterson a selectable time basis of up to 14 days.Resolution is 1 sample pr 15 sec.