Assessing the Benefits Reform in Slovenia Using a Microsimulation ...
Assessing the Benefits Reform in Slovenia Using a Microsimulation ...
Assessing the Benefits Reform in Slovenia Using a Microsimulation ...
You also want an ePaper? Increase the reach of your titles
YUMPU automatically turns print PDFs into web optimized ePapers that Google loves.
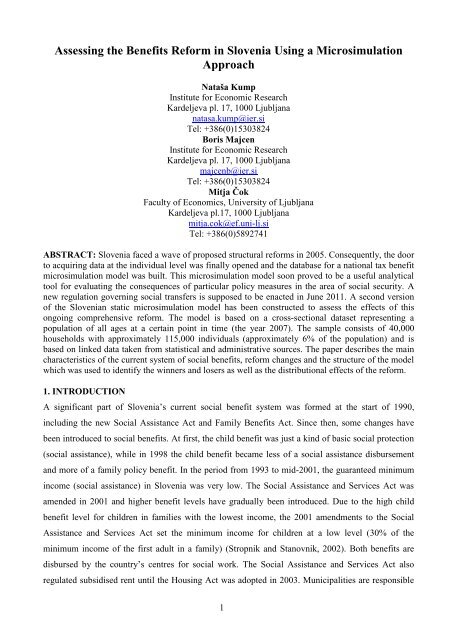
<strong>Assess<strong>in</strong>g</strong> <strong>the</strong> <strong>Benefits</strong> <strong>Reform</strong> <strong>in</strong> <strong>Slovenia</strong> Us<strong>in</strong>g a <strong>Microsimulation</strong>ApproachNataša KumpInstitute for Economic ResearchKardeljeva pl. 17, 1000 Ljubljananatasa.kump@ier.siTel: +386(0)15303824Boris MajcenInstitute for Economic ResearchKardeljeva pl. 17, 1000 Ljubljanamajcenb@ier.siTel: +386(0)15303824Mitja ČokFaculty of Economics, University of LjubljanaKardeljeva pl.17, 1000 Ljubljanamitja.cok@ef.uni-lj.siTel: +386(0)5892741ABSTRACT: <strong>Slovenia</strong> faced a wave of proposed structural reforms <strong>in</strong> 2005. Consequently, <strong>the</strong> doorto acquir<strong>in</strong>g data at <strong>the</strong> <strong>in</strong>dividual level was f<strong>in</strong>ally opened and <strong>the</strong> database for a national tax benefitmicrosimulation model was built. This microsimulation model soon proved to be a useful analyticaltool for evaluat<strong>in</strong>g <strong>the</strong> consequences of particular policy measures <strong>in</strong> <strong>the</strong> area of social security. Anew regulation govern<strong>in</strong>g social transfers is supposed to be enacted <strong>in</strong> June 2011. A second versionof <strong>the</strong> <strong>Slovenia</strong>n static microsimulation model has been constructed to assess <strong>the</strong> effects of thisongo<strong>in</strong>g comprehensive reform. The model is based on a cross-sectional dataset represent<strong>in</strong>g apopulation of all ages at a certa<strong>in</strong> po<strong>in</strong>t <strong>in</strong> time (<strong>the</strong> year 2007). The sample consists of 40,000households with approximately 115,000 <strong>in</strong>dividuals (approximately 6% of <strong>the</strong> population) and isbased on l<strong>in</strong>ked data taken from statistical and adm<strong>in</strong>istrative sources. The paper describes <strong>the</strong> ma<strong>in</strong>characteristics of <strong>the</strong> current system of social benefits, reform changes and <strong>the</strong> structure of <strong>the</strong> modelwhich was used to identify <strong>the</strong> w<strong>in</strong>ners and losers as well as <strong>the</strong> distributional effects of <strong>the</strong> reform.1. INTRODUCTIONA significant part of <strong>Slovenia</strong>’s current social benefit system was formed at <strong>the</strong> start of 1990,<strong>in</strong>clud<strong>in</strong>g <strong>the</strong> new Social Assistance Act and Family <strong>Benefits</strong> Act. S<strong>in</strong>ce <strong>the</strong>n, some changes havebeen <strong>in</strong>troduced to social benefits. At first, <strong>the</strong> child benefit was just a k<strong>in</strong>d of basic social protection(social assistance), while <strong>in</strong> 1998 <strong>the</strong> child benefit became less of a social assistance disbursementand more of a family policy benefit. In <strong>the</strong> period from 1993 to mid-2001, <strong>the</strong> guaranteed m<strong>in</strong>imum<strong>in</strong>come (social assistance) <strong>in</strong> <strong>Slovenia</strong> was very low. The Social Assistance and Services Act wasamended <strong>in</strong> 2001 and higher benefit levels have gradually been <strong>in</strong>troduced. Due to <strong>the</strong> high childbenefit level for children <strong>in</strong> families with <strong>the</strong> lowest <strong>in</strong>come, <strong>the</strong> 2001 amendments to <strong>the</strong> SocialAssistance and Services Act set <strong>the</strong> m<strong>in</strong>imum <strong>in</strong>come for children at a low level (30% of <strong>the</strong>m<strong>in</strong>imum <strong>in</strong>come of <strong>the</strong> first adult <strong>in</strong> a family) (Stropnik and Stanovnik, 2002). Both benefits aredisbursed by <strong>the</strong> country’s centres for social work. The Social Assistance and Services Act alsoregulated subsidised rent until <strong>the</strong> Hous<strong>in</strong>g Act was adopted <strong>in</strong> 2003. Municipalities are responsible1
for rent subsidies.A new Scholarship Act <strong>in</strong>troduc<strong>in</strong>g a new means threshold for entitlement to state scholarships wasadopted <strong>in</strong> 2007. The Act for <strong>the</strong> first time <strong>in</strong>dependently governs <strong>the</strong> scholarship scheme which hasbeen regulated by <strong>the</strong> Employment and Insurance Aga<strong>in</strong>st Unemployment Act prior to <strong>the</strong> change.With this new regulation, <strong>the</strong> responsibility for state scholarships was transferred from <strong>the</strong>Employment Service of <strong>Slovenia</strong> to <strong>the</strong> centres for social work.Although <strong>the</strong> pension system conta<strong>in</strong>s various redistribution elements, some pensioners still receivevery low pensions due to <strong>the</strong>ir low <strong>in</strong>comes dur<strong>in</strong>g <strong>the</strong>ir contribution period and/or an <strong>in</strong>completecontribution period. Pensioners with low <strong>in</strong>comes and an <strong>in</strong>complete contribution period can applyfor a pension <strong>in</strong>come supplement provided <strong>the</strong>y fulfil a set of conditions, such as: a) <strong>the</strong>ir pension isbelow a certa<strong>in</strong> threshold; b) <strong>the</strong> family <strong>in</strong> which <strong>the</strong> pensioner lives does not have o<strong>the</strong>r <strong>in</strong>comesources which would allow a m<strong>in</strong>imum standard of liv<strong>in</strong>g; and c) <strong>the</strong> family has negligible property.The 1999 Pension and Disability Insurance Act (PDIA) <strong>in</strong>troduced <strong>the</strong> state pension which is <strong>in</strong> facta form of a means-tested benefit. As a social assistance measure, it has no place <strong>in</strong> <strong>the</strong> pension anddisability <strong>in</strong>surance act; its <strong>in</strong>clusion was <strong>the</strong> result of considerable horse-trad<strong>in</strong>g among <strong>the</strong> politicalparties mak<strong>in</strong>g up <strong>the</strong> rul<strong>in</strong>g coalition. Unlike <strong>the</strong> pension <strong>in</strong>come supplement, where one of <strong>the</strong> ma<strong>in</strong>criteria is that a person is entitled to a pension, i.e. has accumulated a sufficient contributory period,<strong>the</strong> state pension can be granted to someone who is not receiv<strong>in</strong>g any pension. Both benefits aredisbursed by <strong>the</strong> Institute for Pension and Disability Insurance.Subsidies form an important part of <strong>the</strong> <strong>Slovenia</strong>n system of social protection. Childcare services areaffordable due to <strong>the</strong> high means-tested subsidies from public sources. Regulated by <strong>the</strong> Pre-schoolChildcare Act, <strong>the</strong>se subsidies are by far <strong>the</strong> biggest s<strong>in</strong>gle transfer to families <strong>in</strong> <strong>Slovenia</strong> and aregoverned by municipalities. Children <strong>in</strong> compulsory and upper secondary education might be eligiblefor subsidised school meals – with some of <strong>the</strong>se entitlements be<strong>in</strong>g universal rights and o<strong>the</strong>rsmeans-tested. Subsidised school transport is provided for pupils <strong>in</strong> upper secondary education andtertiary students.The <strong>Slovenia</strong>n social protection system plays a significant role <strong>in</strong> ma<strong>in</strong>ta<strong>in</strong><strong>in</strong>g low poverty rates <strong>in</strong><strong>Slovenia</strong>. However, some drawbacks have become evident over time:a) Many state and municipality authorities are <strong>in</strong>volved <strong>in</strong> assess<strong>in</strong>g eligibility and disburs<strong>in</strong>g<strong>the</strong> benefits. Official records are not completely harmonised among <strong>the</strong> differentauthorities which leads to <strong>the</strong> possibility of <strong>in</strong>comes be<strong>in</strong>g underreported.b) The <strong>Slovenia</strong>n social protection system enables <strong>the</strong> accumulation of benefits: a) relat<strong>in</strong>gbenefits to <strong>the</strong> fact that one is receiv<strong>in</strong>g some o<strong>the</strong>r benefit; b) <strong>the</strong> non-<strong>in</strong>clusion of all<strong>in</strong>comes and benefits <strong>in</strong> family <strong>in</strong>come when decid<strong>in</strong>g on benefit entitlement; c) <strong>the</strong>2
def<strong>in</strong>ition of <strong>in</strong>come ceil<strong>in</strong>gs for social benefit entitlement; d) <strong>the</strong> absence of a l<strong>in</strong>kageamong registers of beneficiaries of various social benefits; and e) deficient co-ord<strong>in</strong>ationand co-operation among authorities grant<strong>in</strong>g benefits etc. For example, <strong>the</strong> 10% childcaresubsidy and free lunches <strong>in</strong> primary school that are granted exclusively to social assistancebeneficiaries.c) Work <strong>in</strong>centives are low.d) The m<strong>in</strong>imum <strong>in</strong>come (which is <strong>the</strong> basis for social assistance and hous<strong>in</strong>g benefits) hasbecome too low.Therefore, <strong>the</strong> regulation concern<strong>in</strong>g social benefits has been amended and two new Acts have beenadopted. 1 The Exercise of Rights to Public Funds Act <strong>in</strong>troduces a “s<strong>in</strong>gle entry po<strong>in</strong>t” andharmonises <strong>the</strong> criteria for grant<strong>in</strong>g four types of transfers and n<strong>in</strong>e types of subsidies that are meanstested.The two ma<strong>in</strong> goals of <strong>the</strong> changes are to simplify <strong>the</strong> procedure of apply<strong>in</strong>g for transfers andsubsidies for <strong>the</strong> beneficiaries, while mak<strong>in</strong>g <strong>the</strong> system more transparent and efficient and reduc<strong>in</strong>g<strong>the</strong> possibility of fraud (by cross-check<strong>in</strong>g <strong>in</strong>come and wealth status). Centres for social work willbecome <strong>the</strong> “s<strong>in</strong>gle entry po<strong>in</strong>t” <strong>in</strong> <strong>the</strong> system of social rights. Their work on applications will besupported by a centralised <strong>in</strong>formation system (a web application connect<strong>in</strong>g different databases).The F<strong>in</strong>ancial Social Assistance Act <strong>in</strong>troduces changes <strong>in</strong> <strong>the</strong> areas of f<strong>in</strong>ancial social assistance andm<strong>in</strong>imum pension support, previously governed by <strong>the</strong> Pension and Disability Insurance Act(National <strong>Reform</strong> Programme 2011-2012, 2011).For <strong>the</strong> purposes of assess<strong>in</strong>g this ongo<strong>in</strong>g comprehensive reform a second version of <strong>the</strong> <strong>Slovenia</strong>nstatic microsimulation model has been constructed. The microsimulation model was a tool forestimat<strong>in</strong>g budgetary effects, identify<strong>in</strong>g <strong>the</strong> w<strong>in</strong>ners and losers and assess<strong>in</strong>g <strong>the</strong> distributionaleffects.The structure of <strong>the</strong> paper is as follows: Section 2 outl<strong>in</strong>es <strong>the</strong> data and methodology, Section 3briefly describes <strong>the</strong> changes <strong>in</strong> social benefits, <strong>the</strong> results are presented <strong>in</strong> Section 4, while <strong>the</strong> f<strong>in</strong>alsection offers some conclud<strong>in</strong>g remarks.2. DATA AND METHODOLOGYFor <strong>the</strong> purposes of <strong>the</strong> reform simulations, previous versions of <strong>the</strong> microsimulation model (Čok2002, Čok et al. 2004, Majcen et al. 2007) were updated and fur<strong>the</strong>r developed. This second versionof <strong>the</strong> <strong>Slovenia</strong>n static microsimulation model is based on a cross-sectional dataset represent<strong>in</strong>g apopulation of all ages at a certa<strong>in</strong> po<strong>in</strong>t <strong>in</strong> time (<strong>the</strong> year 2007). The sample consists of 40,0001 The Acts were supposed to commence operation <strong>in</strong> June 2011. S<strong>in</strong>ce adequate records are not ensured (especiallyproperty valuation models) and <strong>the</strong> <strong>in</strong>formation system is not established yet <strong>the</strong> Acts will be enforced <strong>in</strong> January 2012.3
households with 112,839 <strong>in</strong>dividuals (approximately 6% of <strong>the</strong> population). It is a merged databasebased on separate files from <strong>the</strong> M<strong>in</strong>istry of F<strong>in</strong>ance (conta<strong>in</strong><strong>in</strong>g PIT records), <strong>the</strong> M<strong>in</strong>istry ofLabour, Family and Social Affairs (conta<strong>in</strong><strong>in</strong>g records on social benefits), <strong>the</strong> M<strong>in</strong>istry of InternalAffairs (conta<strong>in</strong><strong>in</strong>g data on socio-economic characteristics), <strong>the</strong> Employment Service of <strong>Slovenia</strong>(conta<strong>in</strong><strong>in</strong>g data on unemployment benefits and labour market status) and <strong>the</strong> M<strong>in</strong>istry of Educationand Sport (conta<strong>in</strong><strong>in</strong>g detailed data on scholarship recipients). S<strong>in</strong>ce <strong>the</strong> model is based onadm<strong>in</strong>istrative data (not survey data) it is high <strong>in</strong> quality and enables <strong>the</strong> simulation of practically alldirect taxes and most benefits at <strong>the</strong> <strong>in</strong>dividual and household levels. The model is static <strong>in</strong> time anddoes not <strong>in</strong>clude changes <strong>in</strong> behaviour or consequential macroeconomic second-order effects.In <strong>the</strong> first step of <strong>the</strong> microsimulation, databases from different sources are prepared <strong>in</strong> <strong>the</strong> f<strong>in</strong>alform (f<strong>in</strong>al database) which enables <strong>the</strong> simulations. S<strong>in</strong>ce many households consist of two or evenmore families (for example, adults with m<strong>in</strong>or children, spouses and <strong>the</strong>ir parents) we imputedfamilies with<strong>in</strong> <strong>the</strong>se households. At <strong>the</strong> end, our database consists of 112,839 <strong>in</strong>dividuals liv<strong>in</strong>g <strong>in</strong>57,630 families.Secondly, <strong>the</strong> benefit system from 2007 is replicated to estimate <strong>the</strong> quality of <strong>the</strong> sample. S<strong>in</strong>ce <strong>the</strong>orig<strong>in</strong>al data also <strong>in</strong>clude social benefits calculated by a responsible authority, one might expect <strong>the</strong>“micro validation” of <strong>the</strong> model could be done by compar<strong>in</strong>g <strong>the</strong> benefits calculated by <strong>the</strong> modelwith <strong>the</strong> recorded social benefits for each <strong>in</strong>dividual <strong>in</strong> <strong>the</strong> sample. However, this cannot be done <strong>in</strong>such a straightforward way due to a few data limitations:Family <strong>in</strong>come which is <strong>the</strong> basis for <strong>the</strong> <strong>in</strong>come test for most benefits refers to <strong>the</strong> previousyear or even <strong>the</strong> year before that, mean<strong>in</strong>g that 2006 <strong>in</strong>come data are needed to simulatesocial benefits <strong>in</strong> 2007. As <strong>in</strong>come data refer to 2007, our assumption is that <strong>in</strong>come levels <strong>in</strong>2007 are exactly <strong>the</strong> same as <strong>in</strong> 2006.Social assistance is a special case s<strong>in</strong>ce entitlement to social assistance depends on family<strong>in</strong>comes <strong>in</strong> <strong>the</strong> three previous months. Given <strong>the</strong> data on annual <strong>in</strong>comes it is implicitlyassumed that <strong>in</strong>come is received at <strong>the</strong> same rate throughout <strong>the</strong> year and monthly <strong>in</strong>comesare simply annual <strong>in</strong>comes divided by 12. The actual <strong>in</strong>come position of <strong>in</strong>dividuals mightdrastically change dur<strong>in</strong>g a s<strong>in</strong>gle year and a three-month average could differ from <strong>the</strong>annual average. Social assistance is usually not received throughout <strong>the</strong> year, <strong>the</strong>refore wetake <strong>in</strong>to account that social assistance is received on average 7.45 months per year (officialdata).Entitlement to some social benefits (social assistance, pension <strong>in</strong>come supplement) alsodepends on family sav<strong>in</strong>gs and property. Data on sav<strong>in</strong>gs and property are not <strong>in</strong>cluded <strong>in</strong> ourdatabase.4
Due to <strong>the</strong> lack of data it was impossible to simulate m<strong>in</strong>imum pension support. Therefore weuse data from <strong>the</strong> dataset.At this stage, a “macro” validation of <strong>the</strong> model and its database is considered, as evident <strong>in</strong> Table 1.Child benefit is overestimated when calculated with <strong>the</strong> microsimulation model by somewhat morethan 10%, which is evident from <strong>the</strong> table below. On <strong>the</strong> contrary, <strong>the</strong> average child benefit from <strong>the</strong>microsimulation model and adm<strong>in</strong>istrative sources almost co<strong>in</strong>cide. The calculated state scholarshipalmost co<strong>in</strong>cides with <strong>the</strong> aggregate scholarship data from adm<strong>in</strong>istrative sources. By contrast, <strong>the</strong>calculated social assistance and data on m<strong>in</strong>imum pension support 2 do not match <strong>the</strong> aggregates fromadm<strong>in</strong>istrative sources as well as <strong>the</strong> o<strong>the</strong>r two benefits, but <strong>the</strong> results are still satisfactory.Table 1: Macro validation of <strong>the</strong> ma<strong>in</strong> simulated benefits <strong>in</strong> a replication of <strong>the</strong> 2007 benefit systemNo. ofrecipients<strong>in</strong> 1000Adm<strong>in</strong>istrative data Calculated data IndexTotalamount,EUR1,000Averagebenefit(monthly),EURNo. ofrecipients<strong>in</strong> 1000Totalamount,EUR1,000Averagebenefit(monthly),EURNo. ofrecipients<strong>in</strong> 1000Totalamount,EUR1,000Averagebenefit(monthly),EURChild benefit 379.1 246.0 54.1 426.9 273.1 53.3 112.6 111.0 98.6Social assistance 43.6 107.1 204.6 61.4 99.0 213.8 *140.7 92.4 104.5M<strong>in</strong>imumpension support45.0 38.3 70.8 39.8 31.8 66.6 88.3 83.0 94.0State scholarship 34.6 64.7 156.0 35.4 65.5 154.3 102.4 101.2 98.9Notes: *The difference <strong>in</strong> <strong>the</strong> number of social assistances recipients might be mislead<strong>in</strong>g as external statisticsrefer to <strong>the</strong> average monthly number of recipients, while <strong>the</strong> number calculated with <strong>the</strong> microsimulationmodel refers to <strong>the</strong> total annual number of recipients <strong>in</strong> 2007.Sources: Own calculations, microsimulation model;M<strong>in</strong>istry of Labour, Family and Social Affairs, 2011;Institute for Pension and Disability Insurance, 2008.Thirdly, all <strong>in</strong>comes are updated to 2010 and <strong>the</strong> benefits system <strong>in</strong> 2010 is replicated to <strong>in</strong>troduce<strong>the</strong> changes to legislation between 2007 and 2010. Table 2 shows that <strong>the</strong> simulation results are lesssatisfy<strong>in</strong>g when 2010 is considered. The calculated amount of child benefit and <strong>the</strong> number ofrecipients are overestimated by more than 15%, though <strong>the</strong> average amount of child benefit almostco<strong>in</strong>cides with <strong>the</strong> average child benefit from adm<strong>in</strong>istrative records. Similarly, all o<strong>the</strong>r calculatedaggregates of social benefits are overestimated, while only <strong>the</strong> calculated state scholarship co<strong>in</strong>cideswith <strong>the</strong> adm<strong>in</strong>istrative data. The calculated m<strong>in</strong>imum pension support 3 is very underestimated whichcan be expla<strong>in</strong>ed by <strong>the</strong> underestimated number of recipients <strong>in</strong> <strong>the</strong> sample <strong>in</strong> <strong>the</strong> first place and <strong>the</strong>changed legislation s<strong>in</strong>ce 2008. The calculated social assistance is considerably overestimated <strong>in</strong>terms of aggregate numbers and <strong>in</strong> terms of <strong>the</strong> average benefit level. The lion’s share of thisdiscrepancy lies <strong>in</strong> <strong>the</strong> already mentioned strong assumptions and data limitations which are <strong>the</strong> basis2 M<strong>in</strong>imum pension support could not be simulated for <strong>the</strong> policy year 2007 as data on <strong>the</strong> pension qualify<strong>in</strong>g period arenot <strong>in</strong>cluded <strong>in</strong> <strong>the</strong> sample but are essential for calculat<strong>in</strong>g <strong>the</strong> benefit. Therefore, data taken directly from <strong>the</strong> sample aretaken <strong>in</strong>to account.5
for <strong>the</strong> social assistance simulations (imply<strong>in</strong>g that <strong>in</strong>comes are received at <strong>the</strong> same rate andproperty data are miss<strong>in</strong>g). In addition, <strong>the</strong> <strong>in</strong>come structure most probably changed between 2007and 2010 as <strong>the</strong> m<strong>in</strong>imum wage rose by 22.9% <strong>in</strong> March 2010. This <strong>in</strong>crease ma<strong>in</strong>ly <strong>in</strong>fluencedpeople at <strong>the</strong> low end of <strong>the</strong> <strong>in</strong>come distribution and <strong>the</strong> updat<strong>in</strong>g of <strong>in</strong>comes could not capture thisstructural change 4 .Table 2: Macro validation of <strong>the</strong> ma<strong>in</strong> simulated benefits <strong>in</strong> a replication of <strong>the</strong> 2010 benefit systemNo. ofrecipients<strong>in</strong> 1000Adm<strong>in</strong>istrative data Calculated data IndexTotalamount,EUR1,000Averagebenefit(monthly),EURNo. ofrecipients<strong>in</strong> 1000Totalamount,EUR1,000Averagebenefit(monthly),EURNo. ofrecipients<strong>in</strong> 1000Totalamount,EUR1,000Averagebenefit(monthly),EURChild benefit 374.5 289.6 64.5 432.8 342.4 65.9 115.6 118.2 102.3Social assistance 48.7 132.5 226.9 59.2 146.7 328.8 121.6 110.7 144.9M<strong>in</strong>imumpension support44.7 52.3 97.4 39.8 36.3 76.1 88.9 69.4 78.1State scholarship 39.5 73.1 154.4 50.7 96.5 158.4 128.5 131.9 102.6Notes: *The difference <strong>in</strong> <strong>the</strong> number of social assistances recipients might be mislead<strong>in</strong>g as external statisticsrefer to <strong>the</strong> average monthly number of recipients, while <strong>the</strong> number calculated with <strong>the</strong> microsimulationmodel refers to <strong>the</strong> total annual number of recipients <strong>in</strong> 2007.Sources: Own calculations, microsimulation model;M<strong>in</strong>istry of Labour, Family and Social Affairs, 2011;Institute for Pension and Disability Insurance, 2010.F<strong>in</strong>ally, <strong>the</strong> new legislation concern<strong>in</strong>g social benefits <strong>in</strong> 2010 is simulated. Then <strong>the</strong> percentagechange between <strong>the</strong> calculated aggregate amounts consider<strong>in</strong>g <strong>the</strong> new legislation and <strong>the</strong> calculatedaggregate amounts consider<strong>in</strong>g <strong>the</strong> current benefit system <strong>in</strong> 2010 is estimated. The effects ofchanges foreseen at <strong>the</strong> aggregate level are estimated for 2010 by apply<strong>in</strong>g this percentage change toadm<strong>in</strong>istrative aggregate data for 2010. Thus, data limitations and assumptions are mitigated to acerta<strong>in</strong> extent.3. REFORM CHANGES CONCERNING SOCIAL BENEFITSAfter <strong>the</strong> reform is implemented all social benefits 5 will be governed by <strong>the</strong> Exercise of Rights toPublic Funds Act and <strong>the</strong> F<strong>in</strong>ancial Social Assistance Act. The new legislation changes family<strong>in</strong>come which is <strong>the</strong> basis for <strong>the</strong> <strong>in</strong>come test from gross family <strong>in</strong>come to net family <strong>in</strong>come, whichalso <strong>in</strong>cludes social benefits received.3 It also could not be simulated for policy year 2010.4 The changed <strong>in</strong>come structure does not <strong>in</strong>fluence <strong>the</strong> PIT simulations as much as social benefits. PIT calculated by <strong>the</strong>model co<strong>in</strong>cides very well with <strong>the</strong> recorded PIT. The actual aggregate amount of PIT <strong>in</strong> 2004 was 3.9% higher than <strong>in</strong>our simulation5 We only focus on <strong>the</strong> four most important benefits. However it should be noted that <strong>the</strong> microsimulation model wasused to simulate o<strong>the</strong>r benefits/subsidies, namely: childcare subsidies, subsidised school meals, subsidised schooltransport, paid compulsory health <strong>in</strong>surance and entitlement to <strong>the</strong> full value? of health services.6
Child benefit is currently a means-tested benefit, held by one of <strong>the</strong> parents for a child resid<strong>in</strong>g <strong>in</strong><strong>Slovenia</strong>. The right to a child benefit is reta<strong>in</strong>ed until <strong>the</strong> child reaches 18 years of age, as well as for<strong>the</strong> period <strong>in</strong> which <strong>the</strong> child cont<strong>in</strong>ues with full-time education, but only until <strong>the</strong> child reaches 26years of age. Child benefit is only paid <strong>in</strong> case <strong>the</strong> <strong>in</strong>come per family member, <strong>in</strong> <strong>the</strong> calendar yearprior to submission of a claim, was below <strong>the</strong> average wage <strong>in</strong> <strong>Slovenia</strong>. As already mentioned, a net<strong>in</strong>come approach is taken <strong>in</strong>to account under <strong>the</strong> new legislation, but <strong>the</strong> <strong>in</strong>come brackets rema<strong>in</strong>spractically <strong>the</strong> same <strong>in</strong> absolute terms. The new legislation also reduces <strong>the</strong> age of a child’sentitlement. The right to a child benefit is held only until <strong>the</strong> child reaches 18 years. Besides, <strong>the</strong>child benefit for eligible students <strong>in</strong>cluded <strong>in</strong> higher secondary education (aged less than 18 yearsand with an <strong>in</strong>come per family member below <strong>the</strong> average wage) is higher which is evident fromTables 3 and 4.Table 3: Monthly amounts of child benefit <strong>in</strong> 2010 – current legislationMonthly child benefit for a child from birth to <strong>the</strong> end of primaryGross family <strong>in</strong>come per family memberschool, <strong>in</strong> EURas a percentage of <strong>the</strong> average gross wage3rd and every1st child2nd childsubsequent childto 15% 114.31 125.73 137.18more than 15% to 25% 97.73 108.04 118.28more than 25% to 30% 74.48 83.25 91.98more than 30% to 35% 58.75 67.03 75.47more than 35% to 45% 48.04 56.06 64.03more than 45% to 55% 30.44 38.1 45.17more than 55% to 75% 22.83 30.44 38.1more than 75% to 99% 19.88 27.5 35.11Source: M<strong>in</strong>istry of Labour, Family and Social Affairs, http://www.mddsz.gov.si/.Table 4: Monthly amounts of child benefit <strong>in</strong> 2010 – new legislationNet family <strong>in</strong>come perfamily member as apercentage of <strong>the</strong>average net wageMonthly child benefit for a child frombirth to <strong>the</strong> end of primary school, <strong>in</strong>EUR3rd and every1st child 2nd childsubsequent childMonthly child benefit for a child<strong>in</strong>cluded <strong>in</strong> upper secondary education,<strong>in</strong> EUR3rd and every1st child 2nd childsubsequent childto 18% 114.31 125.73 137.18 168.31 179.73 243.55more than18% to 30% 97.73 108.04 118.28 142.73 153.04 206.88more than30% to 36% 74.48 83.25 91.98 110.48 119.25 162.89more than36% to 42% 58.75 67.03 75.47 85.75 94.03 128.58more than42% to 53% 48.04 56.06 64.03 68.04 76.06 103.27more than53% to 64% 30.44 38.1 45.71 43.44 51.1 71.17more than64% to 82% 22.83 30.44 38.1 28.83 36.44 49.65more than82% to 99% 19.88 27.5 35.11 19.88 27.5 34.69Source: The Exercise of Rights to Public Funds Act, 2010.7
The <strong>in</strong>creased amounts of child benefit for children (under 18) <strong>in</strong>cluded <strong>in</strong> upper secondaryeducation are supposed to (at least partly) compensate for <strong>the</strong> abolition of <strong>the</strong> state scholarship formost upper secondary students. Currently, all upper secondary and tertiary students might be entitledto a state scholarship. On <strong>the</strong> contrary, only students (higher secondary and tertiary) aged 18 years ormore might be eligible for a state scholarship under <strong>the</strong> new legislation. This means that <strong>the</strong> majorityof upper secondary students will not receive any scholarship. Besides, <strong>the</strong> reform <strong>in</strong>troduces a fewmore important changes: a) <strong>the</strong> family <strong>in</strong>come used for <strong>the</strong> <strong>in</strong>come test will be net family <strong>in</strong>comewith received child benefits <strong>in</strong>cluded; b) family <strong>in</strong>come will be compared to <strong>the</strong> average net wage<strong>in</strong>stead of <strong>the</strong> m<strong>in</strong>imum wage; c) <strong>the</strong> <strong>in</strong>come threshold will be raised significantly; d) <strong>the</strong> monthlyamount of <strong>the</strong> scholarship will be <strong>in</strong>creased; and e) scholarship amounts will not differ accord<strong>in</strong>g toeducation levels (upper secondary and tertiary students) as evident from Tables 5 and 6.Table 5: Monthly amounts of state scholarship – current legislationGross family <strong>in</strong>come per family memberas a percentage of <strong>the</strong> m<strong>in</strong>imum wageStudents <strong>in</strong> upper secondaryeducationBasicscholarshipIncomesupplementStudents <strong>in</strong> tertiary educationBasicscholarshipIncomesupplementTo 25% 38.33 54.31 57.50 54.31More than 25% to 40% 38.33 43.66 57.50 43.66More than 40% to 50% 38.33 31.95 57.50 31.95More than 50% to 60% 38.33 21.30 57.50 21.30More than 60% to 65% 38.33 0 57.50 0Source: M<strong>in</strong>istry of Labour, Family and Social Affairs, http://www.mddsz.gov.si/.Table 6: Monthly amounts of state scholarship – new legislationNet family <strong>in</strong>come per family member asa percentage of <strong>the</strong> average net wageBasic scholarship with <strong>in</strong>come supplementStudents <strong>in</strong> upper secondaryeducationStudents <strong>in</strong> tertiary educationTo 30% 190 190More than 30% to 36% 160 160More than 36% to 42% 130 130More than 42% to 53% 100 100More than 53 to 64% 70 70Source: The Exercise of Rights to Public Funds Act, 2010.The F<strong>in</strong>ancial Social Assistance Act def<strong>in</strong>es a new basis for ensur<strong>in</strong>g social security for <strong>the</strong> mostvulnerable population groups: a) family <strong>in</strong>come which is <strong>the</strong> basis for <strong>the</strong> <strong>in</strong>come test will <strong>in</strong>cludechild benefits received and state scholarships; b) <strong>the</strong> lowest amount of f<strong>in</strong>ancial social assistance willbe <strong>in</strong>creased; and c) an activity supplement will be granted to beneficiaries of f<strong>in</strong>ancial socialassistance work<strong>in</strong>g or tak<strong>in</strong>g part <strong>in</strong> activities or programmes aimed at employment.8
Currently, <strong>the</strong> people entitled to cash social assistance do not have any <strong>in</strong>come or receive <strong>in</strong>comebelow <strong>the</strong> family m<strong>in</strong>imum <strong>in</strong>come. In <strong>the</strong> case of no <strong>in</strong>come, <strong>the</strong> entitled persons receive <strong>the</strong> fullstated amount; o<strong>the</strong>rwise, <strong>the</strong>y are entitled to receive <strong>the</strong> difference between <strong>the</strong>ir own <strong>in</strong>come and<strong>the</strong> family m<strong>in</strong>imum <strong>in</strong>come. The m<strong>in</strong>imum <strong>in</strong>come for a family is obta<strong>in</strong>ed by multiply<strong>in</strong>g <strong>the</strong> basicamount of m<strong>in</strong>imum <strong>in</strong>come (currently EUR 229.52) by <strong>the</strong> weighted number of family members.Table 7 shows <strong>the</strong> amounts of m<strong>in</strong>imum <strong>in</strong>come and weights <strong>in</strong> <strong>the</strong> current and forthcom<strong>in</strong>g system.Table 7:Weights for <strong>the</strong> social assistance calculation accord<strong>in</strong>g to <strong>the</strong> current and new legislationCurrent Newlegislation legislationBasic m<strong>in</strong>imum <strong>in</strong>come EUR 229.52 EUR 288.81Weights:First adult <strong>in</strong> <strong>the</strong> family 1 1Activity supplement for <strong>the</strong> first adult <strong>in</strong> <strong>the</strong> family work<strong>in</strong>g full time 0 0.56Activity supplement for <strong>the</strong> first adult work<strong>in</strong>g part time 0 0.28Adults aged 18 to 26 years liv<strong>in</strong>g with <strong>the</strong>ir parents and registered asunemployed at <strong>the</strong> Employment Service of <strong>Slovenia</strong>0.7 1S<strong>in</strong>gle persons permanently <strong>in</strong>capacitated for ga<strong>in</strong>ful employment or olderthan 63 years (women) or 65 years (men) liv<strong>in</strong>g at <strong>the</strong> same address as o<strong>the</strong>r 1 0.7persons who are not <strong>the</strong>ir family membersAdults <strong>in</strong> <strong>in</strong>stitutional care 0 1All o<strong>the</strong>r adults <strong>in</strong> <strong>the</strong> family 0.7 0.5Activity supplement for all o<strong>the</strong>r adults <strong>in</strong> <strong>the</strong> family work<strong>in</strong>g full time 0 0.28Activity supplement for all o<strong>the</strong>r adults <strong>in</strong> <strong>the</strong> family work<strong>in</strong>g part time 0 0.14The oldest child <strong>in</strong> <strong>the</strong> family not <strong>in</strong>cluded <strong>in</strong> upper secondary education 0.3 0.7All o<strong>the</strong>r children <strong>in</strong> <strong>the</strong> family not <strong>in</strong>cluded <strong>in</strong> upper secondary education 0.3 0.6The oldest child <strong>in</strong> <strong>the</strong> family <strong>in</strong>cluded <strong>in</strong> upper secondary education 0.3 0.89All o<strong>the</strong>r children <strong>in</strong> <strong>the</strong> family <strong>in</strong>cluded <strong>in</strong> upper secondary education 0.3 0.79Sources: M<strong>in</strong>istry of Labour, Family and Social Affairs, http://www.mddsz.gov.si/, The F<strong>in</strong>ancial SocialAssistance Act, 2010.The same Act abolishes <strong>the</strong> state pension 6 and governs m<strong>in</strong>imum pension support which will becompletely transformed. M<strong>in</strong>imum pension support is currently granted to pensioners with low<strong>in</strong>comes and an <strong>in</strong>complete contribution period, provided <strong>the</strong>y fulfil a set of conditions, such as: a)<strong>the</strong>ir pension is lower than a certa<strong>in</strong> threshold (81.6% of <strong>the</strong> lowest pension base, i.e. EUR 449.75 <strong>in</strong>2011); b) <strong>the</strong> family <strong>in</strong> which <strong>the</strong> pensioner lives does not have o<strong>the</strong>r <strong>in</strong>come sources which wouldallow a m<strong>in</strong>imum standard of liv<strong>in</strong>g; and c) <strong>the</strong> family has negligible property. The benefit amountdepends on <strong>the</strong> contribution period, pension and number of family members (<strong>in</strong> <strong>the</strong> case of a survivorpension). Under <strong>the</strong> new legislation m<strong>in</strong>imum pension support will be granted to all peoplepermanently <strong>in</strong>capacitated for ga<strong>in</strong>ful employment or older than 63 years (women) or 65 years6 The state pension will be replaced by social assistance and m<strong>in</strong>imum pension support.9
(men), irrespective of whe<strong>the</strong>r <strong>the</strong>y are pensioners or not 7 . The order of assess<strong>in</strong>g <strong>the</strong> eligibility fordifferent benefits will be changed. Currently, social assistance comes after m<strong>in</strong>imum pension supportwhereas <strong>the</strong> new regulation will change <strong>the</strong> order of <strong>the</strong>se two benefits. Eligibility for m<strong>in</strong>imumpension support will be assessed similarly as for social assistance. The m<strong>in</strong>imum <strong>in</strong>come for eligiblepersons will be <strong>in</strong>creased:0.56 times <strong>the</strong> basic m<strong>in</strong>imum <strong>in</strong>come for a s<strong>in</strong>gle person, first or only adult person <strong>in</strong> afamily; and0.28 times <strong>the</strong> basic m<strong>in</strong>imum <strong>in</strong>come for o<strong>the</strong>r adult persons <strong>in</strong> <strong>the</strong> family.4. RESULTSThe ma<strong>in</strong> results of <strong>the</strong> forthcom<strong>in</strong>g reform are presented <strong>in</strong> Table 8, which <strong>in</strong>cludes comparisons ofadm<strong>in</strong>istrative aggregate data on ma<strong>in</strong> social benefits <strong>in</strong> 2010 and calculated aggregate dataconcern<strong>in</strong>g <strong>the</strong>se benefits on <strong>the</strong> assumption that <strong>the</strong> new legislation is enacted <strong>in</strong> 2010.Table 8: Calculated change <strong>in</strong> aggregates of simulated benefitsSocial benefitsAdm<strong>in</strong>istrative data, 2010 Calculated data, new legislation, 2010No. ofrecipientsTotalamount,EUR1,000Averagebenefit(monthly),EURNo. ofrecipientsChange<strong>in</strong> %Totalamount,EUR1,000Change<strong>in</strong> %Averagebenefit(monthly),EURChid benefit 374,466 289,643 64 296,280 -20.9 250,874 -13.4 71 10.9Change<strong>in</strong> %State scholarship(upper secondary 24,877 42,480 142 11,419 -54.1 26,920 -36.6 196 38.0students)State scholarship(tertiary students)14,609 30,661 175 31,965 118.8 80,158 161.4 209 19.4Social assistance 48,666 132,513 227 80,943 66.3 247,456 86.7 255 12.3State pension 15,443 33,676 0 0 0 0 -100 0 -M<strong>in</strong>imum pensionsupport44,747 52,306 97 47,931 7.1 76,257 45.8 133 37.1Total 581,279 681,665 +17.3Sources: Own calculations, microsimulation model;M<strong>in</strong>istry of Labour, Family and Social Affairs, 2011;Institute for Pension and Disability Insurance, 2010.The results shown <strong>in</strong> Table 8 reveal that <strong>the</strong> reform of social benefits will lead to higher governmentexpenditure as <strong>the</strong> aggregate amount of benefits will rise by 17.3%. We should keep all <strong>the</strong>assumptions and data imperfections <strong>in</strong> m<strong>in</strong>d, which means that <strong>the</strong> predicted numbers only providesome orientation regard<strong>in</strong>g future developments. The number of children entitled to a child benefitwill be reduced by 20% s<strong>in</strong>ce children aged 18 years and more will lose <strong>the</strong> right to <strong>the</strong>se benefits.However, <strong>the</strong> average amount of child benefit will <strong>in</strong>crease, mostly due to <strong>the</strong> higher amounts of7 The name of <strong>the</strong> benefit should be changed, for example to m<strong>in</strong>imum elderly support. However, we keep <strong>the</strong> name topreserve <strong>the</strong> official nam<strong>in</strong>g.10
child benefit for upper secondary students. More than half of all upper secondary students will lose<strong>the</strong> right to a state scholarship, but those keep<strong>in</strong>g this right will receive higher scholarship amounts.On <strong>the</strong> contrary, <strong>the</strong> state scholarship for tertiary students will grow substantially <strong>in</strong> terms of both <strong>the</strong>number of recipients and average amounts. Similarly, social assistance and m<strong>in</strong>imum pensionsupport will also <strong>in</strong>crease significantly. The rise <strong>in</strong> social assistance is expected due to a higherm<strong>in</strong>imum <strong>in</strong>come, higher weights and activity supplements, while <strong>the</strong> <strong>in</strong>creased number of m<strong>in</strong>imumpension support can be expla<strong>in</strong>ed by widen<strong>in</strong>g <strong>the</strong> circle of beneficiaries.The three different measures – G<strong>in</strong>i coefficient, squared coefficient of variation and <strong>the</strong> Atk<strong>in</strong>son<strong>in</strong>dex and squared coefficient of variation 8 – presented <strong>in</strong> Table 9 reveal that <strong>the</strong> overall <strong>in</strong>equalitywill slightly decrease when <strong>the</strong> new legislation is enacted. However, <strong>in</strong>equality changes were notuniform across <strong>the</strong> population; <strong>in</strong>equality among children will <strong>in</strong>crease while <strong>in</strong>equality amongpersons aged 63 years or more will decrease.Table 9: Income <strong>in</strong>equality measures based on household equivalent disposable <strong>in</strong>come 9Inequality measureCurrent legislationNew legislationAll Children 10 Elderly (63+) All Children Elderly (63+)G<strong>in</strong>i 0.3004 0.2732 0.2520 0.2949 0.2747 0.2328Atk<strong>in</strong>son ( 2)0.3762 0.2603 0.1843 0.3798 0.2700 0.1527I 2 0.3833 0.2980 0.2543 0.3722 0.2992 0.2264Source: own calculations, microsimulation model.Additional results of <strong>the</strong> microsimulation are presented <strong>in</strong> Table 10. Individuals are aggregated <strong>in</strong>to10 decile groups regard<strong>in</strong>g household equivalent disposable <strong>in</strong>come. The first column presentsannual average disposable <strong>in</strong>come, while all <strong>the</strong> o<strong>the</strong>r columns present <strong>the</strong> shares of a particularsocial benefit by <strong>in</strong>come deciles.The results <strong>in</strong> Table 10 show that <strong>the</strong> reform leads to a relatively modest <strong>in</strong>crease <strong>in</strong> equalised<strong>in</strong>come and a change <strong>in</strong> <strong>the</strong> <strong>in</strong>come distribution s<strong>in</strong>ce <strong>in</strong>comes at <strong>the</strong> bottom of <strong>the</strong> <strong>in</strong>comedistribution will <strong>in</strong>crease at an above-average rate. After <strong>the</strong> new legislation is enacted, more socialassistance will be disbursed to persons <strong>in</strong> <strong>the</strong> second and third <strong>in</strong>come deciles. Similarly, <strong>the</strong> statescholarship will be spread across <strong>the</strong> first seven <strong>in</strong>come deciles, whereas it is currently focused on<strong>the</strong> first three <strong>in</strong>come deciles. On <strong>the</strong> contrary, m<strong>in</strong>imum <strong>in</strong>come support is presently not disbursedto people <strong>in</strong> <strong>the</strong> first <strong>in</strong>come decile as <strong>the</strong> right to this benefit is l<strong>in</strong>ked to <strong>the</strong> right to a pension. The8 All three measures are calculated accord<strong>in</strong>g to Cowel (1977).9 Household disposable <strong>in</strong>come is calculated as <strong>the</strong> sum of net <strong>in</strong>come subject to PIT and <strong>in</strong>come not subject to PIT(social transfers). To calculate equivalent disposable <strong>in</strong>come, <strong>the</strong> OECD’s equivalence scale is used, which gives aweight of 1 for <strong>the</strong> first adult (over 16 years), a weight of 0.7 for <strong>the</strong> second and subsequent adult and a weight of 0.5 forany child.10 A child is def<strong>in</strong>ed as a person below 18 or 26 years if <strong>the</strong>y are a full-time student.11
eform will change <strong>the</strong> nature of this benefit which will focus largely on persons from <strong>the</strong> first two<strong>in</strong>come deciles.Table 10: Average equalised <strong>in</strong>come and shares of social benefits by <strong>in</strong>come deciles under <strong>the</strong>current and new legislationIncomedecileAverage equalised<strong>in</strong>come, <strong>in</strong> EURSocialassistance Child benefit Income pensionsupportCurrent legislationState scholarship(upper secondarystudents)State scholarship(tertiary students)1 1,706 67.1 13.5 0.2 20.0 19.32 4,116 31.9 25.5 30.5 33.8 29.23 5,876 0.8 16.8 38.5 26.1 27.94 6,953 0.1 13.2 15.8 14.8 17.05 7,923 0.0 10.0 6,0 4.2 5.26 8,933 0.1 7.4 5.3 0.9 0.87 10,084 0.0 5.1 2.0 0.2 0.58 11,538 0.1 4.2 0.9 0.0 0.19 13,807 0.0 3.6 0.5 0.0 0.110 21,386 0.0 0.6 0.3 0.1 0.0Total 9,457 100 100 100 100 100New legislation1 2,028 55.7 13.8 32.7 10.2 10.32 4,362 41.2 26.2 46.2 18.8 16.33 5,802 2.4 16.9 16.1 17.5 16.64 6,925 0.4 13.4 3.1 15.7 13.85 7,984 0.1 10.3 0.8 13.0 14.06 9,025 0.0 7.6 1.1 13.8 13.47 10,161 0.1 4.7 0.1 9.1 12.08 11,540 0.0 3.6 0.0 1.8 3.49 13,782 0.0 2.9 0.0 0.0 0.310 21,382 0.0 0.5 0.0 0.0 0.0Total 9,517 100 100 100 100 100Source: own calculations, microsimulation model.To avoid a (too) big volume of <strong>in</strong>formation, <strong>in</strong> <strong>the</strong> rest of this section we only compare <strong>the</strong> <strong>in</strong>comesituation of different family types after <strong>the</strong> change <strong>in</strong> legislation. The results <strong>in</strong> Table 11 reveal that<strong>the</strong> reform will improve <strong>the</strong> <strong>in</strong>come position of approximately one-third of families with pre-schoolchildren, and make it worse for <strong>the</strong> ano<strong>the</strong>r third of families with children. Families with uppersecondary students will experience a drop <strong>in</strong> <strong>the</strong> average amount of social benefits, although <strong>the</strong>share of families better off is higher than <strong>the</strong> share of families worse off. Conversely, <strong>the</strong> elderly willreceive considerable higher social benefits on average, although <strong>the</strong> share of families with worse offelderly is relatively high. The reason lies <strong>in</strong> <strong>the</strong> changed nature of this benefit and <strong>the</strong> redistributionof m<strong>in</strong>imum pension support.12
Table 11: Total effect of <strong>the</strong> forthcom<strong>in</strong>g reform, by family typeFamilies withFamilies betteroff, %Families worseoff, %Annual amount of allbenefits per equivalentadult, currentlegislation, <strong>in</strong> EURAnnual amount of allbenefits per equivalentadult, new legislation,<strong>in</strong> EURPre-school children 31.1 33.4 795 819Children <strong>in</strong> primary school 35.7 35.9 836 848Students <strong>in</strong> uppersecondary education52.8 44.8 1,149 1,069Students <strong>in</strong> tertiaryeducation39.6 60.4 948 1,050Persons aged 63 or more 41.1 37.7 1,010 1,381Notes: Only families receiv<strong>in</strong>g social benefits under <strong>the</strong> current or new legislation are <strong>in</strong>cluded.Source: Own calculations, microsimulation model.5. CONCLUSIONSNew legislation govern<strong>in</strong>g social transfers was adopted <strong>in</strong> July 2010 and is supposed to be enacted <strong>in</strong>June 2011. The <strong>Slovenia</strong>n social transfers system has become characterised by claims that <strong>the</strong> systemwas regulated by too many different acts and <strong>in</strong>stitutions which led to unharmonised official records.Besides, work <strong>in</strong>centives are low and <strong>the</strong> accumulation of benefits is possible. The new legislationchanges <strong>the</strong> eligibility rules for most social benefits which will <strong>in</strong>fluence <strong>the</strong> <strong>in</strong>come position ofbeneficiaries and <strong>the</strong> <strong>in</strong>come distribution. To a certa<strong>in</strong> extent, <strong>the</strong> new legislation is based onestimations performed by <strong>the</strong> microsimulation model which was constructed for <strong>the</strong> purposes of <strong>the</strong>reform. Several adm<strong>in</strong>istrative databases were merged to form a s<strong>in</strong>gle database which conta<strong>in</strong>s asample of 6% of <strong>the</strong> <strong>Slovenia</strong>n population and represents a comprehensive fundament for <strong>the</strong>microsimulation. As <strong>the</strong> results <strong>in</strong> <strong>the</strong> paper show, <strong>the</strong> expected consequences of <strong>the</strong> reform arerelatively extensive and give benefits mostly to <strong>in</strong>dividuals and households at <strong>the</strong> bottom of <strong>the</strong><strong>in</strong>come distribution. However, this reform will harm <strong>the</strong> government budget <strong>in</strong> <strong>the</strong> short run asexpenditure on <strong>the</strong> simulated social benefits is supposed to rise by EUR 100.4 million (by 17% atcurrent expenditure for <strong>the</strong> simulated benefits). At <strong>the</strong> moment <strong>Slovenia</strong> faces an unfavourablef<strong>in</strong>ancial situation. The general government deficit <strong>in</strong> 2010 was estimated at EUR 1,987 million or5.5% of GDP and general government consolidated gross debt at <strong>the</strong> end of 2010 at EUR 13,704million or 38.0% of GDP (Statistical Office of <strong>the</strong> Republic of <strong>Slovenia</strong>, 2011). Therefore, <strong>the</strong><strong>Slovenia</strong>n government postponed <strong>the</strong> enforcement of both Acts to <strong>the</strong> beg<strong>in</strong>n<strong>in</strong>g of 2012. Animproperly established <strong>in</strong>formation system and <strong>in</strong>adequate official records contributed to thispostponement.13
REFERENCESCowell F.A. (1977), Measur<strong>in</strong>g Inequality, Oxford: Philip Allan.Čok M (2002) “A <strong>Microsimulation</strong> Model for <strong>Slovenia</strong>’s Personal Tax System”, Economic andBus<strong>in</strong>ess Review, 4(1), 75-92.Institute for Pension and Disability Insurance (2008, 2010). Annual report 2008-2011. (available at:http://www.zpiz.si/wps/wcm/connect/zpiz+<strong>in</strong>ternet/zpiz/prvastran/publikacije/letnaporocila)Government of <strong>the</strong> Republic of <strong>Slovenia</strong> (2011). National <strong>Reform</strong> Programme 2011-2012. Ljubljana,April 2011.Majcen B, Čok M, Verbič M and Kump N (2007) Razvoj <strong>in</strong> uporaba mikrosimulacijskega modela.Ljubljana: Inštitut za ekonomska raziskovanja.Majcen B, Bayar A, Mohora C, Čok M, et al. (2006) Analiza kompleksnih sektorskih <strong>in</strong> makrouč<strong>in</strong>kov davčne reforme <strong>in</strong> reforme socialnih transferjev z uporabo d<strong>in</strong>amičnega modela splošnegaravnotežja slovenskega gospodarstva, Ljubljana: Inštitut za ekonomska raziskovanja.M<strong>in</strong>istry of Labour, Family and Social Affairs (2011). Statistics. (available at:http://www.mddsz.gov.si/si/uveljavljanje_pravic/statistika/)Redmond G, Su<strong>the</strong>rland H and Wilson M (1998) The Arithmetic of Tax and Social Security <strong>Reform</strong>.A User’s Guide to <strong>Microsimulation</strong> Method and Analysis, Cambridge: Cambridge University Press.Statistical Office of <strong>the</strong> Republic of <strong>Slovenia</strong> (2011). Ma<strong>in</strong> aggregates of <strong>the</strong> sector GeneralGovernment, <strong>Slovenia</strong>, 2007 – 2010. Ljubljana: Statistical Office of <strong>the</strong> Republic of <strong>Slovenia</strong>.(available at: http://www.stat.si/eng/novica_prikazi.aspx?id=3820).Stropnik, N. and Stanovnik T. (2002). Combat<strong>in</strong>g Poverty and Social Exclusion - Volume 2, A CaseStudy of <strong>Slovenia</strong>. Budapest: International Labour Office.The Exercise of Rights to Public Funds Act. Official Gazette of <strong>the</strong> Republic of <strong>Slovenia</strong>, No.62/201).The F<strong>in</strong>ancial Social Assistance Act. Official Gazette of <strong>the</strong> Republic of <strong>Slovenia</strong>, No. 61/2010.14


