Direct Numerical Simulation of Autoignition in a Jet in a Cross-Flow ...
Direct Numerical Simulation of Autoignition in a Jet in a Cross-Flow ... Direct Numerical Simulation of Autoignition in a Jet in a Cross-Flow ...
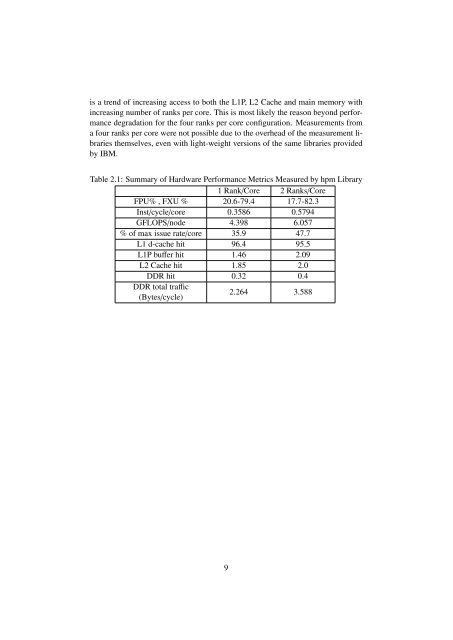
MPI_Allreduce 19296 2716.7 17.573...etc.-----------------------------------------------------------------total communication time = 28.919 seconds.total elapsed time = 195.156 seconds.heap memory used = 103.090 MBytes.Although the MPI-time is dominated by synchronization (MPI_Allreduceduring global inner product evaluation for the linear system solve step for the velocity,pressure and thermo-chemistry), it is still representing only about 14% of thetotal execution time. The communication as well as total execution/elapsed timefor all MPI-ranks is plotted in figure 2.3. It can be seen that the communicationtime as well the total elapsed time (and hence the computation time) is approximatelyuniform across all MPI-ranks, an indication of load balancing between theMPI ranks.Figure 2.3: Communication and elapsed time for MPI ranks collected with IBM’sHPC Toolkit2.2.4 Hardware PerformanceHardware performance metrics are written tohpm_summary.rank files. The filelists information about the overall performance of the whole code as well as informationabout the bracketed segment of the code (the time stepper in this case).Table 2.1 shows that with the use of two MPI-ranks per core the floating pointoperations per second per node has increased from 4.398 to 6.057 GFLOPS ensuringhigher utilization of the core compute-power. Finally, it can be seen that there8
is a trend of increasing access to both the L1P, L2 Cache and main memory withincreasing number of ranks per core. This is most likely the reason beyond performancedegradation for the four ranks per core configuration. Measurements froma four ranks per core were not possible due to the overhead of the measurement librariesthemselves, even with light-weight versions of the same libraries providedby IBM.Table 2.1: Summary of Hardware Performance Metrics Measured by hpm Library1 Rank/Core 2 Ranks/CoreFPU% , FXU % 20.6-79.4 17.7-82.3Inst/cycle/core 0.3586 0.5794GFLOPS/node 4.398 6.057% of max issue rate/core 35.9 47.7L1 d-cache hit 96.4 95.5L1P buffer hit 1.46 2.09L2 Cache hit 1.85 2.0DDR hit 0.32 0.4DDR total traffic(Bytes/cycle)2.264 3.5889
- Page 1 and 2: ANL/ALCF/ESP-13/3Direct Numerical S
- Page 3 and 4: ANL/ALCF/ESP-13/3Direct Numerical S
- Page 5 and 6: AbstractAutoignition in turbulent f
- Page 7 and 8: Chapter 1IntroductionUnderstanding
- Page 9 and 10: 1.1.1 Summary of Numerical Simulati
- Page 11 and 12: Figure 2.1: MPI threading efficienc
- Page 13: • A utility hpmcount, which start
- Page 17 and 18: BibliographyCohen, S. and Hindmarsh
is a trend <strong>of</strong> <strong>in</strong>creas<strong>in</strong>g access to both the L1P, L2 Cache and ma<strong>in</strong> memory with<strong>in</strong>creas<strong>in</strong>g number <strong>of</strong> ranks per core. This is most likely the reason beyond performancedegradation for the four ranks per core configuration. Measurements froma four ranks per core were not possible due to the overhead <strong>of</strong> the measurement librariesthemselves, even with light-weight versions <strong>of</strong> the same libraries providedby IBM.Table 2.1: Summary <strong>of</strong> Hardware Performance Metrics Measured by hpm Library1 Rank/Core 2 Ranks/CoreFPU% , FXU % 20.6-79.4 17.7-82.3Inst/cycle/core 0.3586 0.5794GFLOPS/node 4.398 6.057% <strong>of</strong> max issue rate/core 35.9 47.7L1 d-cache hit 96.4 95.5L1P buffer hit 1.46 2.09L2 Cache hit 1.85 2.0DDR hit 0.32 0.4DDR total traffic(Bytes/cycle)2.264 3.5889


