Buffalo Bulletin 2013 Volume 32 (Special Issue 1) - International ...
Buffalo Bulletin 2013 Volume 32 (Special Issue 1) - International ...
Buffalo Bulletin 2013 Volume 32 (Special Issue 1) - International ...

You also want an ePaper? Increase the reach of your titles
YUMPU automatically turns print PDFs into web optimized ePapers that Google loves.
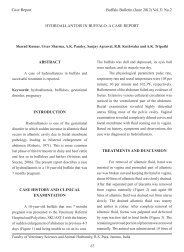
Keynote LectureWorld <strong>Buffalo</strong> Production: Challenges in Meat and MilkProduction, and Mitigation of Methane EmissionMetha WANAPAT * and Sungchhang KANG<strong>Buffalo</strong> <strong>Bulletin</strong> <strong>2013</strong> Vol.<strong>32</strong> (<strong>Special</strong> <strong>Issue</strong> 1): 1-21Tropical Feed Resources Research and Development Center (TROFREC),Department of Animal Science, Faculty of Agriculture, Khon Kaen University,Khon Kaen 40002, Thailand*Corresponding email: metha@kku.ac.thABSTRACT<strong>Buffalo</strong> (Bubalus bubalis), the long-time ruminant animal contributing to theintegrated farming systems, as a source of draft power, transportation, on-farmmanure, meat, milk and livelihood of the farmers. The increase in meat consumptionis quite dramatic, due to the linearly increase in the world population especially inthe developing countries. As buffaloes have been raised by the rural farmers, welladaptedto harsh environment and are capable of utilizing low quality roughagesespecially the agricultural crop-residues and by-products, hence their potential aretherefore remarkable in terms of meat and milk production using locally availablefeed resources. Furthermore, the quality of buffalo meat has been found high in ironand conjugated linoleic acid (CLA), which are essential for good health. Globalwarming has been attributed by various sources including animal agriculture. Rumenfermentation can be manipulated by many ways in order to increase fermentationefficiency and to mitigate methane production. Although the world buffalopopulation has been slightly increasing, their vital role are accountable for thedemand of meat and milk. Manipulation of the rumen in reducing methane usingchemicals, feed additives, roughage and concentrate utilization, use of plantscontaining secondary compound, oils have been reported. However, among manyapproaches, nutritional manipulation by using feeding management and especiallythe use of plant extracts or plant containing secondary compounds (condensedtannins and saponins) have been receiving more attention and most promising. Atthe current stage, more research concerning this hot issue with the role of livestockon global warming warrants further research undertakings. It is therefore highlyrecommended for those engage in buffalo production to do more research and toexpand the world buffalo production in order to meet the increasing demand of meatand milk. In addition, infrastructure and human resources development requireindicate and continuous implementation as well as higher input contribution.Keywords: buffalo production, global warming, methane production, nutritionalmanipulation, rumen fermentationAccepted April 10, <strong>2013</strong>; Online November 11, <strong>2013</strong>.1
<strong>Buffalo</strong> <strong>Bulletin</strong> <strong>2013</strong> Vol.<strong>32</strong> (<strong>Special</strong> <strong>Issue</strong> 1): 1-21INTRODUCTIONCurrently, livestock systems have both positive and negative effects on thenatural resource base, public health, social equity and economic growth (WorldBank, 2009). Animal agriculture has been an important component in the integratedfarming systems in the crop-livestock farming systems in developing countries. Itserves in a paramount diversified role in producing animal protein food, draft power,farm manure as well as ensuring social status-quo and enriching livelihood. As theworld population is expected to increase from 6 billion to about 8.3 billion in theyear 2030 with the average growth of 1.1 per annum, it is essential and vital to beprepared to produce sufficient protein animal food for the increased populationespecially in the developing countries. It has been reported that consumption ofanimal food was 10 kg per annum in 1960s and increased to 26 kg per annum in theyear 2000 and is expected to be 37 kg per annum in the year 2030, respectively(FAO, 2008; 2009).The world buffalo population is estimated to be approximately 177.25million, spreading in some 42 countries of which 171 million (97%) of them arefound in Asia, while approximately 5.38 million (3%) are found in the rest of theworld (FAO, 2008). The major source of the buffalo meat, especially, in Asia wheremeat from ruminants constitute only about 21.0% of the total meat production,buffalo meat is about 11.5% of the total ruminant meat, and about 2.7% of all meatproduced in the region (Cruz, 2010). In the past century, the buffalo meat in theworld was not accepted by the consumers and there was no market. However, theactual trends in consumption require meat with low fat content, therefore,nontraditional meat become an important source. Among them, buffalo meat hashigh protein level, low fat and cholesterol content compared to beef (Murthy &Devadason, 2003). Hence, researchers are trying to improve buffalo of potentialbreeds and meat quality for human consumption. According to Heintz (2001) it wasfound that when compared to meat from young buffalo and young cattle, has clearlyshown that buffalo meat is indeed as good as cattle meat. Moreover, buffalo meat isrequired with the population increased, requirements of food, in developingcountries, particularly, trend of the market in the world, the price of buffalo milk istwice that of cows' milk, buffalo skin is used in the leather industry and buffalo fecesis used for manures and fuel in rural areas.Global warming is a hot issue which affects environment and livestockproduction. Total emissions of greenhouse gases (GHGs) from agriculture, includinglivestock, are estimated to be between 25 – <strong>32</strong>%, depending on the source (USEPA,2006; IPCC, 2007) and on the proportion of land conversion that is ascribed tolivestock activities. Moreover, Goodland and Anhang (2009) reported that livestockproduction and its by-products are responsible for at least 51 percent of globalwarming gases or account for at least <strong>32</strong>.6 billion tons of carbon dioxide per year.While, CO 2 is the largest green house gases at 55-60% and methane are the secondgreen house gases at 15-20%. Therefore, livestock is the one sector of methaneproducer from the rumen. It has been estimated that global anthropogenicgreenhouse gas (GHG) emissions from the livestock sector approximate to between4.1 and 7.1 billion tonnes of CO 2 equivalents per year, equating to 15-24% of totalglobal anthropogenic GHG emissions (Steinfeld et al., 2006). Currently, researchers2
<strong>Buffalo</strong> <strong>Bulletin</strong> <strong>2013</strong> Vol.<strong>32</strong> (<strong>Special</strong> <strong>Issue</strong> 1): 1-21try to reduce methane production in the rumen by using many feed additives toinhibit methanogenesis. Meanwhile, plants produce a diverse array of plantsecondary metabolites to protect against microbial and insects attacks (Wallace,2004). These natural plant ecochemicals such as essential oils (EO), saponins,tannins and organosulphur compounds have been shown to selectively modulate therumen microbial populations (Wallace, 2004; Patra & Saxena, 2009a), resulting inan improvement of rumen fermentation and nitrogen metabolism, and a decrease inmethane production and nutritional stress such as bloat or acidosis, thus improvingthe productivity and health of animals (Wallace et al., 2002; Kamra et al., 2006;Rochfort et al., 2008). Recently, a number of studies have discussed the potential ofplant bioactives as modifiers of rumen microbial fermentation and ruminantproduction (Wallace et al., 2002; Wallace, 2004; Hart et al., 2008; Calsamiglia et al.,2007; Patra & Saxena, 2009b).BUFFALO POPULATION AND VITAL ROLE IN FARMING SYSTEMThe world population of buffalo (Bubalus bubalis) has been estimated atover 140 million head (FAO, 1991; Borgese, 2005). Therefore, these are more than97% found in Asia and the Pacific region, mainly in India (75 million), China (21million), Pakistan (14 million) and Thailand (6 million and decrease to about 2millions in 2010). Moreover, the world buffalo population were increased andestimated to be approximately 177.24 million, spreading in some 42 countries ofwhich 171 million (97%) of them are found in Asia, while approximately 5.38million (3%) are found in rest of the world (FAO, 2008). In fact, buffalo populationwere be distributions in major buffalo producing countries in Asia, therefore, in theAsian buffaloes dominate the world population, representing 96.4% of theworldwide population of 180.70 million as of 2008 (Table 1; FAO, 2010). Withinthe Asian region, about 74.8% of buffaloes are in the South, 12.8% in East Asia, andonly 8.4% are found in South-East Asia. Moreover, buffalo productions are foundsome of minimum, about 0.626% in America, 0.22% in Europe, 2.895% in Africa(Cruz, 2010). In fact, buffalo population will be popular in the world market with thegood quality of meat and still play important role in some certain regions, especiallyin developing countries. These are slightly increases of buffalo population in manyregions, except those in South East Asia with slight decrease (Table 1).<strong>Buffalo</strong>es produce meat, milk, saving bank, draft power, transportation, andother purpose for human and on-farm manure to crop farming. Therefore, feedutilization of buffaloes is more effective than cattle when cattle and buffaloes werekept under similar conditions, particularly well-adapted to harsh environment andare capable of utilizing low quality roughages especially the agricultural cropresiduesand by-products, hence their potential are therefore remarkable in terms ofmeat and milk production using locally available feed resources. However, decreasein the number of buffaloes has been occurring in some countries in the world due toseveral factors: holsteinization, mechanization, and the poor market demand forbuffalo products (Borghese, 2010) and others like high rate of formal slaughteringand insufficiency input for research and development by government agencies(Wanapat, 1999). However, some countries, buffalo numbers have increased due tothe demand for particular products obtained from buffalo milk and meat to both on3
<strong>Buffalo</strong> <strong>Bulletin</strong> <strong>2013</strong> Vol.<strong>32</strong> (<strong>Special</strong> <strong>Issue</strong> 1): 1-21the national and international market.BUFFALO PRODUCTION SYSTEMSFeeding of ruminants in the tropical area, could be separated depending onseasons, particularly, dry and rainy season. However, these ruminants oftenencounter low productivity because of deficiencies in feed supply, in both qualityand quantity (Wanapat & Devendra, 1992). The use of rice straw as a feed in the dryseason, in spite of its low nutritive value, has been a common feeding system,generally practiced by smallholder farmers when green forages are often scarce(Wanapat, 1999). Available local feed resources have been recommended for usesunder smallholder farming (Wanapat, 2009). However, buffalo in the tropical areafor feeding systems are based on unrestricted grazing, tethering or stall-feeding andfree grazing, sometimes under the control of herders, is common in countries withnative grasslands and fallows. Tethering and stall-feeding are practiced in areaswhere there is limited land and with cropping. In many situations, there appeared tobe roughage limitations for animals in the stall-feeding and tethering systemsWanapat & Chanthakhoun (2009). Currently, Singh & Barwal (2010) reported thatin India, due to the better animal husbandry practices significant improvement hastaken place in the buffalo production system in rural areas. The awareness in thefarmers about the feeding, breeding and health management of live-stockconsiderably increased. The buffalo production system in rural areas may beclassified as: 1). Extensive: small farm, with a maximum of 2 buffaloes, kept onnatural grasses, in communal paddocks during the rainy season. Agricultural byproductsare used for feeding, marginal land, family labour and minimuminvestment, with simple, traditional technology; 2). Semi Intensive: animals are keptin irrigated areas, with cultivated fodders, crop by-products and concentrates.<strong>Buffalo</strong>es are confined in adequate buildings; and 3). Intensive: Herd strength rangesfrom 5 to 100 buffaloes, kept for milk production as in Haryana, Punjab, UttarPradesh, Rajasthan, Gujrat and close to the large populated areas in India. The herdsare fed on cultivated fodders and concentrate.In many of these systems, the livestock element is interwoven with cropproduction, as in the rice/buffalo or cereal/cattle systems of Asia (Devendra, 2007).Animal manure is often essential for maintaining soil fertility, and the role ofanimals in nutrient cycling is often an important motivation for keeping animals,particularly where this involves a transfer of nutrients from common propertyresources to private land. In other cases, such as the seminomadic pastoral systemsof the world’s natural grassland regions, environmentally stable balances of humansociety, animal population and vegetative biomass have been maintained forcenturies. On the contrary, livestock production currently supports and sustains thelivelihoods of an estimated 675 million rural poor (Steinfeld et al., 2006). Thesepeople fully or partially depend on livestock for income and/or subsistence.Livestock can provide a steady stream of food and revenues and help to raise wholefarm productivity; livestock are often the only livelihood option available to thelandless because they allow the exploitation of common-property resources forprivate gain (Chantalakhana & Skunmun, 2002; Wanapat, 2009; Nardone et al.,2010). <strong>Buffalo</strong> production systems are variable between developed and developing4
<strong>Buffalo</strong> <strong>Bulletin</strong> <strong>2013</strong> Vol.<strong>32</strong> (<strong>Special</strong> <strong>Issue</strong> 1): 1-21regions, by far the largest variation in intensity of production is found within thesystem, which is the largest producer of buffalo products countries, though thedeveloping regions are dependable on the system’s production worldwide.<strong>Buffalo</strong> meat production<strong>Buffalo</strong> meat production, it was reported that about 88% of world buffalomeat is in Asia and over 21 million buffaloes slaughtered annually in Asia, 48% areslaughtered in India and about 18% each in Pakistan and China. Pakistan annuallyproduces 0.68m tones of buffalo meat valued at 102 billion ($ 1.3 billion).Therefore, in developing countries of Asia where meat from ruminants constituteonly about 21.0% of the total meat production, buffalo meat is about 11.52% of thetotal ruminant meat, and about 2.7% of all meat produced in the region. The averageannual growth rate in production was about 1.3%. Undoubtedly, the majority ofworld's buffalo meat is in Asia, representing 91.89% and with volume of 3.08M tonsin 2008 (FAO, 2010). Neath et al. (2007) reported that feeding trials comparingbuffalo and cattle of similar age, feeding regime and carcass treatment, clearlydemonstrated that there is ample scientific evidence to show that buffalo meat aremore tender than beef. Anjaneyulu et al. (2007) reported that buffalo meat has beenrecognized as one of the healthiest meats for human consumption. It has outstandingattributes such as: lower intramuscular fat, lower cholesterol and calories, higherunits of essential amino acids, higher biological value, and higher mineral content.The quality of buffalo meat has been markedly improved with crossbreds and inAustralia it is hoped to be the future standard in the “Tender Buff Program”, whichhas gained much popularity. Compared to beef, buffalo meat contains one % lessintramuscular fat, 92% less saturated fat, 25% less calories, 67% less cholesterol, 11to 30% more protein, 10% more minerals, low cholesterol in buff meat has been reemphasizedby Lazar (2001) (Table 2).<strong>Buffalo</strong> milk productionRecently, buffalo milk production in Asia represents 96.78% of the totalvolumes of world's buffalo milk of 89.2 Million tons. Production in South andSouthwest Asia, primarily from India and Pakistan contributed a hefty 93.17%(FAO, 2010). <strong>Buffalo</strong>es are significant sources of milk in this sub-regioncontributing as high as 68.35% of the total milk yield in Pakistan, and 56.85% intotal milk production in India. Average annual growth rate in buffalo milkproduction between the years 1998 to 2008 was 4.39% in the whole of Asia.Evidently, this growth level can readily be associated with the consistent goodgrowth in milk production in India and Pakistan, with combined growth rate of4.52%. <strong>Buffalo</strong> milk production in China has not been as robust as in the SouthAsia, with average annual growth of 1.6%. What is notable is the 8.18% averageannual growth in SEA, though in relative volume, such increases have not been verysignificant. Among the SEA countries, Myanmar registered the highest buffalo milkproduction, apparently because it has the highest population of dairy buffalo ofabout 40,000 hd as of 2000 (Hlaing, 2001). <strong>Buffalo</strong> milk production from the otherSEA countries are coming mainly from smaller population of introduced riverinebuffaloes and the resulting crossbreds of the dairy breed with the existing swamp5
<strong>Buffalo</strong> <strong>Bulletin</strong> <strong>2013</strong> Vol.<strong>32</strong> (<strong>Special</strong> <strong>Issue</strong> 1): 1-21buffalo population. In this sub region where farmers tend their animals primarily forwork, only a small %age of crossbreds produced are fully utilized for milkproduction. Comparative milk composition in buffalo and cow as present in Table 5and was shown that buffalo milk is healthy as it is richer in saturated fatty acids. TheIndian diet is mainly vegetarian and people relish the hot thick creamy milk for theirbreakfast associated with higher fat content (Table 3). Swamp buffalo milk has evenhigher fat (7.9%), protein (4.2%), Calcium (264.0 mg/100 g) and Cholesterol (0.65mg/g).Potential buffalo production on various marketsCurrently, buffalo markets in the world, especially, in Asia have beenincreasingly emerging to produces good quality meat and milk and with highacceptability by consumers. As shown by the increase in buffalo meat exports ofabout 159,703 MT in 1995-96 to as much as 456,907 MT in 2008-2009. Export of<strong>Buffalo</strong> meat from India rose 2 folds in volume from 234,355M tons in 2001 to456,907M tons in 2009, and by more than 400% in value from US$243.4M toUS$1.043B during the same period. Interestingly, Vietnam, Malaysia and thePhilippines get about 43.13% of the total Indian buffalo export 2008-2009, the restwent to 10 other countries in the Middle East (Borghese, 2010). In the Philippines,practically all brands of processed corned beef are derived from imported Indianbuffalo meat constituting more than 60.0% of the total buffalo supply in thePhilippines. This has allowed significant growth in the local meat processingindustry in the country (Borghese, 2010). Intensive feeding of male buffaloes incommercial feedlot for quality meat production started in 1999. Male calves at theage of 8-10 months are purchased from farmers and are fed high protein/high energydiet to put on additional weight of 120 kg in 4 months. Murrah yearling grow by 0.9to 1.0 kg/day and would have high dressing %age (Ranjhan, 2004). <strong>Buffalo</strong> meatand mike consumer demand and of market possibilities, the modern appliedtechnologies on milk and meat processing and industry, could be a serious basis toincrease the availability of quality products for a positive trend of buffalodevelopment and of higher profits for farmers and linked companies (Borghese,2010). Meat export is desired to effectively utilize the available livestock resourcesand improve returns to the farmers by popularizing buffalo meat (Kadeephan et al.,2009). <strong>Buffalo</strong> meat is the major item of Indian animal product export comprising48.76% of the total animal products exported. The major destinations of buffalomeat include Malaysia, USA, Jordan, Oman and UAE. <strong>Buffalo</strong> meat is exported tothe tune of 306,970.81 MT amounting 1,615.59 cores which is the highestamong all animal products exported from India.There are 22.72 million buffalos in China in 2007, representing 17.37% of allcattle in the whole country (BingZhuang et al., 2010). According to statistical data(FAO, 2008), the output of buffalo meat in China was 0.306 million tons. Most ofthe meats were directly sold to consumers, only few meats were processed tobyproducts such as dried beef, sausages and hams. The output of buffalo hide in2007 is 92 thousand tons (FAO, 2008), the hides were made into various products,which were sold well on the market. The crossbreeding of buffalos has beenperformed for many decades, while the number of crossbred buffalos for milking is6
<strong>Buffalo</strong> <strong>Bulletin</strong> <strong>2013</strong> Vol.<strong>32</strong> (<strong>Special</strong> <strong>Issue</strong> 1): 1-21not large. According to statistics of Cao et al., there were 30000 milking buffalos inChina in 2006, 61.5% of them were crossbreds, while 38.5% of them were localbuffalos. The buffalo milk production was 0.29 million tons in China in 2008. Thebuffalo dairy industry in China is a newly emerging industry, with great potentialand promising prospect. Chinese government has attached great importance andincreased input to the exploitation of buffalo industry during recent years, thegovernment has also programmed the medium and long term development of buffaloindustry. In the coming 10 years, the population of buffalo for milking will achieve0.5 million, it brings opportunities to development of buffalo dairy industry.According to Borgese (2005), in the Philippines there were 3.2 millionCarabao buffaloes, 99 percent belong to small farmers that have limited resources,low income and little access to other economic opportunities. The CarabaoDevelopment Programme is a massive programme started in 1993 to improve thenative Swamp buffalo locally known as the Carabao to develop their meat, milk anddraught potential. An elite herd of Riverine buffalo has now been established at thePhilippine Carabao Center, Science City of Muñoz, by importing about 3,000Murrah buffaloes with pedigree performance records from Bulgaria. Each femalecrossbred when raised for milk can produce about 1,350 kg of milk per lactation(Cruz, 2003). In the past Thailand had the second largest number of Swamp buffaloin the world. However this buffalo population drastically declined from 4.7 millionin 1990 to 1.9 million in 1998. The number of buffaloes has decreased yearly andthe present number is about 2.0 million and is tending to decrease gradually.In Italy particularly the increasing demand for buffalo mozzarella cheeseboth on the national and international markets, the Denomination of ControlledOrigin (DOP) as "Mozzarella di Bufala Campana" for this cheese registered in Italyand in Brussels for the European Union (EU), and the milk quotas on surplus bovinemilk imposed by the EU, led to an increase in the buffalo population of about 142percent from 1993 to 2001 (compared with a 7.8 percent increase in the worldpopulation in the same period) and to an increase of 1600 percent (16 times) from1957 to 2002 (Borgese, 2005). In Italy this increase in the number of buffaloes is notonly remarkable for this percentage increase but also when compared with the trendsin other species, which have all decreased over the last 50 years particularly forcattle, dairy cows and horses. In South America, although the herd size of buffaloeshave been small, but have been increasing interest and development of buffalopopulation in various countries including Brazil, Venezuela, Argentina and others toincrease the herds and production efficiency in meat and milk, especially for cheeseproduction (Borghese, 2005).GREENHOUSE GAS AND METHANE EMISSION BY LIVESTOCKLivestock are already well-known to contribute to GHG emissions.Livestock’s Long Shadow, the widely-cited report by the United Nations Food andAgriculture Organization (FAO), estimates that 7,516 million metric tons per year ofCO 2 equivalents (CO 2 ), or 18 percent of annual worldwide GHG emissions, areattributable to cattle, buffalo, sheep, goats, camels, horses, pigs, and poultry.Livestock contribute about 9% of total carbon dioxide (CO 2 ) emissions, but 37% ofmethane (CH 4 ), and 65% of nitrous oxide (N 2 O) (Steinfeld et al., 2006). That7
<strong>Buffalo</strong> <strong>Bulletin</strong> <strong>2013</strong> Vol.<strong>32</strong> (<strong>Special</strong> <strong>Issue</strong> 1): 1-21amount would easily qualify livestock for a hard look indeed in the search for waysto address climate change. But new analysis shows that livestock and theirbyproducts actually account for at least <strong>32</strong>,564 million tons of CO 2 per year, or 51percent of annual (Goodland &Anhang, 2009). This report has brought an alarmingcall and has created high interest and lots of debate on the statistics and how it hasbeen estimated. Figure 1, depicts the estimation of methane gas emission fromvarious sources especially from the livestock enteric fermentation, which accountsfor 28 % of the total methane emission.Animal production plays four important roles in the release of gases into theatmosphere, as reported by Leng (2011), as follows;• directly through production of methane in fermentative digestion ofruminants• indirectly when a proportion of the fecal materials decompose anaerobically• indirectly through CO 2 production from fossil fuels to provide the productionand marketing infrastructure and inputs such as motorized transport,fertilizers, herbicides and insecticides• through the clearing of forests and range lands, the timber on which was anatural sink for carbon dioxide.METHANOGENSRumen ecology is an unique environment where anaerobic fermentationprocess occurs by the reaction of the rumen microorganisms namely bacteria,protozoa and fungi. The main fermentation end-products are those of volatile fattyacids, ammonia nitrogen (used for microbial protein synthesis), and methaneproduction. All feeds especially, roughages will be degraded by the microorganismsby cellulolytic bacteria via the Embden Myerhof Parnas pathway from glucose topyruvate and further to the synthesis of the short chain volatile fatty acids (VFAs);acetate (C2), propionate (C3), butyrate (C4), valerate (C5), caproate (C6). TheseVFAs are used as major sources of energy for the ruminants. In addition, hydrogenproduced in the rumen will be trapped by methanogens to produce methane gas andlater be eructated by the ruminants into atmosphere. Fermentation efficiency can bemanipulated by many possible ways including the nutritional feeding strategies(Figure 2; Wanapat, 2012).As reported by Boadi et al. (2004) that methanogens represent a uniquegroup of microorganisms. They possess three coenzymes which have not been foundin other microorganisms. The three coenzymes are: coenzyme 420, involved inelectron transfer in place of ferredoxin, coenzyme M, involved in methyl transfer,and factor B, a low molecular weight, oxygen-sensitive, heat-stable coenzymeinvolved in the enzymatic formation of CH 4 from methyl coenzyme M. Five speciesof methanogens were reported to have been isolated in the rumen. These includeMethanobrevibacter ruminantium, Methanosarcina barkeri, Methanosarcina mazei,Methanobacterium formicicum and Methanomicrobium mobile. OnlyMethanobrevibacter ruminantium and Methanosarcina barkeri have been found inthe rumen at populations greater than 106 mL –1 , and are assumed to play a majorrole in ruminal methanogenesis. Methanogens are hydrophobic and therefore stickto feed particles as well as onto the surface of protozoa. The number of8
<strong>Buffalo</strong> <strong>Bulletin</strong> <strong>2013</strong> Vol.<strong>32</strong> (<strong>Special</strong> <strong>Issue</strong> 1): 1-21methanogens associated with protozoa reached a maximum (10 to 100 times prefeedinglevels) after feeding, when the rate of fermentation is the highest. It wasshown that the symbiotic relationship of methanogens and protozoa might generate37% of rumen CH 4 emissions.Dietary manipulation in reducing rumen methaneThere are several factors which can have great impacts on rumen methaneproduction namely level of intake, frequency of feeding, type of roughages, ratio ofroughage to concentrate, type and concentration of non-structural carbohydrates etc.All of these factors can play important roles on rumen pH, volatile fatty acidsproduction, ammonia nitrogen and microbial protein synthesis and the consequenceson rumen methanogens and menthane production, protozoa and cellulolytic bacteria.Boadi et al (2004) and Hook et al. (2010) have proposed numerous potential ways ashow to mitigate the rumen methane production. The main approaches are as follows:improving animal productivity, nutritional and management strategies (type ofcarbohydrates, level of intake, forages type and quality, feeding frequency, roughagetreatment/processing, grazing management,), management of rumen fermentation(propionate enhancers, use of fats and essential oils, use of plant secondarycompounds: condensed tannins and saponins etc (Table 6).Plant secondary compoundsPlant secondary compounds (tannins and saponins) are more important asruminant feed additives, particularly on CH 4 mitigation strategy because of theirnatural origin in opposition to chemicals additives. Tannins containing plants, theantimethanogenic activity has been attributed mainly to condensed tannins. Thereare two modes of action of tannins on methanogenesis: a direct effect on ruminalmethanogens and an indirect effect on hydrogen production due to lower feeddegradation. Also, there is evidence that some condensed tannins (CT) can reduceCH 4 emissions as well as reducing bloat and increasing amino acid absorption insmall intestine. Methane emissions are also commonly lower with higherproportions of forage legumes in the diet, partly due to lower fibre contact, fasterrate of passage and in some case the presence of condensed tannins (Beauchemin etal., 2008). Supplementation of PCH at 600 g/hd/d was beneficial in swamp buffaloesfed rice straw as a basal roughage, as it resulted in increased DM intake, reducedprotozoal and methane gas production in the rumen, increased N retention as well asefficiency of rumen microbial CP synthesis (Chanthakhoun et al., 2011). Legumescontaining condensed tannin (e.g., Lotuses) are able to lower methane (g kg -1 DMintake) by 12-15% (Beauchemin et al., 2008; Rowlinson et al., 2008). Also, someauthors reported that condensed tannins to reduce CH 4 production by 13 to 16%(DMI basis) (Grainger et al., 2009; Woodward et al., 2004), mainly through a directtoxic effect on methanogens. More recently Woodward et al. (2004) carried out asimilar trial with cows fed Lotus corniculatus, on methane was 24.2, 24.7, 19.9 and22.9 g kg -1 DMI for the respective treatments. The CT in lotus reduced methane kg -1DMI by 13% and the cows fed lotus produced <strong>32</strong>% less methane kg -1 milk solids(fat+protein) compared to those fed good quality ryegrass. It was reported thatextracts from plants such as rhubarb and garlic could decrease CH 4 emissions.9
<strong>Buffalo</strong> <strong>Bulletin</strong> <strong>2013</strong> Vol.<strong>32</strong> (<strong>Special</strong> <strong>Issue</strong> 1): 1-21However, there is only limited information on the effect of different saponins onrumen bacteria.Saponins are natural detergents found in many plants. There have beenincreased interests in saponin-containing plants as possible means of suppressing oreliminating protozoa in the rumen. A decrease in protozoa numbers has beenreported in the rumen of sheep infused with saponins or fed on saponin-containingplants. Decreased numbers of ruminal ciliate protozoa may enhance the flow ofmicrobial protein from the rumen, increase efficiency of feed utilization anddecrease methanogenesis. Saponins are also known to influence both ruminalbacterial species composition and number through specific inhibition, or selectiveenhancement, of growth of individual species. Saponins have been shown to possessstrong defaunating properties both in vitro and in vivo which could reduce CH 4emissions (Rowlinson et al., 2008). Beauchemin et al. (2008) recently reviewedliterature related to their effect on CH 4 and concluded that there is evidence for areduction in CH 4 from at least some sources of saponins, but that not all are effective(Rowlinson et al., 2008). While extracts of CT and saponins may be commerciallyavailable, their cost is currently prohibitive for routine use in ruminant productionsystems. However, still required on the optimum sources, level of CT astringency(chemical composition), plus the feeding methods and dose rates required to reduceCH 4 and stimulate production. Moreover, there have been reports of decreasedmethane emission by ruminants consuming plant secondary compounds (Carulla etal., 2005; Puchala et al., 2005). Supplementation of pellets containing condensedtannins and saponins (MP and soapberry fruit) influenced rumen ecology bysignificantly lowering methane concentration in rumen atmosphere and reducedmethanogen population (Poungchompu et al., 2009). However, high CTconcentrations (>55 g CT/kg DM) may reduce voluntary feed intake anddigestibility (Beauchemin et al., 2008; Grainger et al., 2009). Waghorn et al. (2002)reported a 16% depression in CH 4 emissions kg -1 DMI (13.8 to 11.5 g kg -1 DMI) dueto the presence of CT in a diet of Lotus pedunculatus fed to sheep housed indoors.Processing and preservation of feedsForage processing and preservation affect enteric CH 4 production but limitedinformation with regard to these effects is available in the literature. Methanogenesistends to be lower when forages are ensiled than when they are dried and when theyare finely ground or pelleted than when coarsely chopped (Martin et al., 2010).Grinding or pelleting of forages to improve the utilization by ruminants has beenshown to decrease CH 4 losses per unit of feed intake by 20-40% when fed at highintakes.Roughage and concentrateThe forage to concentrate ratio of the ration has an impact on the rumenfermentation and hence the acetate: propionate ratio (declines with F: C ratio). TheCH 4 reduction is well in line with the observations of Bannink et al. (1997) thatconcentrate rich diets showed lower and higher coefficients of conversion ofsubstrate into acetate and propionate, respectively. However, many experimentaldatabases suggest that a higher proportion of concentrate in the diet leads to a10
<strong>Buffalo</strong> <strong>Bulletin</strong> <strong>2013</strong> Vol.<strong>32</strong> (<strong>Special</strong> <strong>Issue</strong> 1): 1-21reduction in CH 4 emissions as a proportion of energy intake (Blaxter & Clapperton,1965; Yan et al., 2000) due mainly to an increased proportion of propionate inruminal VFA. The scope for reductions in CH 4 emissions depends on the startinglevel of concentrates, as there are dietary limitations and there are large differencesin current usage of concentrates in different regions of the world (Rowlinson et al.,2008). The poor tolerance to low pH by protozoa and cellulolytic bacteria decreasesfurther hydrogen production. A positive correlation between cellulolytic andmethanogens in the rumen of different animal species (cattle, sheep, deer) has beenshown (Rowlinson et al., 2008), except in the buffalo. This exception was explainedby the fact that F. succinogenes, a non-hydrogen-producing cellulolytic species, wasthe major cellulolytic bacteria of this animal. On the contrary to other researchers,Sejian et al. (2011) reported that higher proportion of forage to concentrate resultedin decreasing ruminal methane production. They are stated that lower CH 4production from high forage: grain diet can be attributed to the effect of the highcontent of fat in the diet which could potentially reduce fiber degradation andamount of feed that is fermentable as well as forage grinding effects. Yurtseven &Ozturk (2009) observed that amount of ruminal methane produced from corn waslower than that of barley grain in ruminant. This is may be due to higher starchcontent and slow starch degradability of corn vs. barley grain. With regard to theingredient composition of concentrates, selecting carefully defined carbohydratefractions, such as more starch of a higher rumen resistance and less soluble sugarscould significantly contribute to a reduction in CH 4 emission (Tamminga et al.,2007). Sejian et al. (2011) reported that Total mixed ration (TMR) feeding leads todecrease methane production vs. separate forage-concentrate feeding.Plant oilsThere are five possible mechanisms by which lipid supplementation reducesCH 4 : reducing fibre digestion (mainly in long chain fatty acids); lowering DMI (iftotal dietary fat exceeds 6-7%); suppression of methanogens (mainly in mediumchain fatty acids); suppression of rumen protozoa and to a limited extent throughbiohydrogenation (McGinn et al., 2004; Beauchemin et al., 2008; Johnson andJohnson, 1995). Oils offer a practical approach to reducing methane in situationswhere animals can be given daily feed supplements, but excess oil is detrimental tofibre digestion and productions. Oils may act as hydrogen sinks but medium chainlength oils appear to act directly on methanogens and reduce numbers of ciliateprotozoa (Machmuller et al., 2000). However, Kongmun et al. (2010) reported thatsupplementation of coconut with garlic powder could improve in vitro ruminal fluidfermentation in terms of volatile fatty acid profile, reduced methane losses andreduced protozoal population. In contrast, Johnson et al. (2002) and (2008) found noresponse to diets containing 2.3, 4.0 and 5.6% fat (cottonseed and canola) fed overan entire lactation. Beauchemin et al. (2008) recently reviewed the effect of level ofdietary lipid on CH 4 emissions over 17 studies and reported that with beef cattle,dairy cows and lambs, there was a proportional reduction of 0.056 in CH 4 (g kg -1DM intake) for each 10 g kg -1 DM addition of supplemental fat. While this isencouraging, many factors need to be considered such as the type of oil, the form ofthe oil (whole crushed oilseeds vs. pure oils), handling issues (e.g., coconut oil has a11
<strong>Buffalo</strong> <strong>Bulletin</strong> <strong>2013</strong> Vol.<strong>32</strong> (<strong>Special</strong> <strong>Issue</strong> 1): 1-21REFERENCESAnjaneyulu, A.S.R., R. Thomas and N. Kondaiah. 2007. Technologies for valueadded buffalo meat products-A Review. Am. J. Fd. Tech. 2: 104-114.Anonymous. 1995. Indian Dairy man. 47(8): 63-64.Bannink, A., H.De. Visser, A. Klop, J. Dijkstra and J. France. 1997. Impact of dietspecificinput parameters on simulated rumen function. J. Theor. Biol. 184:371-384.Beauchemin, K.A., M. Kreuzer, F. O'Mara, and T.A. McAllister. 2008. Nutritionalmanagement for enteric methane abatement: A review. Aust. J. Exp. Agric.48: 21-27.Bingzhuang, Y., Y. Chunyan and L. Xianwei. 2010. <strong>Buffalo</strong> production systems inChina. Revista Veterinaria 21(1): 1037.Blaxter, K.L. and J.L. Clapperton. 1965. Prediction of the amount of methaneproduced by ruminants. Br. J. Nutr. 19: 511-522.Boadi, D., C. Benchaar, J. Chiquette and D. Masse. 2004. Mitigation strategies toreduce enteric methane emissions from dairy cows: Update review. Can. J.Anim. Sci. 84: 319-335.Borghese, A. 2005. <strong>Buffalo</strong> production and research. Food and AgricultureOrganization. Reu Technical series pp 67.Borghese, A. 2010. Development and perspective of buffalo and buffalo market inEurope and near East. Proc. 9 th World <strong>Buffalo</strong> Congr. pp 20-31.Calsamiglia, S., M. Busquet, P.W. Cardozo, L. Castillejos and A. Ferret. 2007.Invited review: Essential oils as modifiers of rumen microbial fermentation.J. Dairy Sci. 90: 2580-2595.Carulla, J.E., M. Kreuzer, A. Machmller and H.D. Hess. 2005. Supplementation ofAcacia mearnsii tannins decreases methanogenesis and urinary nitrogen inforage fed sheep. Aust. J. Agric. Res. 56: 961-970.Chantalakhana, C. and P. Skunmun. 2002. Sustainable smallholder animal systemsin the tropics. Kasetsart University Press, Bankok, Thailand.Chanthakhoun, V., M. Wanapat, C. Wachirapakorn and S. Wanapat. 2011. Effect oflegume (Phaseolus calcaratus) hay supplementation on rumenmicroorganisms, fermentation and nutrient digestibility in swamp buffalo.Livest. Sci. 140(1): 17-23Cruz, L.C. 2010. Recent developments in the buffalo industry of Asia. Proc. 9 thWorld <strong>Buffalo</strong> Congr., pp 7-19.Devendra, C. 2007. Perspectives on animal production systems in Asia. Livest. Sci.106: 1–18.FAO. 1991. Food and Agriculture Organization: Selected indicators of food andagriculture development in Asia Pacific Region, 1980-90. FAO RegionalOffice for Asia and the Pacific, Bangkok, Thailand.FAO. 2008. Food and Agriculture Organization. Rome Italy. STAT database.www.fao.org.FAO. 2009. Food Outlook: Global Market Analysis. December 2009. pp 42-51.FAO. 2010. Food and Agriculture Organization. Production Yearbook.13
<strong>Buffalo</strong> <strong>Bulletin</strong> <strong>2013</strong> Vol.<strong>32</strong> (<strong>Special</strong> <strong>Issue</strong> 1): 1-21Goodland, R. and J. Anhang. 2009. Livestock and Climate Change. What if the keyactors in climate change were pigs, chickens and cows. World Watch. 22: 10-19.Grainger, C., T. Clarke, M.J. Auldist, K.A. Beauchemin, S.M. McGinn, G.C.Waghorn and R.J. Eckard. 2009. Mitigation of greenhouse gas emissionsfrom dairy cows fed pasture and grain through supplementation with Acaciamearnsii tannins. Can. J. Anim. Sci. 89(2): 241-251.Hart, K.J., D.R. Yanez-Ruiz, S.M. Duval, N.R. McEwan and C.J. Newbold. 2008.Plant extracts to manipulate rumen fermentation. Anim. Feed Sci. Technol.147: 8-35.Heinz, G. 2001. Water buffaloes as meat animals. Proc. Regional Workshop inWater <strong>Buffalo</strong> Development, Surin, Thailand. pp 10-17.Hlaing, S. 2001. Country report for workshop on water buffalo development-Myanmar. Proc. Regional Workshop in Water <strong>Buffalo</strong> Development, Surin,Thailand. pp 65-69.Hook, S.E., Andr´e-Denis, G. Wright and B.W. McBride. 2010. Methanogens:Methane Producers of the Rumen and Mitigation Strategies. Archaea, ArticleID 945785, 11 pages doi:10.1155/2010/945785.IPCC. 2007. Summary for Policymakers. In: Metz, B., Davidson, O.R., Bosch, P.R.,Dave, R., Meyer, L.A. (Eds.), Climate Change 2007: Mitigation.Contribution of Working Group III to the Fourth Assessment Report of theIntergovernmental Panel on Climate Change. Cambridge University Press,Cambridge, United Kingdom and New York, NY, USA.Johnson, I.R., D.F. Chapman, V.O. Snow, R.J. Eckard, A.J. Parsons, M.G. Lambertand B.R. Cullen. 2008. DairyMod and EcoMod: Biophysical pastoralsimulation models for Australia and New Zealand. Aust. J. Exper. Agric. 48:621-631.Johnson, K.A. and D.E. Johnson. 1995. Methane emissions from cattle. J. Anim. Sci.73: 2483-2492.Johnson, K.A., R.L. Kincaid, H.H. Westberg, C.T. Gaskins, B.K. Lamb and J.D.Cronrath. 2002. The effects of oil seeds in diets of lactating cows on milkproduction and methane emissions. J. Dairy Sci. 85: 1509-1515.Kandeepan, G., S. Biswas and R.S. Rajkumar. 2009. <strong>Buffalo</strong> as a potential foodanimal: Review. Inter. J. Livestock Prod. 1: 001-005.Kongmun, P., M. Wanapat, P. Pakdee and C. Navanukraw. 2010. Effect of coconutoil and garlic powder on in vitro fermentation using gas productiontechnique. Livest. Sci. 127: 38-44.Kumar, A., Tiwari, G.N., Kumar, S. and M. Pandey. 2006. Role of greenhousetechnology in agricultural engineering. Int. J. Agric. Res. 1: 364-372.Lazar, V. 2001. We like buffalo. Meat Proc. 40: 80-85.Leng, R.A. 2011. The impact of livestock dwvelopment on environmental changes.Fao Corporate Document Repository on “Strategies for sustainable animalagriculture in developing countries. FAO, Rome, Italy.Machmuller, A., D.A. Ossowski and M. Kreuzer. 2000. Comparative evaluation ofthe effects of coconut oil, oilseeds and crystalline fat on methane release,digestion and energy balance in lambs. Anim. Feed Sci. Technol. 85: 41-60.14
<strong>Buffalo</strong> <strong>Bulletin</strong> <strong>2013</strong> Vol.<strong>32</strong> (<strong>Special</strong> <strong>Issue</strong> 1): 1-21Martin, C., H. Dubroeucq, D. Micol, J. Agabriel and M. Doreau. 2007. Methaneoutput from beef cattle fed different high-concentrate diets. Proceedings ofthe British Society of Animal Science, April 2-4, Southport, UK, pp: 46-46.McGinn, S.M., K.A. Beauchemin, T. Coates and D. Colombatto. 2004. Methaneemissions from beef cattle: Effects of monensin, sunflower oil, enzymes,yeast and fumaric acid. J. Anim. Sci. 82: 3346-3356.Murthy, T.R.K. and I.P. Devadason. 2003. <strong>Buffalo</strong> meat and meat products–Anoverview. Proc. the 4 th Asian buffalo congress on buffalo for food, securityand employment. New Delhi. pp:193-199.Nardone, A., B. Ronchi, N. Lacetera, M.S. Ranieri and U. Bernabucci. 2010. Effectsof climate changes on animal production and sustainability of livestocksystems. Livest. Sci. 30: 57–69.Neath, K.E., A.N. Del Barrio, R.M. Lapitan, J.R. Herrera, L.C. Cruz, T. Fujihara, S.Muroya, K. Chikun, M. Hirabayashi and Y. Kanai. 2007. Difference intenderness and pH decline between water buffalo and beef during postmortem aging. Meat Science. 75: 499-505.Patra, A.K. and J. Saxena. 2009a. A review of the effect and mode of action ofsaponins on microbial population and fermentation in the rumen andruminant production. Nutr. Res. Rev. 22: 204-219.Patra, A.K. and J. Saxena. 2009b. Dietary phytochemicals as rumen modifiers: Areview of the effects on microbial populations. Antonie Van Leeuwenhoek,96: 363-375.Poungchompu, O., M. Wanapat, C. Wachirapakorn, S. Wanapat and A. Cherdthong.2009. Manipulation of ruminal fermentation and methane production bydietary saponins and tannins from mangosteen peel and soapberry fruit. Arch.Anim. Nutr. 63: 389-400.Puchala, R., B.R. Min, A.L. Goetsch and T. Sahlu. 2005. The effect of a condensedtannin-containing forage on methane emission by goats. J. Anim. Sci. 83:182-186.Ranjhan, S. K. 2004. Commercial production of buffalo meat with social agenda.Proc. 7 th World <strong>Buffalo</strong> Congress. Manila, Philippines. 1: 1-7.Rochfort, S., A.J. Parker and F.R. Dunshea. 2008. Plant bioactives for ruminalhealth and productivity. Phytochemistry 69: 299–<strong>32</strong>2.Rowlinson, P., M. Steele and A. Nefzaoui. 2008. Livestock and globao climatechange. Proceedings of the <strong>International</strong> Conference in Hammamet, May 17-20, Cambridge University Press pp 216-216.Sejian, V., J. Lakritz, T. Ezeji and R. Lal. 2011. Forage and flax seed impact onenteric methane emission in dairy cows. Res. J. Vet. Sci. 4: 1-8.Singh, C.V. and R.S. Barwal. 2010. <strong>Buffalo</strong> breeding research and improvementstrategies in India. Proc. World buffalo congr. Buenos Aires, April. pp. 1024-1031.Steinfeld, H., P. Gerber, T. Wassenaar, V. Castel, M. Rosales and C. de Haan. 2006.Livestock’s Long Shadow: Environmental <strong>Issue</strong>s and Options. Rome, Italy,Food and Agriculture Organization (FAO) pp 390.15
<strong>Buffalo</strong> <strong>Bulletin</strong> <strong>2013</strong> Vol.<strong>32</strong> (<strong>Special</strong> <strong>Issue</strong> 1): 1-21Tamminga, S., A. Bannink, J. Dijkstra and R. Zom. 2007. Feeding strategies toreduce methane loss in cattle. Report 34, Animal Science Group.http://edepot.wur.nl/28209.USDA. 1996. United States Department of Agriculture; Technical <strong>Bulletin</strong>, number8. USDA, New York.USEPA. 2006. Global Mitigation of Non-CO2 Greenhouse Gases. U.S.Environmental Protection Agency, Office of Atmospheric Programs (6207J),Washington, DC.Wallace, R.J. 2004. Antimicrobial properties of plant secondary metabolites. Proc.Nutr. Soc. 63: 621-629.Wallace, R.J., N.R. McEwan, F.M. McInotoch, B. Teferedegne and C.J. Newbold.2002. Natural products as manipulators of rumen fermentation. Asian-Aust.J. Anim. Sci. 10: 1458-1468.Wanapat, M. 1999. Feeding of ruminants in the tropics based on local feedresources. Khon Kaen, Public Company Limited., Khon Kaen, Thailand. pp236.Wanapat, M. 2000. Rumen manipulation to increase the efficient use of local feedresources and productivity of ruminants in the tropics. Asian-Aust. J. Anim.Sci. 13(Suppl.): 59-67.Wanapat, M. 2009. Potential uses of local feed resources for ruminants. J. Trop.Anim. Health. Prod. 41: 1035-1049.Wanapat, M. 2012. Contribution towards ruminant nutrition, animal scientists’development and international animal agriculture: Past, current and futureprospects. 1 st <strong>International</strong> Conference on Animal Nutrition and Environment(ANINUE, 2012). 14-15 September, 2012. Khon Kaen, Thailand. pp 7-21.Wanapat, M. and C. Devendra, 1992. Feeding and nutrition of dairy cattle in Asia.Proc. 6 th AAAP Anim. Sci. Congr. 2, The Animal Husbandry Association ofThailand. Bangkok, Thailand. pp 177-194.Wanapat, M. and V. Chanthakhoun. 2009. Recent advances in rumen ecology,digestion and feeding strategies of swamp buffaloes. Europe and America's<strong>Buffalo</strong> Symposium, Pedro Leopoldo, MG, Brazil. Anais/Proceedings BeloHorizonte: CBRA, 2009. CD-ROM. ISSN:2175-4012.Woodward, S.L., G.C. Waghorn and P. Laboyrie. 2004. Condensed tannins inbirdsfoot trefoil (Lotus corniculatus) reduced methane emissions from dairycows. Proc. N. Z. Soc. Anim. Prod. 64: 160-164.World Bank. 2009. Minding the stock: bringing public policy to bear on livestocksector development. Report no. 44010-GLB. Washington.World resources institute. 2000. World greenhouse gas emissions flow chart.http://www. wri.org/image/view/9529/_original.Yan, T., R.E. Agnew, F.J. Gordon and M.G. Porter. 2000. Prediction of methaneenergy output in dairy and beef cattle offered grass silage-based diets. Livest.Prod. Sci. 64: 253-263.Yurtseven, S. and I. Ozturk. 2009. Influence of two sources of cereals (corn orbarley), in free choice feeding on diet selection, milk production indices andgaseous products (CH 4 and CO 2 ) in lactating sheep. Asian J. Anim. Vet. Adv.4: 76-85.16
<strong>Buffalo</strong> <strong>Bulletin</strong> <strong>2013</strong> Vol.<strong>32</strong> (<strong>Special</strong> <strong>Issue</strong> 1): 1-21Table 1. Total buffalo population in the world and in Asia 1998-2008.Year World Asia South Asia East Asia South-East Asia1998 160,715,087 156,335,297 117,706,250 22,553,806 15,450,0892004 172,651,049 167,386,406 129,551,154 22,287,212 14,955,7662005 174,526,286 169,182,246 131,256,213 22,365,381 14,873,4792006 176,188,724 170,845,267 1<strong>32</strong>,418,951 22,498,838 15,059,<strong>32</strong>72007 177,376,972 171,863,188 133,382,123 22,720,762 15,191,4392008 180,702,923 174,208,357 135,187,037 23,271,909 15,197,7342008, % of World 100.00% 96.40% 74.81% 12.80% 8.40%Growth, % 1.24 1.14 1.48 0.31 -0.16Source: FAO (2010)Table 2. Certain nutritional components of buffalo and cow meat (100 g).17Contents <strong>Buffalo</strong> CowCalories, Kcal 131.00 289.00Protein, g 26.83 24.07Fat, g 1.80 20.69Fatty acidsSaturated 0.60 8.13Monosaturated 0.53 9.06Polysaturated 0.36 0.77Cholesterol, mg 61.00 90.00Minerals, mg 641.80 583.70Vitamins, mg 20.95 18.52Cholesterol, mg 61.00 90.00Minerals, mg 641.80 583.70Vitamins, mg 20.95 18.52Source: USDA (1996).
<strong>Buffalo</strong> <strong>Bulletin</strong> <strong>2013</strong> Vol.<strong>32</strong> (<strong>Special</strong> <strong>Issue</strong> 1): 1-21Table 3. Typical composition of buffalo milk and cow milk.Traits Cow <strong>Buffalo</strong>Total solids, % 13.10 16.30Fat, % 4.30 7.90Protein, % 3.60 4.20Lactose, % 4.80 5.00Tocopherol, mg/g 0.31 0.33Cholesterol, mg/g 3.14 0.65Calcium, mg/100 g 165.00 264.00Phosphorus, mg/100 g 213.00 268.00Magnesium, mg/100 g 23.00 30.00Potassium, mg/100 mg 185.00 107.00Sodium, mg/100 g 73.00 65.00Vitamin A (incl. Carotene) IU. 30.30 33.00Vitamin C, mg/100 g 1.90 6.70Source: Anonymous (1995)Table 4. Comparison of milk performance in different buffalo breeds (kg/day).BreedLactations(n)Lactationlength(days)Milk yield(kg)Averagemilkyield perday(kg)Highestdailymilk yield(kg)L 70 280.4±20.2 1092.8±207.4 3.79 6.6M 237 <strong>32</strong>4.7±73.9 21<strong>32</strong>.9±78.3 6.57 17.40N 164 316.8±83.6 2262±663.9 7.14 18.40MLF1 157 313.7±96.7 1240.5±479.8 3.95 7.57MLF2 118 313.9±90.1 1423.3±534.5 4.53 8.30NLF1 45 <strong>32</strong>6.7±96.4 2041.2±540.9 6.25 16.65NLF2 55 <strong>32</strong>1.4±118 2<strong>32</strong>5.6±994.4 7.22 19.35N.MLF2 168 317.6±78.4 2294.6±772.1 7.22 18.80N.MLG1 70 <strong>32</strong>9.1±89.8 1994.9±635.0 6.06 18,50L=local, M=Murrah, N=Nili-Ravi, G=Santa GertrudisSource: Borghese (2005) and Bingzhuang et al. (2003)18
<strong>Buffalo</strong> <strong>Bulletin</strong> <strong>2013</strong> Vol.<strong>32</strong> (<strong>Special</strong> <strong>Issue</strong> 1): 1-21Table 5. Global methane emissions by livestock production system.19LivestockEmissions (million tones CH 4 per year by source)production Dairy Other <strong>Buffalo</strong> Sheep Pigs Poultry Totalsystem cattle cattleand goatGlobal methane emission from manure managementGrazing 4.73 21.98 0.00 2.95 0.00 - 29.58Mixed 10.96 27.53 9.23 6.50 0.80 - 55.02Industrial 0.00 0.73 0.00 0.00 0.31 - 1.04Subtotal 15.69 50.16 9.23 9.44 1.11 - 85.63Global methane emission from manure managementGrazing 0.15 0.50 0.00 0.12 0.00 0.00 0.77Mixed 2.93 3.89 0.34 0.23 4.58 0.31 12.27Industrial 0.00 0.02 0.00 0.00 3.80 0.67 4.48Subtotal 3.08 4.41 0.34 0.35 8.38 0.97 17.52Total 18.77 54.57 9.57 9.79 9.49 0.97 103.15Source: Steinfeld et al. (2006)
<strong>Buffalo</strong> <strong>Bulletin</strong> <strong>2013</strong> Vol.<strong>32</strong> (<strong>Special</strong> <strong>Issue</strong> 1): 1-21Table 6. Methane abatement strategies, mechanism of abatement, and considerations for use.20Methane abatement strategy abatement strategyMechanism of abatement activity Considerations when selectingDietary compositionIncrease hemicellulose/starch Increased passage rate; greater proportionpropionate versus acetate; reduced ruminalpHDecrease cell wallcomponentsGrindingLipidsFatty acids Inhibition of methanogens and protozoa;OilsSeedsTallowDefaunationChemical Removes associatedgreater proportion propionate versus acetate;biohydrogenationShift methanogensis to hind gut or manure, risk ofsubacute ruminal acidosis (SARA)Effect on palatability, intake, performance, milkcomponents; varies by diet, ruminant species;long-term studies neededmethanogens; less Adaptation of microbiota may occur; varies withlocation differencesdigestibility; residues unknownFeed additiveshydrogen for methanogenesisdiet; maintenance of defaunated animalsMethanogens Vaccine Host immune response to methanogens Vaccine targets; diet and host geographicalMonensin Inhibits protozoa and gram-positive bacteria; lack of substrate for methanogenesis Adaptation of microbiota may occur; varies withdiet and animal; banned in the EUPlant CompoundsCondensed tannins Antimicrobial activity; reduced hydrogen Optimum dosage unknown; more in vivo researchavailabilityneeded; long-term studies needed; may affectSaponinsEssential oilsOrganic AcidsFumarate Hydrogen sink, greater proportionMalateSource: Hook et al. (2010)propionate versus acetateVaries with diet; more in vivo research needed;long-term studies needed; may affect digestibility
<strong>Buffalo</strong> <strong>Bulletin</strong> <strong>2013</strong> Vol.<strong>32</strong> (<strong>Special</strong> <strong>Issue</strong> 1): 1-21Industrial Processes3.4Waste3.6Fugitive Emission3.9Other fuel combustion9SectorIndustryTransportation10.413.5Agriculture13.5Land Use change18.2Electricity and heat24.60 5 10 15 20 25Figure 1. World greenhouse gas (carbon dioxide, methane, nitrous oxide and etc.).emissions. Source: Modified from World Resource Institute (2000)Figure 2. Rumen fermentation through Embden Myerhof Parnas pathway.Source: Wanapat (2012)21