Tree Phenology - Université Paris-Sud 11
Tree Phenology - Université Paris-Sud 11
Tree Phenology - Université Paris-Sud 11

Create successful ePaper yourself
Turn your PDF publications into a flip-book with our unique Google optimized e-Paper software.
Provided for non-commercial research and educational use only.Not for reproduction, distribution or commercial use.This chapter was originally published in the book Developments in EnvironmentalScience, Vol. 12, published by Elsevier, and the attached copy is provided by Elsevierfor the author's benefit and for the benefit of the author's institution, for noncommercialresearch and educational use including without limitation use ininstruction at your institution, sending it to specific colleagues who know you, andproviding a copy to your institution’s administrator.All other uses, reproduction and distribution, including without limitation commercialreprints, selling or licensing copies or access, or posting on open internet sites, yourpersonal or institution’s website or repository, are prohibited. For exceptions,permission may be sought for such use through Elsevier's permissions site at:http://www.elsevier.com/locate/permissionusematerialFrom: Urša Vilhar, Egbert Beuker, Toshie Mizunuma, Mitja Skudnik, FranoisLebourgeois, Kamel Soudani and Matthew Wilkinson, <strong>Tree</strong> <strong>Phenology</strong>.In Marco Ferretti and Richard Fischer, editors: Developments in EnvironmentalScience, Vol. 12, Amsterdam, The Netherlands, 2013, pp. 169-182.ISBN: 978-0-08-098222-9© Copyright 2013 Elsevier Ltd.Elsevier
Author's personal copyChapter 9<strong>Tree</strong> <strong>Phenology</strong>Urša Vilhar* ,1 , Egbert Beuker { , Toshie Mizunuma { , Mitja Skudnik*,François Lebourgeois } , Kamel Soudani } and Matthew Wilkinson ||* Slovenian Forestry Institute, Ljubljana, Slovenia{ Finnish Forest Research Institute Metla, Punkaharju, Finland{ School of GeoSciences, University of Edinburgh, Edinburgh, United Kingdom} Laboratoire d’Etude des Ressources Forêt Bois (LERFoB), Agro<strong>Paris</strong>Tech, ENGREF,UMR1092, Nancy, France} Laboratoire Ecologie, Systématique et Evolution, CNRS, University of <strong>Paris</strong> <strong>Sud</strong> <strong>11</strong>, Orsay,France|| Forest Research, Alice Holt Lodge, Farnham, Surrey, United Kingdom1 Corresponding author: e-mail: ursa.vilhar@gozdis.siChapter Outline9.1. Introduction 1699.2. Objectives 1709.3. Location of Measurementsand Observations 1709.4. Variables to be Assessed 1719.5. Measurements 1719.5.1. Manual PhenologicalObservations 1719.5.2. Observations UsingIndirect Techniques 1749.6. Quality Assurance 1779.7. Examples of NationalApplications 1779.7.1. Trends in theGrowing SeasonLength in Slovenia 1779.7.2. Needle Appearancein Finland 1779.7.3. Modeling ClimateChange Effects onFrench Plots 1789.8. Conclusions 179Acknowledgments 181References 1819.1 INTRODUCTION<strong>Phenology</strong> has been defined as the study of cyclical biological events. Inplants, this can include flowering, leaf unfolding (or budburst), seed set anddispersal, and leaf fall in relation to climatic conditions (Davi et al., 20<strong>11</strong>).Plant phenology has been proposed as an indicator of climatic differenceDevelopments in Environmental Science, Vol. 12. http://dx.doi.org/10.1016/B978-0-08-098222-9.00009-1© 2013 Elsevier Ltd. All rights reserved. 169
Author's personal copy170SECTION III Monitoring Methods for Above-Ground Vegetationand global change by the European Environmental Agency and the IntergovernmentalPanel on Climate Change (IPCC, 2007). Long-term phenologicalrecords in trees, including spring events such as leaf unfolding and autumnalevents of leaf coloring, have shown that a rise in global temperature generallyleads to earlier timing of spring events (Chen and Xu, 2012; Doi and Katano,2008; Menzel et al., 2006). Leaf phenology being a major determinant of waterand CO 2 fluxes, recent studies have clearly shown that growing season lengthcontrols net ecosystem primary productivity and that phenological shifts havealready modified the annual carbon (C) cycle of terrestrial ecosystems (Daviet al., 2006). This chapter describes methodologies for harmonized phenologicalassessments as adopted by the International Co-operative Programme onMonitoring and Assessment of Air Pollution Effects on Forests (ICP Forests)and provides examples of results obtained in four European countries.9.2 OBJECTIVESOne of the important purposes of phenological observations is to improveunderstanding of the relationships between meteorological variables and associatedbiological responses. Understanding these relationships is crucial, notonly for predicting ecosystem responses to climate change but also in identifyingthe C-uptake period (of forest stands) and for examining the seasonalexchanges of water and energy between the land surface and the atmosphere(Chen and Xu, 2012). The main objectives of phenological observations atforest intensive monitoring plots are:1. to provide information on the status and development of forest trees overthe course of the year;2. to determine the course of the annual development stages of forest treesand their dependence on local (e.g., meteorological and site) conditionsincluding damaging events;3. to document and explain possible changes in the timing of these stages inrelation to environmental factors of natural and/or anthropogenic originsuch as air pollution and climate change.9.3 LOCATION OF MEASUREMENTS AND OBSERVATIONSWithin the ICP Forests, phenological observations are usually made within theplot and/or in a buffer zone (see Chapter 6). All species within a monitoring plotare of interest, though priority is usually given to the dominant species.Phenological observations can be carried out on plot level or may focus onsingle trees within the plot, depending on the objectives. Phenological observationsat the plot level are performed as a cursory examination of the forestcrowns of several trees on the plot, preferably on more locations per plot.Phenological observations at the individual tree level are carried out on aselected number of trees. Within the ICP Forests, at least 10 trees of the majorspecies per plot are selected. These trees should be dominant or codominant.
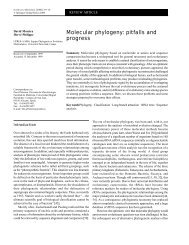
Author's personal copyChapter 9 <strong>Tree</strong> <strong>Phenology</strong> 171Good visibility of the upper part of the crown is a prerequisite. The use ofbinoculars is recommended. In case the upper crowns are not visible, assessmentson the middle part of the crown are also acceptable. The same part ofthe crown is considered for subsequent phenological observations throughoutthe year, as well as in following years. Preference is given to those trees onwhich crown and growth condition assessments are also carried out (seeChapters 8 and 10). When an insufficient number of crown condition treesare available, additional trees from within the plot or buffer zone are selected.<strong>Tree</strong>s used for leaf or needle sampling are not included (see Chapter 12).<strong>Tree</strong>s used for phenological assessments are either permanently marked inthe field or must be clearly identified, for example, by their coordinates.9.4 VARIABLES TO BE ASSESSEDAll phenological phases and records are of interest for phenological monitoring.However, from a practical point of view (e.g., financial input, ease andreliability of the monitoring, Europe-wide comparability, compatibility withother surveys such as crown condition assessments) it is necessary to concentrateon a limited set of phases: occurrence of flushing, flowering, Lammasshoots (or secondary flushing), color change, and leaf/needle fall. Distinctionsare made between conifers and broad-leaved species (Table 9.1). Also, biotic(pests and/or diseases) and abiotic damage (e.g., frost, wind, hail) relevant tophenological development of trees are considered.The application of a classification system can help making the assessmentscomparable between different teams operating in different countries. Fiveclasses have proven to be operational within the European forest monitoringsystem. Within the observed tree crowns on plot level or on single trees, theproportion of needles or leaves at each phenological phase is recorded usingthe following classes:1. Not observed (33–66% of the observed part of the crown);4. Abundant or severe (>66–99% of the observed part of the crown);5. Whole (100% of the observed part of the crown).A photoguide with phenological stages for various tree species is available(http://www.metla.fi/eu/icp/phenology). Figure 9.1 gives an example for needleappearance in conifers and leaf unfolding in broadleaves.9.5 MEASUREMENTS9.5.1 Manual Phenological ObservationsThe recording concentrates on obvious events based on a brief examination in theforest stands. Assessments are carried out during the individual phases of phenologicalphenomena. The assessment is repeated until the phase is complete.
Author's personal copy172SECTION III Monitoring Methods for Above-Ground VegetationTABLE 9.1 Phenological PhasesConifersNeedle appearanceStarts when the fresh green needlesbecome visible from the buds.Lammas shootsStarts when flushing of needles occurslater and clearly distinct from springflushing.FloweringStarts with beginning of opening ofthe male flowers (characterized bypollen shed).Autumn coloring (just for some species,e.g., Larix decidua Mill.)Starts when the color of the needles start tochange from green into yellow, red,orange, or brown during late summer andautumn.Leaf fall (just for some species, e.g., Larixdecidua Mill.)Starts when the needles drop from the tree.Broad-leaved speciesLeaf unfoldingStarts when the fresh green leavesbecome visible from the buds.Secondary flushingStarts when flushing of leaves occurslater and clearly distinct from springflushing.FloweringStarts with beginning of opening of themale flowers.Autumn coloring (except someevergreen species, e.g., Quercus ilex L.)Starts when the color of the leaves start tochange from green into yellow, red,orange, or brown during late summerand autumn.Leaf fallStarts when the leaves drop from the tree.
Author's personal copyChapter 9 <strong>Tree</strong> <strong>Phenology</strong> 173FIGURE 9.1 Needle appearance: (A) Pinus sylvestris (L.) and (B) Picea abies (L.) Karst. Leafunfolding: (C) Fagus sylvatica (L.) and (D) Quercus sp. (Photos by Urša Vilhar).
Author's personal copy174SECTION III Monitoring Methods for Above-Ground VegetationPhenological observations at the plot level can be carried out by technicalstaff. They are not cost intensive as they may be conducted in parallel with thecollection of samples taken at the plots in regular time intervals. A frequencyof at least once every two weeks during the growing period is recommended.Phenological observations at the individual tree level are carried out at leastonce a week during the critical phases, but daily observations are the optimum.9.5.2 Observations Using Indirect Techniques9.5.2.1 Terrestrial Digital Image PhotographyAs the relative costs of digital cameras have decreased and image quality hasincreased, the use of digital cameras for forest phenology monitoring has beenadopted rapidly. The advantages of remote digital camera systems over traditionalmanual observations are numerous: first, there is a reduced need for anobserver to make regular site visits, which can often be costly and time consuming,especially in remote forest areas. Second, the high frequency withwhich camera-based systems can capture canopy images, for example, dailyor even hourly makes the accurate observation of key phenological eventsmore likely. Third, by using the digital values of red, green, and blue takenfrom the image file, the time course of vegetation indices can be quantitativelyanalyzed (Richardson et al., 2007).Several different types of digital camera systems have been used across arange of sites to record high frequency phenological images. A test using <strong>11</strong> differentcameras at a deciduous forest in North America showed that the choice ofcamera and image format did not make large differences in phenological recording(Sonnentag et al., 2012). Digital camera systems can be used to provide apermanent photographic record suitable for manual inspection. These photoscan be compared with images or descriptions of standard phenological stages(Table 9.1), an approach which potentially removes the biases associated withfield-based assessments reliant on multiple observers. Using color strength,optical vegetation indices can be determined (e.g., Richardson et al., 2007).The time courses of these vegetation indices are useful in detecting key phenologicalevents, and where photos from several years are available, these can beused to quantify the interannual variation (Figures 9.2 and 9.3). In this example,differences in the timing of the green-up pattern over 3 years at an oak forest inthe south east of England are evident, with the earliest spring occurring in 20<strong>11</strong>;damage to the canopy caused by a late air frost in 2010 can also be seen. Despitevariations that may occur due to changes in light conditions, camera-based techniquescan provide useful information about the timing of key phenologicalevents such as budbursts or leaf fall.9.5.2.2 Applying the Normalized Difference Vegetation IndexFor many years, spectral vegetation indices (SVI) that combine visible andnear infrared light reflected by vegetation, such as the normalized difference
Author's personal copyChapter 9 <strong>Tree</strong> <strong>Phenology</strong> 1750.52009 2010 20<strong>11</strong>Relative green (ratio)0.40.30 60 120180 240 300 360Day of yearFIGURE 9.2 Relative proportion of green in digital images of an oak forest canopy taken at theAlice Holt Research Forest in the South of England. The dotted line shows the difference in canopystate on day 124 (4th of May) in each year.FIGURE 9.3 Photographs of an oak forest canopy at the Alice Holt Research Forest in the Southof England, the images were taken on day 124 (4th of May) in 2009, 2010, and 20<strong>11</strong>. The mainphotos were taken using a NetCam SC 5 MP, inset photos were taken using an automaticcapturingdigital fisheye camera (ADFC) system, part of the Phenological Eyes Network (http://pen.agbi.tsukuba.ac.jp/index_e.html).vegetation index (NDVI), have been used to quantify the phenology of differentecosystems from ground- (Soudani et al., 2012) and satellite-based measurements(Soudani et al., 2008). NDVI is determined from red and nearinfrared radiances measured above the canopy and is commonly used inremote sensing studies because it is sufficiently sensitive to capture smallchanges in the amount of vegetation greenness. In the framework of theFrench network of long-term measurements of carbon, water, and nutrientsfluxes, many forest sites have been equipped with laboratory-made NDVI sensorsto monitor the temporal dynamics of canopy structure and phenologywith daily resolution (Soudani et al., 2012). This approach has been appliedto other herbaceous and forest ecosystems across the world. Results show thatNDVI time series provide effective estimates of photosynthetic biomass andconstitute accurate estimates of dates of main phenological events such as
Author's personal copy178SECTION III Monitoring Methods for Above-Ground VegetationFIGURE 9.5 Trend analysis for the length of the growing season for European beech (Fagussylvatica L.) on five intensive forest monitoring plots in Slovenia. Box–Whisker plots for meanvalues and standard deviation for 20 trees per plot are shown. Source: Vilhar et al. (2012).and Scots pine intensive monitoring plots. Although the longest series ofobservations for a Norway spruce plot in Punkaharju are more than 10 years,for neither of the two species a significant change in the timing of needleappearance could be found (Figure 9.6).9.7.3 Modeling Climate Change Effects on French PlotsAfter modeling the large-scale climate response patterns of leaf unfolding,leaf coloring, and growing season length of evergreen and deciduous Frenchtemperate trees using a nonparametric procedure, the effects of eight futureclimate scenarios on phenological events were predicted (Lebourgeois et al.,2010). The modeling procedure known as “Random Forests” is a combinationof tree predictors such that each tree depends on the values of a random vectorsampled independently and with the same distribution for all trees in the forest
Author's personal copyChapter 9 <strong>Tree</strong> <strong>Phenology</strong> 179FIGURE 9.6 Beginning of growing season expressed as mean starting dates of needle appearancein Norway spruce and Scots pine at two intensive monitoring plots at Punkaharju, Finland.Box–Whisker plots for mean values and standard deviation for 10 trees per plot are shown.(Breiman, 2001). The ground observations from 103 temperate forest intensivemonitoring plots (10 species and 3708 trees) from the French intensive forestmonitoring network “RENECOFOR” were used for the period 1997–2006.“Random Forests” models were applied to predict phenological events fromclimatic and ecological variables. Based on the model results, maps of phenologicalevents throughout France were drawn assuming present climate and alsotwo different climate change scenarios of the Intergovernmental Panel on ClimateChange (A2, B2) and four global circulation models (HadCM3, CGCM2,CSIRO2, and PCM). Current observations and predicted values for the periods2041–2070 and 2071–2100 were compared (Figure 9.7). At the end of thetwenty-first century, each model predicts earlier budburst (mean: 7 days) andlater leaf coloring (mean: 13 days) leading to an average increase in the growingseason of about 20 days (for oaks and beech stands). The A2-HadCM3 hypothesisleads to an increase of up to 30 days in many areas. As a consequence ofhigher predicted warming during autumn than during winter or spring, shiftsin leaf coloring dates appear greater than trends in leaf unfolding.9.8 CONCLUSIONSPhenological observations are crucial for assessing cyclical biological events.Phenological observations on trees of forest monitoring plots provide informationon the status and development of trees during the year that can be relatedto other (environmental) assessments made at the same plots or even the sametrees. In order to assess changes in the timing of phenological events longtermobservations are needed. Digital cameras can be used to provide a
Author's personal copy180SECTION III Monitoring Methods for Above-Ground VegetationFIGURE 9.7 Predicted variations (in days) at the end of the twenty-first century in spring leafunfolding (LU), autumn leaf coloring (LC), and length of the growing season (LGS). Each mapcorresponds to the difference between the average values from the period 1991 to 2000 and theaverage predicted values with the climatic scenario A2-HadCM3 for the period 2071–2100. ForLU, negative values correspond to more precocious dates of bud burst. For LC and LGS, positivevalues correspond, respectively, to a delay of autumn leaf coloring and a lengthening of the growingseason. From: Lebourgeois et al. (2010).
Author's personal copyChapter 9 <strong>Tree</strong> <strong>Phenology</strong> 181permanent photographic record at plot level suitable for manual inspection—anapproach which potentially removes the biases associated with field-based assessmentsreliant on multiple observers. By using the digital information containedwithin photos, it has now become possible—with some precautions—to quantifythe phenology of trees and forests with a much higher temporal (e.g., daily) andspatial resolution, even enabling monitoring at the individual tree level. Vegetationindices, such as the NDVI have been used for many years to quantify the phenologyof different ecosystems. Ground-based NDVI time series describe thetemporal changes of canopy structure at very high frequency and constitute adirect and an effective way to extract the dates of main phenological events in bothdeciduous and evergreen forests. On the contrary, the use of satellite data encountersserious difficulties especially due to the presence of clouds. Spatial resolutionat which these data are available is often not sufficiently high for site-specificforest monitoring.All indirect methods using optical vegetation indices from digital cameraor NDVI sensors need to be validated against ground observations, for whichtree phenological observations from the forest monitoring plots are often used.A number of national results are presented pointing to effects of climatechange on phonological phases in Slovenia and France, but on conifer ICPForests Level II plots in Finland no significant changes were found so far.Work is ongoing to apply similar evaluations to the Europe-wide data sets.ACKNOWLEDGMENTSData collection for derivation of national results presented was partly cofinanced under theLifeþ project LIFE07 ENV/D/000218 FUTMON “Further development and implementationof an EU-level forest monitoring system.”REFERENCESBeuker, E., Raspe, S., Bastrup-Birk, A., Preuhsler, T., 2010. Phenological observations. ManualPart VI. United Nations Economic Commission for Europe Convention on Long-range TransboundaryAir Pollution. ICP Forests, Hamburg.Breiman, L., 2001. Random forests. Machine Learn. 45, 5–32.Chen, X., Xu, L., 2012. Temperature controls on the spatial pattern of tree phenology in China’stemperate zone. Agr. Forest. Meteorol. 154–155, 195–202.Davi, H., Dufrêne, E., Francois, C., et al., 2006. Sensitivity of water and carbon fluxes to climatechanges from 1960 to 2100 in European forest ecosystems. Agr. Forest. Meteorol. 141, 35–56.Davi, H., Gillmann, M., Ibanez, T., et al., 20<strong>11</strong>. Diversity of leaf unfolding dynamics among treespecies: new insights from a study along an altitudinal gradient. Agr. Forest. Meteorol. 151,1504–1513.Doi, H., Katano, I., 2008. Phenological timings of leaf budburst with climate change in Japan.Agr. Forest. Meteorol. 148, 512–516.
Author's personal copy182SECTION III Monitoring Methods for Above-Ground VegetationIPCC, 2007. Contribution of working group I to the fourth assessment report of the intergovernmentalpanel on climate change. In: Solomon, S.D., Qin, M.M., Chen, Z.M., Marquis, K.B.,Averyt, M.T., Miller, H.L. (Eds.), 2007. Climate Change 2007: The Physical Science Basis.Cambridge University Press, Cambridge, UK, p. 996.Lebourgeois, F., Pierrat, J.-C., Perez, V., et al., 2010. Simulating phenological shifts in Frenchtemperate forests under two climatic change scenarios and four driving global circulationmodels. Int. J. Biometeorol. 54, 563–581.Menzel, A., Sparks, T.H., Estrella, N., et al., 2006. European phenological response to climatechange matches the warming pattern. Glob. Chang. Biol. 12, 1969–1976.Richardson, A.D., Jenkins, J.P., Braswell, B.H., et al., 2007. Use of a digital webcam to trackspring green-up in a deciduous forest. Oecologia 152, 323–334.Sonnentag, O., Hufkens, K., Teshera-Sterne, C., et al., 2012. Digital repeat photography for phenologicalresearch in forest ecosystems. Agr. Forest. Meteorol. 152, 159–177.Soudani, K., Le Maire, G., Dufrêne, E., et al., 2008. Evaluation of the onset of green-up in temperatedeciduous broadleaf forests derived from Moderate Resolution Imaging Spectroradiometer(MODIS) data. Remote Sens. Environ. <strong>11</strong>2, 2643–2655.Soudani, K., Hmimina, G., Delpierre, N., et al., 2012. Ground-based Network of NDVI measurementsfor tracking temporal dynamics of canopy structure and vegetation phenology in differentbiomes. Remote Sens. Environ. 123, 234–245.Vilhar, U., Skudnik, M., Simončič, P., 2012. Fenološke faze dreves na ploskvah Intenzivnegamonitoringa gozdov v Sloveniji. [Phenological phases of trees on the Intensive monitoringplots in Slovenia]. Zbornik gozdarstva in lesarstva. ZbGL. 98, 20–48.