6. OBSERVATIONS, RESULTS AND DISCUSSION
6. OBSERVATIONS, RESULTS AND DISCUSSION
6. OBSERVATIONS, RESULTS AND DISCUSSION

You also want an ePaper? Increase the reach of your titles
YUMPU automatically turns print PDFs into web optimized ePapers that Google loves.
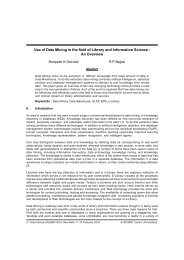
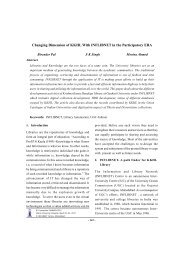
<strong>6.</strong> OBSERVATION, <strong>RESULTS</strong> & <strong>DISCUSSION</strong> 106CoEnPrPhPXFigure 3.2: Transverse section of stem of Sarcostemma acidumCo=Cortex, En = Endodermis, Pr = Pericycle, Ph = Phloem, X = Xylem, P = Pith
<strong>6.</strong> OBSERVATION, <strong>RESULTS</strong> & <strong>DISCUSSION</strong> 107<strong>6.</strong>1.2.2 Powder MicroscopyThe powder is a puff white to light yellowish in color with faint odor and slightly bittertaste having following features:1. Parenchymatous cells are oval shaped, thin walled, isodiametric and are present incluster and are present in groups in union with epidermal cells.2. A cortex cell consists of round shaped parenchyma.3. The abundant starch grains which are composed with two, three or morecomponents, individual granules are polyhedral and fairly small. A hilum isvisible in some of the granules.4. Many multicellular trichomes are visible. They are numerous in number, 3-4celled.5. The fibrous cells which are generally found in groups vary in shape but areusually narrow and elongated with blunt end.<strong>6.</strong> Tracheids are also visible in cluster, 2-3 celled and compact in nature.<strong>6.</strong>1.3 Physico-Chemical AnalysisThe dried parts of S. acidum were subjected to standard procedure for the determinationof various physicochemical parameters- ash values (total ash, acid insoluble ash andwater soluble ash) were determined, Swelling index, Moisture content (M.C.), Foreignorganic matter (F.O.M.) was determined.(Table.3.3)<strong>6.</strong>2 EXTRACTIONThe dried powder of plant was extracted with various solvents i.e., water, ethanolic,chloroform, petroleum ether and ethyl acetate. The solvents were removed by distillationunder reduced pressure and the resulting semisolid mass was vacuum dried using rotaryflash evaporator to obtain the extract. The percentage yields of various extract waspresented in Table 3.4.<strong>6.</strong>2.1 Phytochemical ScreeningThe various extracts obtained were subjected to preliminary phytochemical screening.The extraction was carried out with water, ethanol, chloroform, ethyl acetate andpetroleum ether the extract were screened for the presence of various medicinally activeconstituents. Aqueous extract shows presence of alkaloids, carbohydrates, glycosides,
<strong>6.</strong> OBSERVATION, <strong>RESULTS</strong> & <strong>DISCUSSION</strong> 108tannins, protein, amino acids, steroids. Ethanolic extract shows presence of alkaloids,carbohydrates, glycosides, tannins, protein, amino acids, steroids. Chloroform extractshows presence of carbohydrates, tannins while petroleum ether extract shows presenceof alkaloids, carbohydrates, glycosides, protein and amino acids, steroids.Parameters(% w/w)Table 3.3: Physico-chemical analysis of S. acidumResultsR1 R2 R3 X X+SD X+SEMTotal ash (TA) 7.0532 7.1958 7.0972 7.1154 7.11+0.05 7.11+0.03Water soluble ash (WSA) 4.9674 4.8260 4.9062 4.8998 4.89+0.05 4.89+0.03Acid insoluble ash (AIA) 1.8856 1.8074 1.7988 1.8306 1.83+0.00 1.83+0.00Moisture content (MC) <strong>6.</strong>0 5.79 5.90 5.89666 5.896+0.07 5.89+0.04Swelling index (SI) 0.21 0.17 0.23 0.203333 0.20+0.02 0.20+0.01Foreign organic matters(FOM)0.90 0.87 0.89 0.88666 0.88+0.10 0.88+0.06Abbr.: R1=Reading 1, R2=Reading 2, R3=Reading 3, X=Mean, SD=Standard Deviation,SEM=Standard Mean ErrorTable 3.4: Extractive value of different extract of S. acidumS/No. Type of Extract % Yield (w/w) Color of Extract1. Aqueous extract 2.0947 Light Green2. Ethanolic extract 12.7123 Dark Green3. Chloroflam extract 10.6321 Light Green4. Pet. Ether extract 9.7915 Brownish Green5. Ethyl acetate extract 14.6511 Dark Green
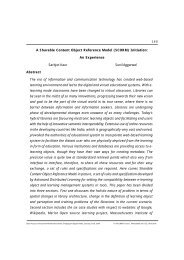
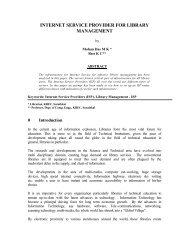
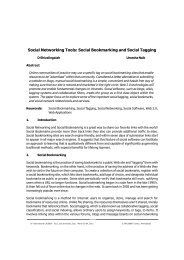
<strong>6.</strong> OBSERVATION, <strong>RESULTS</strong> & <strong>DISCUSSION</strong> 109Since, the major active constituents are present in ethanolic extract and ethyl acetateextract therefore; the ethanolic and ethyl acetate extract was taken for furtherinvestigation. The results are shown in Table 3.5.<strong>6.</strong>3 PHARMACOLOGICAL SCREENINGIn-vitro Anti-inflammatory activity of Extracts of S. acidumDuring inflammation, lysosomal hydrolytic enzymes are released into the sites whichcause damages of the surrounding organelles and tissues with attendance of variety ofdisorders (Sadique et al., 1989). Various methods were employed to screen and studydrugs, chemicals, herbal preparations that exhibit anti-inflammatory properties orpotentials. These techniques include uncoupling of oxidative phosphorylation (ATPbiogenesis linked to respiration), inhibition of denaturation of protein, erythrocytemembrane stabilization, lysosomal membrane stabilization, fibrinolytic assays andplatelet aggregation (Kalyanpur et al., 1968; Lee and Thong, 1970; Swingle, 1974;Kumar and Sadique, 1987; Pal and Chaudhuri, 1992; Oyedapo et al., 1999). In thepresent study, stabilization of erythrocyte membranes exposed to both heat and hypotonicinduced lyses was employed due to its simplicity and reproducibility. The ethanolic andethyl acetate extract of the stem of Sarcostemma acidum were studied for in vitro antiinflammatoryactivity by HRBC membrane stabilization method. Four differentconcentration of extract 1mg/ml, 2 mg/ml, 4 mg/ml and 6 mg/ml were used. Amongwhich EE extract at concentration 6 mg/ml showed 51.4 % protection of HRBC inhypotonic solution and EAE extract at concentration 6 mg/ml showed 68 % protection ofHRBC in hypotonic solution. All the results were compared with standard indomethacinwhich showed 69.6 % protection at concentration 2.5 mg/ml (Table 3.6 & 3.7, Fig.3.3).The activity may be due to the presence of one or more phytochemical constituentspresent in the extract. The result obtained have been supported by Photomicrographicalpictures of the HRBC (Fig.3.4).The study also provides a strong evidence for the use of the leaves S. acidum in folklorictreatment as anti-inflammatory agent. The plant therefore could be regarded as a naturalsource of membrane stabilizers and was capable of providing an alternative remedy forthe management and treatment of inflammatory related disorders and diseases.
<strong>6.</strong> OBSERVATION, <strong>RESULTS</strong> & <strong>DISCUSSION</strong> 110Table 3.5: Preliminary phytochemical screening of different extract of SarcostigmmaacidumS/No. Constituents Test AE EE CE PE EA1. Alkaloids Mayer’s test - + - - -Dragendroff’ test + + - + +Hager’s test - - - + -Wagner’s test - - - - -2. Carbohydrates Molisch’s test + + + + +Fehling’s test + + - - +3. Glycosides Brontrager’s test - + - - -Legal’s test + + - + +4. Fixed oil and fats Spot test - - - - -Soap formation test - - - - -5. Tannins FeCl 3 - + - - -<strong>6.</strong> Protein and aminoacidVanillin hydrochloride + + + - +Alkaline reagent - + - - -Million’s test + + - + +Ninhydrin test + - - +Biuret test - - - + -7. Flavanoids With NaOH - - - - -8. Steroids andtriterpenoidsShinoda test - - - - -With H 2 SO 4 - - - - -Libermann’s- - - - -Burchard testSalkowski’s test + + - + +9. Mucilage and gum With 90% alcohol - - - - -10. Waxes With alc. KOH - - - - -AE: Aqueous Extract; EE: Ethanolic Extract; CE: Chloroform Extract; PE: Petroleum etherExtract, EA: Ethyl acetate Extract (+ Present, - Absent)
% Inhibition of Hemolysis<strong>6.</strong> OBSERVATION, <strong>RESULTS</strong> & <strong>DISCUSSION</strong> 111Figure 3.3: In-vitro Anti-inflammatory activity of Extracts of S. acidumIn -vitro Antiinflammetory Anti-inflammatory action activity of S. acidum of S. acidum807060504030201000 2 4 6 8Con. mg/mlEthyl acetateextractEthanolicextractTable 3.6: In-Vitro anti-inflammatory activity of Ethanolic extract of S. acidum bymembrane stabilization methodTreatment Con(mg/ml) Absorbance(560nm) % of InhibitionControl - 0.250±0.29 -Ethanolic extract 1.002.004.00<strong>6.</strong>000.208±0.25 a19.80.182±0.22 a31.20.147±0.28 b43.20.123 ±0.42 c 51.4Indomethacin (Standard drug) 2.50 0.070±0.18 b 69.6Values are expressed as X (Mean) +SEM, n=3. (One way ANOVA followed by Student t-test). Statistically significance of a P < 0.05, b P
<strong>6.</strong> OBSERVATION, <strong>RESULTS</strong> & <strong>DISCUSSION</strong> 112Table 3.7: In-Vitro anti-inflammatory activity of Ethyl acetate extract of S. acidumby membrane stabilization methodTreatment Con(mg/ml) Absorbance(560nm) % of InhibitionControl - 0.250±0.29 -Ethyl acetate extract 1.002.004.00<strong>6.</strong>000.175±0.12 a30.00.143±0.23 a42.80.115±0.44 c54.00.081±0.39 b 67.6Indomethacin (Standard drug) 2.50 0.070±0.18 b 69.6Values are expressed as X (Mean) +SEM, n=3. (One way ANOVA followed by Student t-test). Statistically significance of a P < 0.05, b P
<strong>6.</strong> OBSERVATION, <strong>RESULTS</strong> & <strong>DISCUSSION</strong> 113HRBC in Isotonic Solution ControlHRBC in Hypertonic Solution(Lysis of Hypertonic induced HRBC membrane)RBC in Hypertonic solution with Plant extract (6mg/ml)(Protection of Hypertonic induced HRBC membrane lysis)Figure 3.4: HRBC Membrane in isotonic and hypertonic solution
<strong>6.</strong> OBSERVATION, <strong>RESULTS</strong> & <strong>DISCUSSION</strong> 114<strong>6.</strong>4 FORMULATION CHARACTERIZATION <strong>AND</strong> EVALUATION OF…..SUITABLE TOPICAL THERAPEUTIC SYSTEM<strong>6.</strong>4.1 Evaluation of Gel Formulation:During the trial, the excipients concentrations of carbapol and Sodium CMC weregradually increased and then decreased as several problems like homogeneity,spreadibility and viscosity were encountered. These problems occurred in some of thebatches (F1, F2, F6 and F7) of polymer based gel containing S. acidum. Hence, thesebatches were discarded and remaining batches (F3, F4 and F5) were considered forfurther study.The result showed that the developed herbal gel was greenish in color, translucent inappearance and showed good homogeneity with absence of lumps. Formulation F5 hadgood values of spreadability, viscosity, pH, drug content and during the acceleratedstability studies the appearance was clear and no significant variation in spreadability, pHand drug content was observed. Hence Hydroalcohalic and Ethosomal gel was formulatedfrom hydrogel F5 formulation and its physiochemical study was found to be good.(Fig.3.6, 3.7 & Table.3.8)Batch Color AppearanceTable 3.8: Physical evaluation of all formulationsSpreadibility(gm.cm/sec)Consistency(60 mm)Viscosity(cps)PhDrugcontent(%)F3 Greenish Homogeneous 19.75 5 22410 7.00 99.81F4 Greenish Homogeneous 21.65 7 19380 7.00 99.75F5 Greenish Homogeneous 21.38 6 24180 7.00 99.95F EAE Greenish Homogeneous 21.45 6 22393 7.00 99.97FA Greenish Homogeneous 23.96 8 17053 7.00 99.80FA EAE Greenish Homogeneous 24.08 8 17862 7.00 99.92FE Greenish Homogeneous 24.21 8 16915 7.00 99.94FE EAE Greenish Homogeneous 24.42 8 16995 7.00 99.95
<strong>6.</strong> OBSERVATION, <strong>RESULTS</strong> & <strong>DISCUSSION</strong> 115Hydrogel formulation F-5Hydrogel formulation F EAEFigure 3.6: Microscopic photograph’s of Hydrogel Formulation containing S.acidum plant extract
<strong>6.</strong> OBSERVATION, <strong>RESULTS</strong> & <strong>DISCUSSION</strong> 116Ethosomal gel formulation FEEthosomal gel formulation FE EAEFigure 3.7: Microscopic photograph’s of Ethosomal Gel Formulationcontaining S. acidum plant extract
<strong>6.</strong> OBSERVATION, <strong>RESULTS</strong> & <strong>DISCUSSION</strong> 117Figure 3.8 : FTIR spectra of S. acidum extracts (ethyl acetate + ehanolic extract)
Figure 3.10 : FTIR spectra of Hydrogel base + S. acidum Extracts<strong>6.</strong> OBSERVATION, <strong>RESULTS</strong> & <strong>DISCUSSION</strong> 119Figure FTIR spectra of Gel base
<strong>6.</strong> OBSERVATION, <strong>RESULTS</strong> & <strong>DISCUSSION</strong> 120Figure 3.11 : FTIR spectra of Ethosomal gel base
Figure 3.12 : FTIR spectra of Ethosomal gel base + S. acidum Extracts<strong>6.</strong> OBSERVATION, <strong>RESULTS</strong> & <strong>DISCUSSION</strong> 121Figure FTIR spectra of Ethosomal gel base
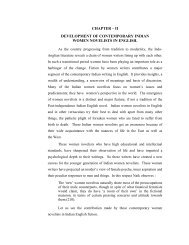
<strong>6.</strong> OBSERVATION, <strong>RESULTS</strong> & <strong>DISCUSSION</strong> 122Compatibility studiesFourier transformed infrared (FTIR) spectra technique have been used here to study thephysical and chemical interaction between extracts and excipients used in formulation.From the figure 3.8-3.12 ,it has been observed that there is no changes in these mainpeaks in IR spectra of mixture of S.acidum extract, Soya Phaphodilcholine and polymersused in formulation which shown there were no physical and chemical interaction. Thepeaks obtained in the spectra’s of formulation correlated with the peaks of S. acidumextract. This indicates that the extract was compatible with the formulation.<strong>6.</strong>4.2 Evaluation of Ethosome suspensionImage analysis of ethosomes by optical microscopeFor the initial vesicle characterization of ethosome suspension were examined bycompound microscope. The result revealed that formulation without added SLS andTween 80 shown aggregation process among the structure (Fig.3.14). Formulation inwhich SLS and Tween 80 added shown spherical shaped vesicles like structure withoutaggregation process.(Fig.3.13, a & b) Hence, Formulation containing SLS and Tween 80in ehanolic extract (FE3, FE4,FE7,FE8) and ethyl acetate extract (FE3 EAE , FE4 EAE ,FE7 EAE,FE8 EAE ) were considered for further study and remaining formulation batcheswere discarded.Vesicular shape and surface morphology by TEMThe vesicular shape and surface morphology of ethosomes of formulation FE8 EAEexamined by Transmission Electron Microscope (TEM). The TEM image showed thatethosomes were spherical shaped. (fig.3.15)Determination of Entrapment efficiency of ethosomes suspension:The entrapment efficiency of various ethosomes formulations are presented in Table.3.9.The entrapment efficiency of formulation containing ethanolic extract FE8 was found tobe highest (75.91%) while FE3 formulation showed least entrapment efficiency (6<strong>6.</strong>66%). The entrapment efficiency of formulation containing EAE was observed to be highestfor FE8, EAE formulation (74.54%) and least for FE3, EAE (58.87%). The EE of formulationcontaining EAE and EE were comparable. However it has been observed the formulationcontaining phospholipid (3 gm) with ethanol has maximum entrapment efficiency.
<strong>6.</strong> OBSERVATION, <strong>RESULTS</strong> & <strong>DISCUSSION</strong> 123(a) Ethosome suspension FE8(b) Ethosome suspension FE8, EAEFigure 3.13: Microphotographs of Ethosome suspensions containingS. acidum plant extract
<strong>6.</strong> OBSERVATION, <strong>RESULTS</strong> & <strong>DISCUSSION</strong> 124Ethosome suspension, FE6, EAEFigure 3.14: Microphotographs of Ethosome suspensions containing S.acidum plant extract (without added SLS and Tween 80)Figure 3.15: Transmission electron microphotograph Visualization of ethosomes bytransmission electron microscopy.
<strong>6.</strong> OBSERVATION, <strong>RESULTS</strong> & <strong>DISCUSSION</strong> 125Table 3.9: Entrapment efficiency of ethosomes suspensionS/No. Ethosomes Qt Qs %EE1. FE3, EAE 2.5 1.0281 58.872. FE4, EAE 2.5 0.8831 64.673. FE7, EAE 2.5 0.7416 70.304. FE8, EAE 2.5 0.6364 74.545. FE3 2.5 0.8326 6<strong>6.</strong>66<strong>6.</strong> FE4 2.5 0.7916 68.337. FE7 2.5 0.6921 72.318. FE8 2.5 0.6021 75.91EE =entrapment efficiency, Qt = amount of extract added, Qs = amount detected in thesupernatant.<strong>6.</strong>4.3 In-vitro drug release studyPercentage drug release of hydrogel containing EE & EAE extract was observed to be-9.89 & 11.25% (at 30 min.) and 47.63% & 48.63% (at 240 min.) respectively wherehydroalcohalic gel containing EE & EAE extract was observed to be- 13.62% & 15.43%(at 30 min.) and 60.81% & 62.75%(at 240 min.) respectively and Ethosomal gelcontaining EE & EAE extract was observed to be 2<strong>6.</strong>86% and 28.31% (at 30 min.) and77.98% & 78.42% (at 240 min.) respectively. It was observed that addition of ethanol informulation increase the release by increasing permeation properties of gel. Theethosomal gel containing EAE extract (formulation FE EAE ) showed maximum drugrelease as compared to others formulation. (Table.3.11, Fig.3.17, 3.18)Standard calibration curve of S. acidum plant extract for its active constituentStandard calibraction curve of S. acidum extract was determined by plotting absorbace vsconcentraction at 255 nm and it follow the beer’s law. The results are shown inTable.3.10 and Fig.3.16
<strong>6.</strong> OBSERVATION, <strong>RESULTS</strong> & <strong>DISCUSSION</strong> 126Figure 3.16: Standard calibration curve of S. acidum at 255 nm.y=0.27x-, r 2 =0.997Table 3.10: Standard calibration curve of S. acidum at 255 nmS.No Concentration (µg/ml) Absorbance1.2.3.4.5.<strong>6.</strong>Blank0.20.40.60.81.00.0000.0490.1120.1740.2130.271
<strong>6.</strong> OBSERVATION, <strong>RESULTS</strong> & <strong>DISCUSSION</strong> 127Table 3.11: Percentage Drug release of Formulated Hydrogel, Hydroalcohalica Gelcontaining EE and EAE extractTimeInterval(Min)% Drug release of formulationsF 7 F EAE FA FA EAE FE FE EAE1505.1205.4108.4210.2315.2115.433009.8911.2513.6215.432<strong>6.</strong>8628.314518.9119.6820.8122.2131.8132.12602<strong>6.</strong>4125.2328.2329.3242.1843.539035.6238.3245.5841.1255.4354.011204<strong>6.</strong>434<strong>6.</strong>7250.2449.4760.2561.891804<strong>6.</strong>8547.815<strong>6.</strong>1257.3274.2873.2124047.6348.1260.8162.7577.9878.42(F 7 = Hydrogel containing ethnolic extract, FF EAE =Hydrogel containing ethyl acetate extract,FA =Hydroalcohalic gel containing ethanolic extract, FA EAE =Hydroalcohalic gel containing ethylacetate extract, FE= Ethosomal gel containing ethanolic extract, FE EAE = Ethosomal gelcontaining ethyl acetate extract.)
Percentage drug releasePercentage drug release<strong>6.</strong> OBSERVATION, <strong>RESULTS</strong> & <strong>DISCUSSION</strong> 128Time (min)Figure 3.17: Release profile of Hydrogel, Hydroalcohalic gel and Ethosomegel containing EAE extractTime (min)Figure 3.18: Release profile of Hydrogel, Hydroalcohalic gel and Ethosomegel containing EE extract
log of % drug release% drug release<strong>6.</strong> OBSERVATION, <strong>RESULTS</strong> & <strong>DISCUSSION</strong> 129Drug release kinetic modelingOn comparison of kinetic modeling and release profile data it was evident that ethosomalgel FE EAE was found to release the drug in accordance to Higuchi kinetics, the regressioncoefficient was not found to be exactly near to 1, which could be due to influence ofsome other factors.(fig. 3.19- 3.21)Zero order kinetic1009080706050403020100y = 0.3077x + 1<strong>6.</strong>326R 2 = 0.87480 50 100 150 200 250 300time in min% Drug ReleaseLinear (% DrugRelease)Figure 3.19: Zero order kinetics of formulatio FE EAE through fabricateddiffusion cellFirst order kinetic of Etosome gel of EAE2.52y = 0.005x + 1.018R 2 = 0.45921.51log %dru releaseLinear (log %drurelease)0.500 100 200 300time (min)Figure 3.20: First order kinetics of formulatio FE EAE through fabricateddiffusion cell
% drug release<strong>6.</strong> OBSERVATION, <strong>RESULTS</strong> & <strong>DISCUSSION</strong> 130Higuchi model of Ethosome gel containing EAE9080706050403020100y = 5.5415x - 2.2218R 2 = 0.97590 5 10 15 20under root of time(min)% drug release drugLinear (% drug releasedrug)Figure 3.21: Release of formulatio FE EAE through fabricated diffusion celldata fitted to Higuchi model kinetics<strong>6.</strong>5 IN-VITRO ANTI-INFLAMMATORY STUDY OF OPTIMIZEDFORMULATIONDuring inflammation, lysosomal hydrolytic enzymes are released into the sites whichcause damages of the surrounding organelles and tissues with attendance variety ofdisorders. Various methods were employed to screen and study of drugs, chemicals,herbal preparations that exhibit anti-inflammatory properties or potentials. Thesetechniques include uncoupling of oxidative phosphorylation (ATP biogenesis linked torespiration), inhibition of denaturation of protein, erythrocyte membrane stabilization,lysosomal membrane stabilization, fibrinolytic assays and platelet aggregation. In thepresent study, HRBC membrane stabilization method was employed due to its simplicityand reproducibility.Percentage inhibition of HRBC haemolysis in hypotonic solution of hydrogel containingEE & EAE extract was observed to be- 18% & 31.3% (at 30 min.) and 4<strong>6.</strong>4% & 58.1%(at 240 min) respectively where as percentage inhibition of HRBC haemolysis inhydroalcohalic gel containing EE & EAE was observed to be- 20% & 35% (at 30 min.)and 52% & 67% (at 240 min.) respectively and for ethosomal gel containing EE & EAEextract was observed to be-37% & 46% respectively and 53% & 75% (at 240 min.)respectively. All the results were compared with standard voveran emulgel.
<strong>6.</strong> OBSERVATION, <strong>RESULTS</strong> & <strong>DISCUSSION</strong> 131The gel exhibited membrane stabilization effect by inhibiting hypotonicity induced lysesof erythrocyte membrane. The activity may be due to the presence of one or morephytochemical constituents present in the formulation. The result also showed that ethylacetate extract of S. acidum has better anti-inflammatory action as compared to ethanolicextract. The ethosomal gel containing EAE extract, formulation FE EAE showed maximumpercentage inhibition of HRBC haemolysis in hypotonic solution as compared to othersformulation.(Table.3.12)Table 3.12: The In-vitro anti-inflammatory activity of formulated gel by Red bloodCell Membrane Stabilization methodTimeInterval(Min)% Inhibition of haemolysis of FormulationsF 7 F EAE FA FA EAE FE FE EAEVoveran Emulgel(Standard Gel)15-15.11630263531301831.320353746454530.840.831423949486035.245.4384943.655569041.351.3445448.2596012045.655.8475952.667701804<strong>6.</strong>157.9506053.170742404<strong>6.</strong>458.1526753.97578(F 7 = Hydrogel containing ethnolic extract, FF EAE =Hydrogel containing ethyl acetate extract,FA =Hydroalcohalic gel containing ethanolic extract, FA EAE =Hydroalcohalic gel containing ethylacetate extract, FE= Ethosomal gel containing ethanolic extract, FE EAE = Ethosomal gelcontaining ethyl acetate extract.)<strong>6.</strong>6 IN-VIVO ANTI-INFLAMMATORY STUDY OF OPTIMIZEDFORMULATIONPercentage inhibition of edema by hydrogel containing EE & EAE extract in rat’s lefthind paw was observed to be- 13.87% & 15.32% (at 1 hr.) and 20.72% & 24.16% (at 2hr.) respectively where as in case of hydroalcohalic gel containing EE & EAE was
<strong>6.</strong> OBSERVATION, <strong>RESULTS</strong> & <strong>DISCUSSION</strong> 132observed to be- 23.19% & 25.0% (at 1 hr.) and 35.00% & 37.23% (at 4 hr.) respectivelyand for ethosomal gel containing EE & EAE extract inhibition was observed to be-28.10% & 32.13% 9 (at 1 hr.) respectively and 39.10% & 42.03% (at 4 hr. min.)respectively. All the results were compared with standard voveran emulgel gel.The result revealed that formulations containing ethyl acetate extract of S. acidum hasbetter anti-inflammatory action as compared to ethanolic extract. The ethosomal gelcontaining EAE extract, FE EAE show highest percentage inhibition of edema as comparedto others formulation (Table.3.13, 3.14 & fig.3.22).Table 3.13: Mean Paw edema Volume of the albino ratsHind Paw (Mean+SEM)FormulationMean Paw edema Volume1 hr 2hr 3hr 4hrControl 1.74+0.03 1.8+0.05 1.74+0.05 1.68+0.58F 7 1.61+0.03* 1.52+0.03** 1.46+0.04* 1.41+0.20*F EAE 1.60+0.04* 1.50+0.13* 1.49+0.50* 1.39+0.05*FA 1.61+0.04* 1.52+0.03* 1.32+0.60* 1.28+0.03*FA EAE 1.58+0.90** 1.42+0.07* 1.39+0.03* 1.22+0.60*EE 1.46+0.05* 1.28+0.02* 1.24+0.02* 1.16+0.04*FE EAE 1.22+0.03* 1.12+0.03** 1.10+0.03* 0.97+0.04*Standard Drug(Voveran Emulgel)1.2±0.05 0.84±0.04 0.78±0.03 0.74±0.024Values are expressed as X (Mean) +SEM, n=3. (One way ANOVA followed by Student t-test).Statistically significance of * P < 0.05, ** P
<strong>6.</strong> OBSERVATION, <strong>RESULTS</strong> & <strong>DISCUSSION</strong> 133Figure 3.22: Percentage inhibition of edemaPercentage inhibition of edemaTime (hr.)Table 3.14: Mean Percentage inhibition of edema% Inhibition (Mean+SEM)GroupPercentage inhibition of edema1 hr 2hr 3hr 4hrControl - - - -F 13.87+0.01 15.90+0.72 18.43+0.12 20.72+0.16F EAE 15.32+0.04 17.12+0.19 21.90+0.13 24.16+0.17FA 23.19+0.40 28.18+0.13 30.97+0.43 35.00+0.12FA EAE 25.50+0.10 31.03+0.10 3<strong>6.</strong>09+0.12 37.23+0.04EE 28.10+0.41 33.40+0.19 35.07+0.03 39.10+0.23FE EAE 32.13+0.16 38.52+0.70 41.78+0.24 42.03+0.97Standard Drug(Voveran Emulgel)41.02+0.16 49.00+0.03 51.10+0.05 55.95+0.90(F 7 = Hydrogel containing ethnolic extract, FF EAE =Hydrogel containing ethyl acetate extract, FA=Hydroalcohalic gel containing ethanolic extract, FA EAE =Hydroalcohalic gel containing ethylacetate extract, FE= Ethosomal gel containing ethanolic extract, FE EAE = Ethosomal gelcontaining ethyl acetate extract.)
<strong>6.</strong> OBSERVATION, <strong>RESULTS</strong> & <strong>DISCUSSION</strong> 134<strong>6.</strong>7 Skin Irritation StudyThe skin irritation test was conducted for a period of seven days and the results aretabulated in Table 3.15. The results indicated that the control preparation, test gel, FE EAEand marketed products did not cause any skin reaction. It can be assured that ethyl acetateextract of S. acidum and the excipients did not cause any skin irritation and can be used inthe gel formulation.Table 3.15: Skin irritation studyTreatment Day 1 Day 2 Day 3 Day 4 Day 5 Day 6 Day 7Control A A A A A A AFE EAE A A A A A A AVoveran emulgel A A A A A A AA – No reaction, B – Slight patchy erythema, C –Slight but confluent or moderate but patchyerythema, D – Moderate erythema, E – Severe erythema with or without edema.<strong>6.</strong>8 Stability StudyThe formulated gels were subjected to stability studies. No color fading was observed forall prepared gels. The pH of all formulations remained unchanged and was found to bewithin the range of <strong>6.</strong>2-7.2. The viscosity and spreadability of all gels remained unalteredand found to be within the range. The drug content was found to be in the limit 90% -103% for all gel formulation. (Table.3.16)
<strong>6.</strong> OBSERVATION, <strong>RESULTS</strong> & <strong>DISCUSSION</strong> 135Table 3.16: Accelerated Stability study of formulated gelBatch Color AppearanceSpreadibility(gm.cm/sec)Consistency(60 Sec)Viscosity(cps)PhDrugcontent (%)F3F4GreenishblackDarkGreenishHomogeneous 14.60 5 22230 <strong>6.</strong>84 99.77Homogeneous 18.50 6 24010 <strong>6.</strong>93 98.20F5 Greenish Homogeneous 20.15 6 18170 <strong>6.</strong>90 99.82F EAE Greenish Homogeneous 20.47 6 17828 <strong>6.</strong>91 99.96FA Greenish Homogeneous 23.00 9 16042 <strong>6.</strong>95 98.95FA EAE Greenish Homogeneous 23.12 9 16837 <strong>6.</strong>92 99.03FE Greenish Homogeneous 23.43 9 16042 7.01 99.82FE EAE Greenish Homogeneous 23.54 9 16042 <strong>6.</strong>99 99.86(F 7 = Hydrogel containing ethnolic extract, FF EAE =Hydrogel containing ethyl acetate extract, FA=Hydroalcohalic gel containing ethanolic extract, FA EAE =Hydroalcohalic gel containing ethylacetate extract, FE= Ethosomal gel containing ethanolic extract, FE EAE = Ethosomal gelcontaining ethyl acetate extract.)
<strong>6.</strong> OBSERVATION, <strong>RESULTS</strong> & <strong>DISCUSSION</strong> 103Table 3.2: Results of questioner for Sarcostemma acidum from selected study sites of IndiaTools ofinvestigation(Questioner)InferencesITribalPeopleRurulPeopleVillageFarmersVaidhyasHakimAyurvedicDoctorsTraditionalTherapistBotanistLN Soma Somavalli Somlata Somavalli Soma Somavalli Somlata SomavalliPUWhole plantRootWhole plantWhole plantWhole plantRootWhole plantRootWhole plant Whole plant Whole plantRootsDAsthma,SwellingCold,AsthmaSwelling,GastricproblemsRejuvenating,AsthmaFever, Cold,AsthmaDyspepsia,AsthmaAsthma,Gastric problemsInflammatoryInfection,AsthmaMOPThe plantwas crushedand madeinfusionwith thewater.The wholepart of plantjuice given tochildren torelief fromcold.Thick pasteprepared inwaterapplied tothe swellingareaJuice of wholeplant with otherherbal medicinewas taken orallyWhole partcrushed andmade topowderedgiven withwaterPowder part isgiven with cowmilk or LukewaterPowdered partgiven emptystomach to getrelief fromgastric problemThick Paste ofplant is applied inthe swelling areato prevent theinflammationFDBD for 2-3monthsBD, whenrequiredTID to theinfected areaOD, Regularly1-2 month whenweaknessobservedOD whenrequiredOD beforesleeping afterfood for onemonthsOD emptystomach for 1-2monthsBD applied to theswelling areaSS E V V CE CE E E EAbbr. I=Informants, LN= Local Name, PU= Part Used, SS=Status of species, D=Disease, MOP=Method of preparation, FD=Frequency of administration of medicine,OD=Once in a day, BD=twice in a day, TID=thrice in a day, E=Endangered, V=Vulnerable, CE=Critical Endangered