Over-Soft Clay
Over-Soft Clay
Over-Soft Clay

You also want an ePaper? Increase the reach of your titles
YUMPU automatically turns print PDFs into web optimized ePapers that Google loves.
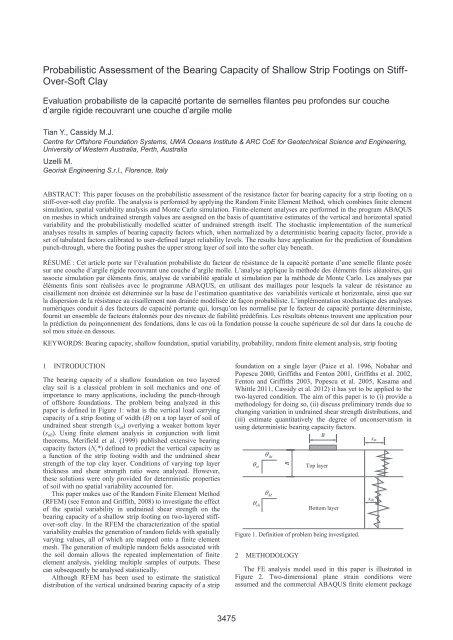
Proceedings of the 18 th International Conference on Soil Mechanics and Geotechnical Engineering, Paris 2013Proceedings of the 18 th International Conference on Soil Mechanics and Geotechnical Engineering, Paris 2013utilised (version 6.10, Dassault Systèmes 2010). A shallowfoundation with width B was founded on the surface of the twolayeredsoil, which was modelled by a linear-elastic perfectlyplasticTresca constitutive law with an undrained shear strength(s u ). The elastic response was defined by the Young’s modulus(E = 500s u ) and the Poisson’s ratio set as 0.49. Correspondingto one of the analysis cases of Merifield et al. (1999), the soilcontained a top layer of 1B thickness. For efficiency the infinitebottom layer of Merifield et al (1999). was shortened to 3.8B; adepth deep enough, however, to ensure no boundary effects.The analysis width was 6B. The lateral soil boundaries wereroller supported and the bottom was pinned. The top surfacewas assumed to be free. A fully bonded foundation/soilinterface was used to model the undrained behaviour.Bdefined in Merifield et al. (1999) as the ultimate bearingcapacity Q u normalised by the footing width B and top layershear strength s ut . Merifield et al. (1999) reported as 4.44(lower bound), 4.82 (upper bound) and 4.63 (average) for thesituation considered in Figure 2. A deterministic case was firstconducted in this paper with uniform undrained strengths of 20kPa and 10 kPa for the top and bottom layer, respectively. Anof 4.66 was obtained. This good agreement implies that theFE analyses in this paper are reliable and comparable to theMerifield et al. (1999) analyses.BTop layerBottom layer4.8 BFigure 3. Example random field (for case 1)6 BFigure 2. The FE model usedThe soil domain was divided into 60 by 48 square zones ofwidth 0.1B, as shown in Figure 2. In each zone the soilproperties were constant and defined by an undrained shearstrength and Young’s modulus . However, theseproperties changed from zone to zone representing the spatialvariability of the soil. For the majority of the soil domain a zonewas represented by one finite element. However, in a region ofsize 3B by 1B close to the strip footing (as bounded by heavylines in Figure 2) nine smaller finite elements per zone wereused. These smaller elements, each with the same materialproperties, were required to improve the numerical accuracy ofthe solution. Therefore, in total there are 5280 finite elements inthe mesh but only 2880 zones of spatially varying soilproperties.The spatially variable undrained shear strength of bothtop and bottom layer was modelled as a normally distributedrandom field with a mean and standard deviation. Consistent with the deterministic values of Merifieldet al. (1999), the mean shear strength of the top layer was set astwice the bottom layer, with values ofandassumed in this paper. The COV, vertical andhorizontal correlation length and for both top and bottomlayer vary systematically. Table 1 details the random variablesassumed for the 12 cases presented.For each case, 1000 realisations of the random fields ofundrained shear strength were generated using the LocalAverage Subdivision algorithm (Fenton and Vanmarcke 1990;Fenton 1994). One of the 1000 realisations of the random fieldof case 1 (see Table 1 for details) is illustrated in Figure 3.3 RESULTS3.1 Deterministic CaseThe modified bearing capacity factorwasCaseTable 1. Calculation cases and summary resultsBottom layerInput parametersTop layerAnalysis results( ) 1 0.1 0.1 0.3 0.1 0.1 0.3 0.93 0.02 5.0∙10 -42 0.1 0.1 0.1 0.1 0.1 0.1 0.98 0.01 1.3∙10 -33 0.1 0.1 0.1 0.1 0.1 0.3 0.95 0.02 5.6∙10 -34 0.1 0.1 0.3 0.1 0.1 0.1 0.96 0.01 1.0∙10 -45 0.1 0.1 0.3 0.1 10 0.3 0.94 0.07 0.1446 0.1 0.1 0.3 0.1 1 0.3 0.93 0.05 0.0577 0.1 0.1 0.3 1 10 0.3 0.93 0.18 0.2778 0.1 0.1 0.3 1 1 0.3 0.89 0.12 0.1339 0.1 10 0.3 0.1 0.1 0.3 0.92 0.04 0.02210 0.1 1 0.3 0.1 0.1 0.3 0.92 0.03 4.0∙10 -411 1 10 0.3 0.1 0.1 0.3 0.90 0.09 0.14912 1 1 0.3 0.1 0.1 0.3 0.90 0.05 0.054Note:3.2 Stochastic soil cases: variation of COV, constant The mean undrained shear strength of the top layer isused to defined a modified bearing capacity factor for thestochastic cases ( ) and wherein which Q ur is the stochastic ultimate bearing capacity. Thevalues of of the 1000 realisations random field for each casewere ordered and the sample median value denoted as . Thestandard deviation of the for the 1000 random fieldrealisations is calculated as ( ). The values of and( ) evaluated for all the cases presented in this paper areprovided in Table 1. The histogram of from the 1000random field realisations for case 2 (seeTable 1) is depicted in Figure 4, with = 0.98 and( ) . The empirical cumulative distributionfunctions for cases 1-4 are shown in Figure 5.In order to investigate the influence of changing the COV forboth or one of the layers, the cumulative curves for cases 1~4(1)3476
Technical Committee CFMS / Comité technique CFMSProceedings of the 18 th International Conference on Soil Mechanics and Geotechnical Engineering, Paris 2013are shown in Figure 5. In these cases the horizontal and verticalcorrelation lengths of both top and bottom layers were keptconstant as . As shown in the figure, the averagebearing capacity factor for all of the stochastic cases(represented by ) is less than the deterministic case. This isconsistent with the reports of Nobahar and Popescu (2000),Griffiths et al. (2002) and Cassidy et al. (2012). Further, whenthe COV of both layers is increased from 0.1 to 0.3 the averagebearing capacity reduces from 0.98 to 0.93 and the normalisedstandard deviation increases from 0.01 to 0.02. This is asexpected and is shown in the two extremity curves of Figure 5.Comparing the cases where the COV of only the top layer (case3: COV b =0.1, COV t =0.3) and only the bottom layer (case 4:COV b =0.3, COV t =0.1) provides more insight into themechanisms of failure. We can see from Figure 5 that the COVof the top layer has a more significant effect with case 3trending towards case 1 where both layers are 0.3. Moreover,the similarity of the shapes of case 2 and case 4 as well as case3 and case 1 implies that the top layer COV determines thevariation (standard deviation) of the curves.it provides a measure of the unconservatism in usingdeterministic bearing capacity factors, i.e., in neglectinguncertainty and spatial variability. In only 6 cases out of the 12analyzed, output samples resulted to be lognormal at the 95%confidence level using the Anderson-Darling test. Hence,estimating the probability of exceedence of unity fromcumulative values of fitted lognormal samples would not allowconfident assessement for all cases. Empirical cumulativedistribution functions were calculated for each sample. Theempirical probability P e of exceedence of unity for each case isnoted in the rightmost column in Table 1.The failure mechanisms of three selected realizations of case1 ( ) are shown in Figure 6. Theserepresent the minimum, median and maximum cases andare shown alongside the deterministic failure mechanism(uniform and mean parameter values). In all three cases theexistence of the random field results in a non-symmetric failuremechanism, with the minimum bearing capacity case mostunsymmetrical. With the increasing of bearing capacity, thefailure mechanism tends to resemble the deterministic case. Theimportance of spatial variability in the top layer can beobserved, with the majority of the failure mechanism residing inthat layer. Further, with higher variability and potential forweaker zones the mechanism for lower bearing capacity is bothmore unsymmetric and shorter (pulling it further into the toplayer).(a)(b)Figure 4 Histogram of for case 2(c)(d)Figure 6. Failure mechanisms from finite element analysis for(a) lowest, (b) median and (c) highest bearing capacity, and (d)deterministic uniform case (for clarity only a section of 3Bwidth and depth 2B show)Figure 5 Cumulative probability curves for varying COV ofcases 1 to 4The output samples of stochastic bearing capacity factornormalized by the deterministic value were analysed with theaim of estimating the frequentist probability of exceedence ofunity, i.e., the probability that the stochastic bearing capacityfactor exceeds the deterministic bearing capacity factor. Thisassessment is important in the context of engineering design, as3.3 Stochastic soil cases: variation of correlation length intop layerWith the top layer determined to play a more significant rolein the problem configuration of this paper further concentrationon the effect of top layer correlation length is discussed. Theresults for correlation length varying from 0.1B to 10B arepresented as cumulative probability curves in Figure 7. Theserepresent cases 5, 6, 1, 7 and 8 in Table 1. As for thecases (cases 5, 6 and 1), the largest bearing capacitycorresponds to the largest horizontal correlation length(case 5) while the minimum corresponds to(case 6). This is consistent with the observation of Griffiths etal. (2002) for the single layer case. In general, a largecorrelation length results in greater standard deviation of thebearing capacity, i.e. the foundation becomes more “non-3477
Proceedings of the 18 th International Conference on Soil Mechanics and Geotechnical Engineering, Paris 2013Proceedings of the 18 th International Conference on Soil Mechanics and Geotechnical Engineering, Paris 2013uniform”. The minimum bearing capacity occurs at= 2, COV = 0.1 and 0.3, and and = 0.1, 1 and 10.capacity of a strip footing penetrating stiff-over-soft clay was Canadian geotechnical conference, Montreal, Quebec.conducted by taking the spatial variability of undrained strength Paice, G. M., Griffiths, D. V. and Fenton, G. A. (1996). "Finite Elementinto account. The results indicate that with high spatialModeling of Settlements on Spatially Random Soil." ASCE Journalof Geotechnical Engineering 122(9): 777-779.variability in the undrained shear strength there is a significantPopescu, R., Deodatis, G. and Nobahar, A. (2005). "Effects of Randomreduction in the bearing capacity. Mean bearing capacity factors Heterogeneity of Soil Properties on Bearing Capacity."and statistical distributions were provided for 12 cases of s ut /s ub Probabilistic Engineering Mechanics 20(4): 324-341..For the case of top layer thickness equal to the strip footing3.4 Stochastic soil cases: variation of correlation length inbottom layerwidth presented it was shown that variation in the top layer hada greater effect on reducing the bearing capacity (whencorrelation distance was held constant). This was due to theunsymmetric bearing capacity shortening further into the toplayer.Comparison of the results of case 9, 10, 1, 11 and 12The empirical probabilities of exceedence of the deterministicindicates the correlation length effect of the bottom layer. Itbearing capacity factor in the stochastic case differ from case toagain shows that increasing horizontal correlation length tendscase, ranging from on the order of 10 -4 to 0.277, thus attestingto increase the standard deviation of the bearing capacity factorfor the influence of the magnitude of spatial variability and(see Table 1 and Figure 6). However, the largest averageuncertainty on the effects of stochastic modelling. Thebearing capacity corresponds to the minimum correlation lengthmaximum value observed for case 7 is well below a “central”case (case 1:). This differs to what isvalue of 0.5; hence, overall, it is assessed that the deterministicoccurring in the top layer. The maximum average bearingcase is significantly unconservative from an engineeringcapacity corresponds to the largest correlation length case 11,standpoint.which is consistent with the results of changing the correlationThe conclusions drawn in this paper may be specific for thelength of the top layer.geometery and soil conditions analysed. The 12 cases presentedhere, however, represent a small subset of 1600 cases analysedin a more ambitious numerical experiment. Cases of (i)= 4/3 and 2, (ii) COV = 0.1 and 0.3, (iii) and= 0.1, 1 and 10, as well as (iv) a gradient of increasingundrained shear strength with depth, and (v) a footingembedded to 0.5B into the top layer, make up the fullprogramme. The results of the larger study will be published indue course.5 ACKNOWLEDGEMENTSThis research is being undertaken with support from theAustralia-China Natural Gas Technology Partnership Fund andThe Lloyd’s Register Educational Trust.6 REFERENCESCassidy, M.J., Uzielli, M. and Tian, Y. (2012) "Probabilistic CombinedFigure 7. Cumulative probability curves for variation ofLoading Failure Envelopes of a Strip Footing on Spatially Variablecorrelation distance in the top layer (cases 1, 5, 6, 7 and 8)Soil". Computers and Geotechnics, In Press. http//dx.doi.org/10.1016/j.compgeo.2012.10.008Dassault Systèmes (2010) "Abaqus Analysis User’s Manual"Fenton, G. A. (1994). "Error Evaluation of Three Random-FieldGenerators". J. Eng. Mech., 120(12), 2478–2497.Fenton, G. A. and Griffiths, D. V. (2003). "Bearing-Capacity Predictionof Spatially Random C-Phi Soils." Canadian Geotechnical Journal40(1): 54-65.Fenton, G. A. and Griffiths, D. V. (2008). "Risk Assessment inGeotechnical Engineering". Hoboken, N.J., John Wiley & Sons.Fenton, G. A. and Vanmarcke, E. H. (1990). Simulation of RandomFields via Local Average Subdivision. J. Eng. Mech., 116(8),1733–1749.Griffiths, D. V. and Fenton, G. A. (2001). "Bearing Capacity ofSpatially Random Soil: The Undrained <strong>Clay</strong> Prandtl ProblemRevisited." Geotechnique 51(4): 351-359.Griffiths, D. V., Fenton, G. A. and Manoharan, N. (2002). "BearingCapacity of Rough Rigid Strip Footing on Cohesive Soil:Probabilistic Study." Journal of Geotechnical andGeoenvironmental Engineering 128(9): 743-755.Kasama, K. and Whittle, A. J. (2011). "Bearing Capacity of SpatiallyFigure 8. Cumulative probability curves for variation ofcorrelation length in bottom layer (cases 9, 10, 1, 11 and 12)Random Cohesive Soil Using Numerical Limit Analyses." Journalof Geotechnical and Geoenvironmental Engineering 137(11): 989-996.4 CONCLUSIONSMerifield, R. S., Sloan, S. W. and Yu, H. S. (1999). "Rigorous PlasticitySolutions for the Bearing Capacity of Two-Layered <strong>Clay</strong>s."Geotechnique 49(4): 471-490.Nobahar, A. and Popescu, R. (2000). "Spatial Variability of SoilIn this study, finite element analysis of the vertical bearing Properties - Effects on Foundation Design". Proceedings of 53rd3478