Presentation slides and script (pdf, 2.6MB) | Investors - BP
Presentation slides and script (pdf, 2.6MB) | Investors - BP
Presentation slides and script (pdf, 2.6MB) | Investors - BP

You also want an ePaper? Increase the reach of your titles
YUMPU automatically turns print PDFs into web optimized ePapers that Google loves.
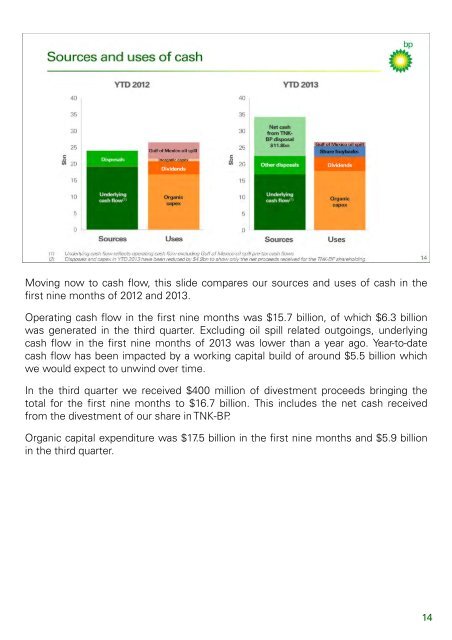
Moving now to cash flow, this slide compares our sources <strong>and</strong> uses of cash in thefirst nine months of 2012 <strong>and</strong> 2013.Operating cash flow in the first nine months was $15.7 billion, of which $6.3 billionwas generated in the third quarter. Excluding oil spill related outgoings, underlyingcash flow in the first nine months of 2013 was lower than a year ago. Year-to-datecash flow has been impacted by a working capital build of around $5.5 billion whichwe would expect to unwind over time.In the third quarter we received $400 million of divestment proceeds bringing thetotal for the first nine months to $16.7 billion. This includes the net cash receivedfrom the divestment of our share in TNK-<strong>BP</strong>.Organic capital expenditure was $17.5 billion in the first nine months <strong>and</strong> $5.9 billionin the third quarter.14

![[PDF] Deepwater Horizon: Accident Investigation Report - BP](https://img.yumpu.com/51697031/1/190x245/pdf-deepwater-horizon-accident-investigation-report-bp.jpg?quality=85)