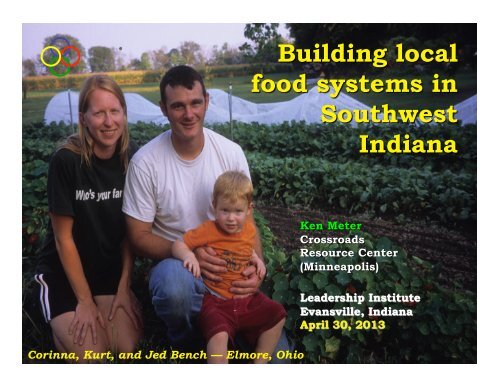
Corinna, Kurt, and Jed Bench — Elmore, Ohio - Upgrade
Corinna, Kurt, and Jed Bench — Elmore, Ohio - Upgrade
Corinna, Kurt, and Jed Bench — Elmore, Ohio - Upgrade
You also want an ePaper? Increase the reach of your titles
YUMPU automatically turns print PDFs into web optimized ePapers that Google loves.
<strong>Corinna</strong>, <strong>Kurt</strong>, <strong>and</strong> <strong>Jed</strong> <strong>Bench</strong> <strong>—</strong> <strong>Elmore</strong>, <strong>Ohio</strong>
plus Maui & Hawai’i<strong>and</strong> Fairbanks, Alaska95 regions in 32 states & Manitoba
Vision for local food economiesBuild:HealthWealthConnectionCapacity
Photo: DSC
Photo: DSC
Supply ChainFoodServiceProducerProcessorDistributor Retailer Consumer
Value ChainFoodServiceProducerProcessorDistributor Retailer Consumer
Value ChainClimateAirSoilSunlightWaterFoodServiceProducerProcessorDistributor Retailer Consumer
Value ChainClimateAirSoilSunlightWaterFoodServiceProducerProcessorDistributor Retailer ConsumerFertility
Value NetworkNon ProfitsPolicyCouncilRenewableEnergyProducerConsumer:“Coproducer”ResearcherEducatorRecyclerProcessorDistributorFoodServiceRetailer
Food WebNon ProfitsPolicyCouncilRenewableEnergyProducerConsumer:“Coproducer”ResearcherEducatorRecyclerProcessorDistributorFoodServiceRetailer
Colfax, Indiana $1 million sales
This Old Farm <strong>—</strong> ColfaxTOF Meat ProcessingThis Old FarmProcesses $2.75 million of meat
This Old Farm <strong>—</strong> ColfaxTOF Meat ProcessingThis Old Farm21 workers75 farms:• 35 produce• 30 livestock• 10 artisanal products
3,000 consumersLocal restaurantsWorkers buy localWholesalers:• Green B.E.A.N.• Chicago Local Foods• & MoreTOF Meat ProcessingThis Old FarmLocalmarketingagents21 workersOrganiccertifiersLocally producedfarm inputs75 farms:• 35 produce• 30 livestock• 10 artisanal products
3,000 consumersLocal restaurantsWorkers buy localWholesalers:• Green B.E.A.N.• Chicago Local Foods• & MoreTOF Meat ProcessingThis Old FarmLocalmarketingagents21 workersOrganiccertifiersLocally producedfarm inputs75 farms:• 35 produce• 30 livestock• 10 artisanal products
B.E.A.N. LLCFounded in Indianapolis (2007)Now 130+ employees
B.E.A.N. LLCGreen B.E.A.N. DeliveryHome Grocery Delivery Service
B.E.A.N. LLCTiny Footprint(Distributor)Green B.E.A.N. DeliveryTwo Related Companies
B.E.A.N. LLCTiny Footprint(Distributor)Green B.E.A.N. DeliveryThe Feel GoodFarmEc<strong>Ohio</strong> FarmTwo Companies & Two Farms
B.E.A.N. LLCTiny Footprint(Distributor)ResidentialconsumersGreen B.E.A.N. Delivery130 EmployeesIndependent farmsFood Business Clusters
B.E.A.N. LLCTiny Footprint(Distributor)ResidentialconsumersGreen B.E.A.N. Delivery130 EmployeesThe Feel GoodFarmIndependent farmsEc<strong>Ohio</strong> FarmFood Business Clusters
B.E.A.N. LLCHealth &WellnessPartnersTiny Footprint(Distributor)Residential &corporateconsumersGreen B.E.A.N. Delivery130 workersFeel Good FarmsIndependent farmsEc<strong>Ohio</strong> FarmFood Business Clusters
B.E.A.N. LLCHealth &WellnessPartnersTiny Footprint(Distributor)Residential &corporateconsumersGreen B.E.A.N. Delivery130 workersThe Feel GoodFarmIndependent farmsEc<strong>Ohio</strong> FarmFood Business Clusters
B.E.A.N. LLCIndianapolisGreen B.E.A.N.DeliveryColumbusCincinnatiSt. LouisLouisvilleAggregation & Delivery Centers in other cities
B.E.A.N. LLCIndianapolisGreen B.E.A.N.DeliveryColumbusCincinnatiSt. LouisLouisvilleAggregation & Delivery Centers in other cities
SW IndianaSponsor:WelbornBaptistFoundationCounties:DuboisGibsonPikePoseySpencerV<strong>and</strong>erburghWarrick
Popula3oninSouthwestIndiana,1969‐201112010080SWIndianaIndiana604020019691971197319751977197919811983198519871989199119931995199719992001200320052007200920111996=100Bureau of Economic Analysis
8Personal income in SW Indiana Counties, 1969 - 201176$billions(2011)543210196197 9197 0197 1197 2197 3197 4197 5197 6197 7197 8198 9198 0198 1198 2198 3198 4198 5198 6198 7198 8199 9199 0199 1199 2199 3199 4199 5199 6199 7199 8200 9200 0200 1200 2200 3200 4200 5200 6200 7200 8201 9201 01DuboisGibsonPikePoseySpencerV<strong>and</strong>erburghWarrickBureau of Economic Analysis
Household income in SW Indiana, 2007-2011households25,00020,00015,00010,00096,000 residents(26%) earn lessthan 185% ofpoverty5,0000Less than $10,000$10,000 to $14,999$15,000 to $19,999$20,000 to $24,999$25,000 to $29,999$30,000 to $34,999$35,000 to $39,999$40,000 to $44,999$45,000 to $49,999$50,000 to $59,999$60,000 to $74,999$75,000 to $99,999$100,000 to$124,999$125,000 to$149,999$150,000 to$199,999$200,000 or moreCensus BureauLow-income residents spend $200 million buying food
SW Indiana• 3,503 farmsCensus of Agriculture, 2007
SW Indiana Food & Farm EconomyCensus of Agriculture (2007)
SW Indiana Food & Farm EconomySource: Census of Agriculture, 2007
SW Indiana Food & Farm EconomyCensus of Agriculture, 2007
Census of Agriculture, 2007137 farms selldirect to consumers
Farm Production Balance inSouthwest Indiana, 1969-2011800700600Cash ReceiptsProduction expensesBalance$ millions (current)5004003002001000-1001969197119731975197719791981198319851987198919911993199519971999200120032005200720092011Bureau of Economic Analysis
Farm Production Balance inSouthwest Indiana, 1969-20111,2001,000Cash receipts$ millions (2011 dollars)800600400Production expenses200-1969197119731975197719791981198319851987198919911993199519971999200120032005200720092011Balance(200)Bureau of Economic Analysis
Farm Production Balance inSouthwest Indiana, 1969-20111,2001,000Cash receipts$ millions (2011 dollars)800600400200Production expensesBalance$14 million less than 1969-1969197119731975197719791981198319851987198919911993199519971999200120032005200720092011(200)Bureau of Economic Analysis$789 million gain since 1989
SW Indiana Food & Farm Economygain $34 million in production costsBureau of Economic AnalysisAverages for (1989-2011)
SW Indiana Food & Farm Economy
SW Indiana Food & Farm EconomyPlus…• Farm families earn $20 million ofother farm-related income• And receive $39 million in federalsupports each yearSource: Bureau of Economic Analysis
Crop <strong>and</strong> livestock salesin Southwest Indiana, 1969-2011700600$ millions (2011 dollars)500400300200Livestock10001969197119731975197719791981198319851987198919911993199519971999200120032005200720092011CropsBureau of Economic Analysis
44% of farmsreported netlosses in 2007
Farm production expenses inSouthwest Indiana, 1969-2011200180160140120100806040200196919711973197519771979198119831985198719891991199319951997199920012003$ millions (2011 dollars)2005200720092011Feed purchasedLivestock purchasedSeed purchasedFertlizer <strong>and</strong> LimePetroleum productsHired farm laborBureau of Economic Analysis
$270 million of these farm inputsare sourced outside the stateSource: Ken Meter using data from Census of Agriculture, 2007
Using local inputswould reduce these lossesCompost at Pleasantview Farm (Circleville)
Also a region of food consumers...
Finding Food in Farm CountryAs farmers struggle...Source: Ken Meter using Bureau of Labor Statistics
Finding Food in SW IndianaMarkets for food eaten at home$ millionsMeats, poultry, fish, <strong>and</strong> eggs 124Fruits & vegetables 109Cereals <strong>and</strong> bakery products 85Dairy products 64“Other,” incl. sweets, fats, & oils 219Census Bureau & BLS
All told, SW Indiana• Gains $34 million in production• Gains $39 million in subsidies• Loses $270 million buying inputs• Loses $900 million buying food
Finding Food in Farm CountryTotal loss is:
SW Indiana consumers matterIf each resident bought $5 of fooddirectly from local farms each week...…farms would earn $98 millionof new revenue (18% increase)
U.S. data
U.S. DataUSDA / Economic Research Service
U.S. DataUSDA / Economic Research Service
U.S. DataUSDA / Economic Research Service
USDA / Economic Research Service
U.S. Youth Who are OverweightPercent by Age>95th percentile for BMI by age <strong>and</strong> sex, based on NHANES I reference dataSource: Troiano RP, Flegal KM. Pediatrics 1998;101(3):497-504. NHANES1999, National Center for Health Statistics. Chart by Melinda Hemmelgarn
Source: NHANES <strong>—</strong> National Health <strong>and</strong> Nutrition Examination Survey
Consumption out of balance• 50% of U.S. public school studentsqualify for free / reduced lunch• 10% of households are foodinsecureSource: USDAMural: The Food Project
Health suffersSource: CDC/Walters, Harvard Public Health/Colditz
U.S. Data$176 billionUSDA / Economic Research Service
Direct Food Sales
Census of Agriculture
Innovative farm operationsWinter CSAMilan, MinnesotaFresh fresh organic greensNovember to AprilSells only within 30 miles
Winter CSA <strong>—</strong> Milan, Minnesota
Winter CSA <strong>—</strong> Milan, Minnesota
Organic Sales
Organic Valley
$880 million sales
Viroqua, WisconsinWestern WisconsinFood Enterprise Center(2009 to present: Advisor)
Viroqua, Wisconsin
Viroqua, Wisconsin• Economic DevelopmentAssociation buys building• 100,000 square feet
Viroqua Business ClusterKeewaydinOrganicsFifth SeasonCo-opOrganicherbalproductsTBDNonprofits
Viroqua Business ClusterMeatproc.KeewaydinOrganicsFifth SeasonCo-opHospitalFoodco-opHerbalproductsTBDOrganicValleySchoolsNonprofitsAmishfarmers
Viroqua, Wisconsin
North Alabama11 Counties:ColbertCullmanDeKalbFranklinJacksonLauderdaleLawrenceLimestoneMadisonMarshallMorgan
Food Banks explore wider rolesHuntsvilleFood Bankdiscoveredthey weredistributingcanned peasfrom ChinaPhoto: Food Bank of North Alabama
Huntsville, Alabama
Photo: FBNA
Vision for local food economiesBuild:HealthWealthConnectionCapacity


