Dust Up: Review of Harmful PM10 Dust Emissions in the Mackay ...
Dust Up: Review of Harmful PM10 Dust Emissions in the Mackay ...
Dust Up: Review of Harmful PM10 Dust Emissions in the Mackay ...

Create successful ePaper yourself
Turn your PDF publications into a flip-book with our unique Google optimized e-Paper software.
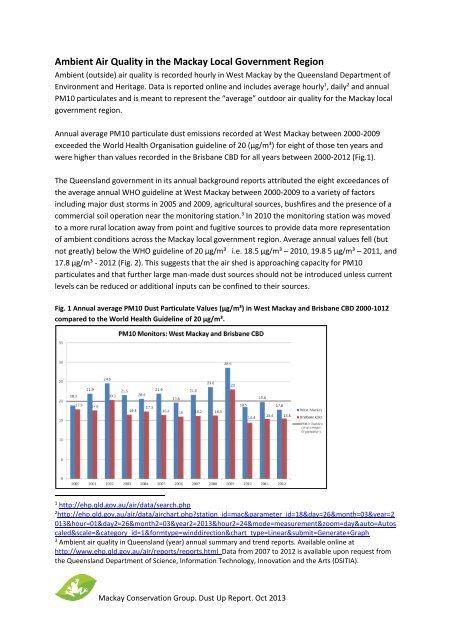
Ambient Air Quality <strong>in</strong> <strong>the</strong> <strong>Mackay</strong> Local Government RegionAmbient (outside) air quality is recorded hourly <strong>in</strong> West <strong>Mackay</strong> by <strong>the</strong> Queensland Department <strong>of</strong>Environment and Heritage. Data is reported onl<strong>in</strong>e and <strong>in</strong>cludes average hourly 1 , daily 2 and annual<strong>PM10</strong> particulates and is meant to represent <strong>the</strong> “average” outdoor air quality for <strong>the</strong> <strong>Mackay</strong> localgovernment region.Annual average <strong>PM10</strong> particulate dust emissions recorded at West <strong>Mackay</strong> between 2000-2009exceeded <strong>the</strong> World Health Organisation guidel<strong>in</strong>e <strong>of</strong> 20 (µg/m³) for eight <strong>of</strong> those ten years andwere higher than values recorded <strong>in</strong> <strong>the</strong> Brisbane CBD for all years between 2000-2012 (Fig.1).The Queensland government <strong>in</strong> its annual background reports attributed <strong>the</strong> eight exceedances <strong>of</strong><strong>the</strong> average annual WHO guidel<strong>in</strong>e at West <strong>Mackay</strong> between 2000-2009 to a variety <strong>of</strong> factors<strong>in</strong>clud<strong>in</strong>g major dust storms <strong>in</strong> 2005 and 2009, agricultural sources, bushfires and <strong>the</strong> presence <strong>of</strong> acommercial soil operation near <strong>the</strong> monitor<strong>in</strong>g station. 3 In 2010 <strong>the</strong> monitor<strong>in</strong>g station was movedto a more rural location away from po<strong>in</strong>t and fugitive sources to provide data more representation<strong>of</strong> ambient conditions across <strong>the</strong> <strong>Mackay</strong> local government region. Average annual values fell (butnot greatly) below <strong>the</strong> WHO guidel<strong>in</strong>e <strong>of</strong> 20 µg/m³ i.e. 18.5 µg/m³ – 2010, 19.8 5 µg/m³ – 2011, and17.8 µg/m³ - 2012 (Fig. 2). This suggests that <strong>the</strong> air shed is approach<strong>in</strong>g capacity for <strong>PM10</strong>particulates and that fur<strong>the</strong>r large man-made dust sources should not be <strong>in</strong>troduced unless currentlevels can be reduced or additional <strong>in</strong>puts can be conf<strong>in</strong>ed to <strong>the</strong>ir sources.Fig. 1 Annual average <strong>PM10</strong> <strong>Dust</strong> Particulate Values (µg/m³) <strong>in</strong> West <strong>Mackay</strong> and Brisbane CBD 2000-1012compared to <strong>the</strong> World Health Guidel<strong>in</strong>e <strong>of</strong> 20 µg/m³.1http://ehp.qld.gov.au/air/data/search.php2http://ehp.qld.gov.au/air/data/airchart.php?station_id=mac¶meter_id=18&day=26&month=03&year=2013&hour=01&day2=26&month2=03&year2=2013&hour2=24&mode=measurement&zoom=day&auto=Autoscaled&scale=&category_id=1&formtype=w<strong>in</strong>ddirection&chart_type=L<strong>in</strong>ear&submit=Generate+Graph3Ambient air quality <strong>in</strong> Queensland (year) annual summary and trend reports. Available onl<strong>in</strong>e athttp://www.ehp.qld.gov.au/air/reports/reports.html Data from 2007 to 2012 is available upon request from<strong>the</strong> Queensland Department <strong>of</strong> Science, Information Technology, Innovation and <strong>the</strong> Arts (DSITIA).<strong>Mackay</strong> Conservation Group. <strong>Dust</strong> <strong>Up</strong> Report. Oct 2013