Discrete SIR Model of Epidemics An Example of a Nonlinear System ...
Discrete SIR Model of Epidemics An Example of a Nonlinear System ...
Discrete SIR Model of Epidemics An Example of a Nonlinear System ...

Create successful ePaper yourself
Turn your PDF publications into a flip-book with our unique Google optimized e-Paper software.
<strong>Discrete</strong> <strong>SIR</strong> <strong>Model</strong> <strong>of</strong> <strong>Epidemics</strong><strong>An</strong> <strong>Example</strong> <strong>of</strong> a <strong>Nonlinear</strong> <strong>System</strong> <strong>of</strong> <strong>Discrete</strong> Dynamical<strong>System</strong>sMath 232, Spring 2012In this example, we will consider a disease that is spreading throughout the United States. The Centersfor Disease Control and Prevention (CDC) is interested in knowwing and experimenting with a modelfor this new disease before it actually becomes a real epidemic. Their goal is to determine how toprevent such an epidemic.Step 1: Identify the ProblemPredict the spread <strong>of</strong> a disease in a region.Step 2: Make Simplifying AssumptionsAssumptions:The population can be considered as divided into three categories: susceptible, infected, andremoved.No one enters or leaves the community, and there is no contact outside the community.Each person is either susceptible (capable <strong>of</strong> being infected), infected (already has the illness), orremoved (already had the illness and will not get it again -- includes death).Initially, every person is either susceptible or infected.Once someone gets the illness, they cannot get it again (e.g., chicken pox).The average length <strong>of</strong> the disease is three weeks, over which time the person is deemed infectedand can spread the disease.Our time period for the model will be one week.The spread <strong>of</strong> disease is proportional to both the number <strong>of</strong> susceptible individuals and the number<strong>of</strong> infected individuals.Initially, assume that the transmission coefficient is constant (actually, it is probabilistic).Variables: S(n) = the number <strong>of</strong> people susceptible after time period nI(n) = the number <strong>of</strong> people infected after time period nR(n) = the number <strong>of</strong> people removed after time period nn = the number <strong>of</strong> one-week time periodsa = the rate at which the disease is spread (the transmission coefficient) (per week)
Step 3: Construct the <strong>Model</strong>Since we have assumed that a person is sick for three weeks, one third <strong>of</strong> the infected people will beremoved each week. Therefore,The valueis the removal rate per week, and representes the proportion <strong>of</strong> infected personsremoved from the infected population each week. The population <strong>of</strong> infected people, I(n), will haveterms that both increase and decrease its amount over time (from susceptible individuals becominginfected and from infected individuals becoming removed). So,<strong>of</strong> individuals becoming infected. Therefore,. Finally, the susceptible population decreases as a resultStep 4: Solve and Interpret the <strong>Model</strong>We cannot solve this by hand or analytically at all.First, we will determine the equilibrium value(s).Thus, there are infinitely many equilibrium solutions. Most importantly, the equilibrium value forthe infected population is zero. We must determine if this is a stable equilibrium value.To get an idea, we will numerically solve the discrete dynamical system with a given set <strong>of</strong> differentinitial conditions.(4.1)(4.2)
(4.2)Assume that a = 0.00167, and I(0) = 3, S(0) = 997, and R(0) = 0 (so the total population is 1,000).999.8656890(4.3)(4.4)
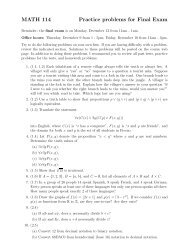
900800700Susceptible60050040030020010000 10 20 30Weeks
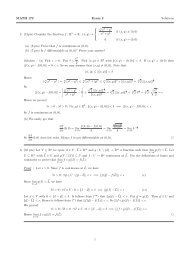
500400Infected3002001000 10 20 30Weeks
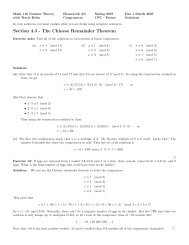
800600Removed40020000 10 20 30WeeksIt appears that the infection peaks at approximately 8 weeks. Checking:554.7417490570.1200230395.2263237It appears that the infection does, in fact, peak at 8 weeks.(4.5)(4.6)(4.7)