Intra- and inter-laboratory variation in the scoring of micronuclei and ...
Intra- and inter-laboratory variation in the scoring of micronuclei and ...
Intra- and inter-laboratory variation in the scoring of micronuclei and ...

Create successful ePaper yourself
Turn your PDF publications into a flip-book with our unique Google optimized e-Paper software.
Mutation Research 534 (2003) 45–64<strong>Intra</strong>- <strong>and</strong> <strong><strong>in</strong>ter</strong>-<strong>laboratory</strong> <strong>variation</strong> <strong>in</strong> <strong>the</strong> scor<strong>in</strong>g <strong>of</strong> <strong>micronuclei</strong><strong>and</strong> nucleoplasmic bridges <strong>in</strong> b<strong>in</strong>ucleated human lymphocytesResults <strong>of</strong> an <strong><strong>in</strong>ter</strong>national slide-scor<strong>in</strong>g exerciseby <strong>the</strong> HUMN projectMichael Fenech a , Stefano Bonassi b,∗ , Julie Turner a , Cecilia L<strong>and</strong>o b ,Marcello Ceppi b , Wushou Peter Chang c , N<strong>in</strong>a Holl<strong>and</strong> d , Michel<strong>in</strong>e Kirsch-Volders e ,Errol Zeiger f , Maria Paola Bigatti g , Claudia Bolognesi h , Jia Cao i , Giuseppe De Luca j ,Mar<strong>in</strong>a Di Giorgio k , Lynnette R. Ferguson l , Aleks<strong>and</strong>ra Fucic m , Omar Garcia Lima n ,Valeria V. Hadjidekova o , Patrizia Hrelia p , Alicja Jaworska q , Gordana Joksic r ,A.P. Krishnaja s , Tung-Kwang Lee t , Antonietta Martelli u , Michael J. McKay v ,Lucia Migliore w , Ekater<strong>in</strong>a Mirkova x , Wolfgang-Ulrich Müller y , Youichi Odagiri z ,Thierry Orsiere a1 , Maria Rosaria Scarfì a2 , Maria J. Silva a3 , Toshio S<strong>of</strong>uni a4 ,Jordi Suralles a5 , Giorgio Trenta a6 , Irena Vorobtsova a7 , Anne Vral a8 , Andrea Zijno a9a CSIRO Health Sciences <strong>and</strong> Nutrition, P.O. Box 10041, Adelaide, SA 5000, Australiab Department <strong>of</strong> Environmental Epidemiology, Istituto Nazionale per la Ricerca sul Cancro, L. go R. Benzi 10, I-16132 Genova, Italyc Institute <strong>of</strong> Environmental Health Sciences, National Yang M<strong>in</strong>g University Medical School, 155 Section 2 Lih-non Street, 11200 Taipei,Taiw<strong>and</strong> School <strong>of</strong> Public Health, University <strong>of</strong> California, 217 Warren, Berkeley, CA 94720-7360, USAe Laboratory for Cell Genetics, Vrije Universiteit Brussel, Ple<strong>in</strong>laan 2, 1050 Brussel, Belgiumf Errol Zeiger Consult<strong>in</strong>g, Chapel Hill, NC 27517, USAg Dipartimento di Biologia Animale e dell’ Uomo, University <strong>of</strong> Tur<strong>in</strong>, V. Accademia Albert<strong>in</strong>a 17, 10123 Tur<strong>in</strong>, Italyh Toxicological Evaluation Unit, Istituto Nazionale per la Ricerca sul Cancro, L. go R. Benzi 10, 16132 Genova, Italyi Molecular Toxicology Laboratory, Third Military Medical University, Chong Q<strong>in</strong>g 400038, Ch<strong>in</strong>aj ANPA, Via V. Brancati 48, 00144 Rome, Italyk Laboratorio Dosimetria Biologica, Autoridad Regulatoria Nuclear, Av. del Libertador 8250, 1429 Capital Federal, Buenos Aires, Argent<strong>in</strong>al Auckl<strong>and</strong> Cancer Society Research Center, Private Bag 92019, Auckl<strong>and</strong> 1000, New Zeal<strong>and</strong>m Institute for Medical Research end Occupational Health, 10000 Zagreb, Ksaverska C2, Croatian Centro de Proteccion e Higiene de las Radiaciones, Calle 20 No. 4109 e/41y47 Miramar, AP 6195 Habana 6, Cubao Laboratory Radiation Mutagenesis, National Center Radiobiology <strong>and</strong> Radiation Protection, Bul. Kl. Ochridski 132, S<strong>of</strong>ia 1756, Bulgariap Department <strong>of</strong> Pharmacology, University <strong>of</strong> Bologna, Via Irnerio 48, 40126 Bologna, Italyq Norwegian Radiation Protection Authority, P.O. Box 55, 1332 Oesteraas, Norwayr V<strong>in</strong>ca Institute <strong>of</strong> Nuclear Sciences, Medical Protection Center, 300-110, P.O. Box 522, 11001 Belgrade, Yugoslavias Cell Biology Division, Bhabha Atomic Research Center, Mumbai 400 085, Indiat Department <strong>of</strong> Radiation Oncology, Brody school <strong>of</strong> Medic<strong>in</strong>e at ECU, Greenville, NC 27858, USAu DIMI, V. le Benedetto XV 2, 16132 Genoa, Italy∗ Correspond<strong>in</strong>g author.E-mail address: stefano.bonassi@istge.it (S. Bonassi).1383-5718/02/$ – see front matter © 2002 Elsevier Science B.V. All rights reserved.PII: S1383-5718(02)00248-6
M. Fenech et al. / Mutation Research 534 (2003) 45–64 47important methodological variables <strong>and</strong> establishst<strong>and</strong>ard protocols to enable more reliable comparison<strong>of</strong> data among laboratories <strong>and</strong> among populations;<strong>and</strong> (c) to establish prospective epidemiologicalstudies aimed at determ<strong>in</strong><strong>in</strong>g whe<strong>the</strong>r <strong>the</strong> MN frequencypredicts risk <strong>of</strong> cancer <strong>and</strong> o<strong>the</strong>r degenerativediseases associated with DNA damage <strong>and</strong> age<strong>in</strong>g[1,2].The HUMN Project was established <strong>in</strong> 1997 [1]<strong>and</strong> currently <strong>in</strong>volves <strong>the</strong> participation <strong>of</strong> more than35 laboratories worldwide. The impetus for thisproject was derived from <strong>the</strong> widespread use <strong>of</strong> <strong>the</strong>cytok<strong>in</strong>esis-block micronucleus (CBMN) assay tostudy DNA damage <strong>in</strong> human populations, <strong>and</strong> <strong>the</strong>recognition that by 1997 more than 12,000 measurements<strong>in</strong> human subjects had been reported <strong>in</strong> <strong>the</strong>literature us<strong>in</strong>g this method. Micronuclei are one <strong>of</strong><strong>the</strong> best established biomarkers <strong>of</strong> chromosome damage.They are used <strong>in</strong> <strong>the</strong> <strong>in</strong> vitro test<strong>in</strong>g <strong>of</strong> chemicals<strong>and</strong> radiation for genotoxicity [3–5] <strong>and</strong> also as an<strong>in</strong> vivo biomarker <strong>of</strong> exposure to genotox<strong>in</strong>s, <strong>and</strong>deficiency <strong>in</strong> folate <strong>and</strong> Vitam<strong>in</strong> B12 [6–13]. Micronucleiorig<strong>in</strong>ate from chromosome fragments orwhole chromosomes that lag at anaphase because <strong>the</strong>ylack a centromere, or <strong>the</strong> centromere is defective, or<strong>the</strong>re is a defect <strong>in</strong> <strong>the</strong> mechanism that enables <strong>the</strong>chromosomes to distribute correctly to <strong>the</strong> poles <strong>of</strong><strong>the</strong> cell at anaphase [3–5]. As a consequence, MNare expressed <strong>in</strong> divid<strong>in</strong>g cells. In human lymphocytessome MN are present as a result <strong>of</strong> a priorcell division <strong>in</strong> vivo, but most MN are expressed <strong>in</strong>lymphocytes after <strong>the</strong> cells are stimulated to divide<strong>in</strong> vitro. The CBMN assay relies on <strong>the</strong> observationthat cells that have completed nuclear division <strong>and</strong>have had <strong>the</strong>ir cytok<strong>in</strong>esis blocked with cytochalas<strong>in</strong>,express chromosome damage as MN <strong>in</strong> <strong>the</strong> result<strong>in</strong>gb<strong>in</strong>ucleated (BN) cells [14–16]. It has recently beenshown that it is possible to also score nucleoplasmicbridges (NPB), <strong>in</strong> addition to MN, <strong>in</strong> BN cells [3,5].NPB are an important biomarker <strong>of</strong> chromosome rearrangementthat is o<strong>the</strong>rwise not measured <strong>in</strong> <strong>the</strong>CBMN assay, <strong>and</strong> orig<strong>in</strong>ate from dicentric chromosomesthat are pulled to opposite poles <strong>of</strong> <strong>the</strong> cell atanaphase [3,5].The first objective <strong>of</strong> <strong>the</strong> HUMN project, i.e.compilation <strong>and</strong> comparison <strong>of</strong> data bases <strong>of</strong>base-l<strong>in</strong>e MN frequencies <strong>in</strong> human populations <strong>in</strong>cytok<strong>in</strong>esis-blocked lymphocytes, has already beencompleted <strong>and</strong> described [2]. This study <strong>of</strong> MN frequency<strong>in</strong> 6583 human subjects (measured <strong>in</strong> 25laboratories distributed <strong>in</strong> 16 countries) verified thatage <strong>and</strong> gender were <strong>the</strong> most important host factors<strong>in</strong>fluenc<strong>in</strong>g basel<strong>in</strong>e MN frequency. A model basedon <strong>the</strong> negative b<strong>in</strong>omial function <strong>of</strong> probability wasused to estimate <strong>the</strong> proportion <strong>of</strong> variability <strong>of</strong> MNfrequency that can be expla<strong>in</strong>ed by <strong>the</strong> studied parameters.The total amount <strong>of</strong> variability expla<strong>in</strong>ed by <strong>the</strong>complete model (which <strong>in</strong>cluded host factors, exposureto genotoxic agents, methodological parametersrelat<strong>in</strong>g to culture, slide preparation <strong>and</strong> scor<strong>in</strong>g criteria)was approximately 75%. Due to <strong>the</strong> correlationamong parameters <strong>in</strong>vestigated, <strong>the</strong> sum <strong>of</strong> varianceexpla<strong>in</strong>ed by all <strong>in</strong>dividual sources is greater than thisvalue.Because <strong>the</strong> CBMN assay is currently based onvisual scor<strong>in</strong>g <strong>of</strong> slides, <strong>the</strong> <strong><strong>in</strong>ter</strong>-scorer <strong>variation</strong> <strong>in</strong><strong>the</strong> <strong><strong>in</strong>ter</strong>pretation <strong>of</strong> scor<strong>in</strong>g criteria <strong>and</strong> <strong>in</strong> <strong>the</strong> recognition<strong>of</strong> BN cells, MN, <strong>and</strong> NPB could account fora large proportion <strong>of</strong> <strong>the</strong> observed variability <strong>in</strong> <strong>the</strong>assay. Therefore, we designed an <strong><strong>in</strong>ter</strong><strong>laboratory</strong> collaborativestudy to determ<strong>in</strong>e <strong>the</strong> extent <strong>of</strong> variability<strong>in</strong> <strong>the</strong> frequency <strong>of</strong> MN <strong>and</strong> o<strong>the</strong>r abovementionedendpo<strong>in</strong>ts as a function <strong>of</strong> visual scor<strong>in</strong>g <strong>of</strong> slidesby different laboratories <strong>and</strong> scorers, sta<strong>in</strong><strong>in</strong>g method<strong>and</strong> radiation dose.The specific aims <strong>of</strong> this study were1. To determ<strong>in</strong>e <strong>the</strong> extent <strong>of</strong> <strong><strong>in</strong>ter</strong>-<strong>laboratory</strong> <strong>variation</strong><strong>in</strong> <strong>the</strong> MN assay scores when a common set <strong>of</strong>scor<strong>in</strong>g criteria is used to score cells sampled from<strong>the</strong> same culture.2. To determ<strong>in</strong>e <strong>the</strong> extent <strong>of</strong> <strong>in</strong>tra-<strong>laboratory</strong> <strong>and</strong><strong>in</strong>tra-scorer <strong>variation</strong> <strong>in</strong> <strong>the</strong> CBMN assay.3. To determ<strong>in</strong>e <strong>the</strong> effect <strong>of</strong> different sta<strong>in</strong><strong>in</strong>g methodson <strong>the</strong> micronucleus assay scores.4. To evaluate <strong>the</strong> contribution <strong>of</strong> various parametersmeasured <strong>in</strong> <strong>the</strong> study to <strong>the</strong> total variability <strong>of</strong> <strong>the</strong>assay.O<strong>the</strong>r parallel aims were (a) to establish a comprehensiveset <strong>of</strong> scor<strong>in</strong>g criteria with an extensiveset <strong>of</strong> photomicrographs to assist <strong>in</strong> <strong>the</strong> <strong><strong>in</strong>ter</strong>pretation<strong>of</strong> slides (reported <strong>in</strong> accompany<strong>in</strong>g paper [17]), <strong>and</strong>(b) to determ<strong>in</strong>e an acceptable coefficient <strong>of</strong> <strong>variation</strong>for duplicate measurements by a s<strong>in</strong>gle scorer as ameans for quality control <strong>of</strong> acceptable data <strong>in</strong> futurestudies.
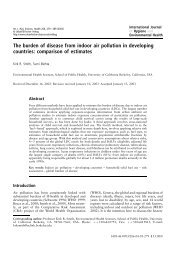
48 M. Fenech et al. / Mutation Research 534 (2003) 45–642. Materials <strong>and</strong> methods2.1. Study designThe study was advertised via <strong>the</strong> HUMN projectemail network. A total number <strong>of</strong> 34 laboratories from21 countries <strong>in</strong>dicated an <strong><strong>in</strong>ter</strong>est <strong>in</strong> participat<strong>in</strong>g <strong>and</strong>each <strong>of</strong> <strong>the</strong>se completed <strong>the</strong> study. Details about <strong>the</strong>laboratories, <strong>in</strong>clud<strong>in</strong>g geographical location, affiliation,pr<strong>in</strong>cipal <strong>in</strong>vestigators, number <strong>of</strong> scorers, <strong>and</strong><strong>the</strong> sta<strong>in</strong><strong>in</strong>g method used is <strong>in</strong> Table 1.The study design is shown schematically <strong>in</strong>Fig. 1. A blood sample was collected from a healthy30-year-old male. Isolated lymphocyte cultures for<strong>the</strong> CBMN assay were prepared us<strong>in</strong>g published procedures[3,6,16]. Briefly, three cultures <strong>in</strong> RPMI 1640with 10% foetal calf serum were prepared with acell concentration <strong>of</strong> 1 × 10 6 ml −1 . Two <strong>of</strong> <strong>the</strong> cultureswere exposed to gamma-rays (1 or 2 Gy at adose rate <strong>of</strong> 5 Gy/m<strong>in</strong>). The lymphocytes were stimulatedto divide with phytohaemagglut<strong>in</strong> <strong>and</strong> 44 hlater cytochalas<strong>in</strong>-B (4.5 ug/ml) (Sigma) was added<strong>and</strong> <strong>the</strong> cells harvested follow<strong>in</strong>g an additional 28 h.A cytocentrifuge (Sh<strong>and</strong>on) was used to prepareslides with two spots <strong>of</strong> cells on each slide. Thecells were air-dried for 10 m<strong>in</strong> <strong>and</strong> <strong>the</strong>n fixed <strong>in</strong> absolutemethanol for 10 m<strong>in</strong>. Half <strong>of</strong> <strong>the</strong> slides weresta<strong>in</strong>ed with Diff-Quik (Lab-Aids, Australia) <strong>and</strong> <strong>the</strong>rest left unsta<strong>in</strong>ed <strong>and</strong> stored desiccated at 4 ◦ C. Thesta<strong>in</strong>ed slides were mounted <strong>in</strong> DEPEX us<strong>in</strong>g a coverslip.Forty-seven sta<strong>in</strong>ed <strong>and</strong> 47 unsta<strong>in</strong>ed slideswere prepared from each culture. The slides werecoded us<strong>in</strong>g r<strong>and</strong>om numbers.Dur<strong>in</strong>g September 2000, each <strong>laboratory</strong> received(by express courier) a package that conta<strong>in</strong>ed (a) adetailed set <strong>of</strong> <strong>in</strong>structions, (b) one set <strong>of</strong> fixed <strong>and</strong>sta<strong>in</strong>ed slides (control, 1 <strong>and</strong> 2 Gy), (c) one set <strong>of</strong>slides that were fixed but not sta<strong>in</strong>ed (control, 1 <strong>and</strong>2 Gy), (d) a detailed scor<strong>in</strong>g procedure with diagrams<strong>and</strong> photomicrographs, <strong>and</strong> (e) a st<strong>and</strong>ard Excel templatefor record<strong>in</strong>g MN <strong>and</strong> NPB scores. Any brokenslides were replaced immediately with slides thathad been made from <strong>the</strong> same culture. The unsta<strong>in</strong>edslides were sta<strong>in</strong>ed upon arrival at <strong>the</strong> laboratoriesor kept desiccated at 4 ◦ C until sta<strong>in</strong>ed. Some laboratories(N = 6) had to alter <strong>the</strong>ir st<strong>and</strong>ard sta<strong>in</strong><strong>in</strong>gprocedure by <strong>in</strong>creas<strong>in</strong>g sta<strong>in</strong><strong>in</strong>g time to adequatelysta<strong>in</strong> <strong>the</strong> fixed, but unsta<strong>in</strong>ed, slides. A second batchTable 1Laboratories that contributed data to <strong>the</strong> HUMN <strong><strong>in</strong>ter</strong>-<strong>laboratory</strong>method comparison (affiliation can be obta<strong>in</strong>ed from <strong>the</strong> authorslist)CountryPr<strong>in</strong>cipalresearcher(s)ScorersSta<strong>in</strong><strong>in</strong>g methodArgent<strong>in</strong>a M. Di Giorgio 1 GiemsaAustralia M. Fenech 4 Diff-QuikAustralia M. McKay 1 DAPI aBelgium M. Kirsch-Volders 2 GiemsaBelgium H. Thierens <strong>and</strong> 1 Azure B—Eos<strong>in</strong>A. VralBulgaria V. Hadjidekova 1 GiemsaBulgaria E. Mirkova 1 GiemsaCroatia A. Fucic 1 GiemsaCuba O. Garcia Lima 1 GiemsaFrance T. Orsiere <strong>and</strong> 1 GiemsaA. BottaGermany W.U. Muller 2 GiemsaIndia A.P. Krishnaja 2 GiemsaItaly P.M. Bigatti 2 Giemsa bItaly C. Bolognesi 2 GiemsaItaly G. De Luca 1 GiemsaItaly P. Hrelia 1 GiemsaItaly A. Martelli 2 May-Grunwald,GiemsaItaly L. Migliore 2 GiemsaItaly M.R. Scarfì 2 GiemsaItaly G. Trenta 1 GiemsaItaly A. Zijno 1 GiemsaJapan Y. Odagiri 1 GiemsaJapan T. S<strong>of</strong>uni 1 Acrid<strong>in</strong>e Orange aNew Zeal<strong>and</strong> L.R. Ferguson 1 GiemsaNorway A. Jaworska <strong>and</strong> 2 GiemsaK. BredholtPortugal M.J. Silva 1 GiemsaPR Ch<strong>in</strong>a J. Cao Jia 3 GiemsaRussia I. Vorobtsova 1 May Grunwald,GiemsaSpa<strong>in</strong> R. Marcos <strong>and</strong> 1 GiemsaJ. SurallesTaiwan W.P. Chang 1 HemacolorUSA N. Holl<strong>and</strong> 4 DAPI aUSA T.K. Lee 1 Diff-QuikYugoslavia G. Joksic 1 GiemsaThe order <strong>of</strong> <strong>the</strong> laboratories <strong>in</strong> this table does not reflect <strong>the</strong>assigned <strong>laboratory</strong> numbers.a Indicates fluorescent sta<strong>in</strong><strong>in</strong>g method.b Data not available for lab-sta<strong>in</strong>ed slides because <strong>of</strong> difficultywith sta<strong>in</strong><strong>in</strong>g <strong>of</strong> <strong>the</strong> unsta<strong>in</strong>ed slides provided.<strong>of</strong> fixed but unsta<strong>in</strong>ed slides were sent (to four laboratories)which were subsequently successfully sta<strong>in</strong>ed<strong>in</strong> two laboratories but not <strong>in</strong> <strong>the</strong> o<strong>the</strong>r two, whichwere <strong>the</strong>refore unable to provide scores for <strong>the</strong>se
M. Fenech et al. / Mutation Research 534 (2003) 45–64 49Fig. 1. Schematic diagram <strong>of</strong> <strong>the</strong> study design.slides. Participants were advised to read <strong>the</strong> scor<strong>in</strong>gprocedure <strong>and</strong> scor<strong>in</strong>g criteria carefully <strong>and</strong> requestednot to proceed with scor<strong>in</strong>g if <strong>the</strong>y were uncerta<strong>in</strong>about any aspect <strong>of</strong> <strong>the</strong> scor<strong>in</strong>g procedure. If <strong>the</strong> laboratorieshad uncerta<strong>in</strong>ties regard<strong>in</strong>g <strong>the</strong> proceduresto be followed, <strong>the</strong>y were directed to consult with Dr.Michael Fenech, who was responsible for preparation<strong>of</strong> <strong>the</strong> slides. Participants were advised to record <strong>the</strong>
50 M. Fenech et al. / Mutation Research 534 (2003) 45–64data <strong>in</strong> <strong>the</strong> Excel template provided <strong>and</strong> to send <strong>the</strong>results to Dr. Stefano Bonassi by email by November30, 2000 for analysis. The results from each <strong>laboratory</strong>were r<strong>and</strong>omly allocated a code number from1 to 34 to allow a bl<strong>in</strong>d statistical analysis <strong>and</strong> toallow descriptions <strong>of</strong> results from s<strong>in</strong>gle laboratories.After data collection we were <strong>in</strong>formed that one <strong>laboratory</strong>did not follow <strong>the</strong> scor<strong>in</strong>g criteria provided;<strong>the</strong>ir scores were excluded from <strong>the</strong> study, which is<strong>the</strong>refore based on results from 33 laboratories.2.2. Scor<strong>in</strong>g procedureEach <strong>laboratory</strong> could choose to have more thanone person score <strong>the</strong> same set <strong>of</strong> slides, but a separatedata sheet had to be generated for each scorer. Eachscorer scored <strong>the</strong> full set <strong>of</strong> six slides (pre-sta<strong>in</strong>ed <strong>and</strong>those sta<strong>in</strong>ed <strong>in</strong> <strong>the</strong>ir <strong>laboratory</strong>). Each scorer obta<strong>in</strong>edseparate scores for <strong>the</strong> cells <strong>in</strong> <strong>the</strong> spot closest to <strong>the</strong>label on <strong>the</strong> slide (spot a) <strong>and</strong> <strong>the</strong> cells <strong>in</strong> <strong>the</strong> spotfar<strong>the</strong>st from <strong>the</strong> label (spot b) (a total <strong>of</strong> 12 spots).It was requested that cells <strong>in</strong> spot a <strong>and</strong> spot b bescored on separate days to enable an analysis <strong>of</strong> <strong>the</strong>day to day <strong>variation</strong> <strong>in</strong> scor<strong>in</strong>g <strong>and</strong> a derivation <strong>of</strong><strong>the</strong> coefficient <strong>of</strong> <strong>variation</strong> for duplicate scores by onescorer. Information about <strong>the</strong> <strong>in</strong>dividual experience <strong>of</strong>scorers <strong>in</strong>volved <strong>in</strong> <strong>the</strong> study was collected <strong>in</strong> terms <strong>of</strong>years <strong>of</strong> scor<strong>in</strong>g <strong>and</strong> number <strong>of</strong> slides scored per year.This allowed <strong>the</strong> calculation <strong>of</strong> a new variable, i.e.number <strong>of</strong> slides scored <strong>in</strong> <strong>the</strong>ir lifetime, which wasused <strong>in</strong> <strong>the</strong> follow<strong>in</strong>g statistical analyses to measure<strong>the</strong> <strong>in</strong>fluence <strong>of</strong> a scorer’s past experience.For each spot <strong>of</strong> cells, <strong>the</strong> number <strong>of</strong> mononucleated(MONO) cells, b<strong>in</strong>ucleated (BN) cells, <strong>and</strong>mult<strong>in</strong>ucleated (MULT) cells <strong>in</strong> 500 viable cells werescored to determ<strong>in</strong>e <strong>the</strong> nuclear division <strong>in</strong>dex (NDI),as previously described [3,18]. It is important to notethat participants were <strong>in</strong>structed not to score necroticor apoptotic cells when determ<strong>in</strong><strong>in</strong>g <strong>the</strong> proportion<strong>of</strong> MONO, BN <strong>and</strong> MULT cells. They were alsonot required to dist<strong>in</strong>guish between tri-nucleated <strong>and</strong>quadri-nucleated cells when scor<strong>in</strong>g mult<strong>in</strong>ucleatedcells because <strong>of</strong>ten it is hard to dist<strong>in</strong>guish between <strong>the</strong>two <strong>and</strong> this adds an unnecessary burden to <strong>the</strong> assay.For each spot <strong>of</strong> cells participants scored <strong>the</strong> follow<strong>in</strong>gto determ<strong>in</strong>e chromosome damage:1. The number <strong>of</strong> cells <strong>in</strong> 1000 BN cells conta<strong>in</strong><strong>in</strong>gone or more <strong>micronuclei</strong>.2. The total number <strong>of</strong> <strong>micronuclei</strong> <strong>in</strong> 1000 BNcells.3. The number <strong>of</strong> cells <strong>in</strong> 1000 BN cells conta<strong>in</strong><strong>in</strong>gone or more nucleoplasmic bridges (NPBs).A BN cell that has both a micronucleus <strong>and</strong> an NPBwas scored separately as a BN cell with a micronucleus<strong>and</strong> as a BN cell with a NPB.Slides were exam<strong>in</strong>ed at 1000× magnificationfor both light or fluorescence microscopy. Participantswere requested not to score cells that <strong>the</strong>ywere unable to classify accord<strong>in</strong>g to <strong>the</strong> criteriaprovided. They were asked to simply skip any cellthat was unclassifiable <strong>and</strong> move on to <strong>the</strong> next.Similarly, MN <strong>and</strong> NPB where to be scored onlyif <strong>the</strong> scorer was confident that <strong>the</strong>y met <strong>the</strong> givencriteria.2.3. Scor<strong>in</strong>g criteriaA st<strong>and</strong>ard set <strong>of</strong> detailed scor<strong>in</strong>g criteria, toge<strong>the</strong>rwith a comprehensive set <strong>of</strong> photomicrographs exemplify<strong>in</strong>g<strong>the</strong> various types <strong>of</strong> cells, <strong>micronuclei</strong>, <strong>and</strong>nucleoplasmic bridges, were provided to each <strong>laboratory</strong>.These scor<strong>in</strong>g criteria <strong>and</strong> <strong>the</strong> set <strong>of</strong> photomicrographsare described <strong>in</strong> <strong>the</strong> accompany<strong>in</strong>g paper[17] <strong>and</strong> were based to a large extent on previouslypublished procedures which however, did not providephotomicrographs [3,18].2.4. Statistical methodsA Poisson regression analysis [19] was performedto estimate <strong>the</strong> contribution <strong>of</strong> each covariate to <strong>the</strong>total variance. Accord<strong>in</strong>g to <strong>the</strong> study design, <strong>the</strong> datahave been considered as clusters which are hierarchicallynested as follows: <strong>laboratory</strong>, scorer, sta<strong>in</strong><strong>in</strong>g,irradiation, <strong>and</strong> spot. S<strong>in</strong>ce observations with<strong>in</strong> acluster are (generally) more similar than observationsbetween clusters, this lack <strong>of</strong> <strong>in</strong>dependence betweendata will lead to overdispersion, i.e. data showedmore residual variability than expected accord<strong>in</strong>g toan ord<strong>in</strong>ary regression model [19,20]. Ignor<strong>in</strong>g <strong>the</strong>clustered nature <strong>of</strong> data generally causes an underestimation<strong>of</strong> <strong>the</strong> variability <strong>of</strong> regression coefficients.A useful methodology that takes <strong>the</strong> hierarchicalstructure <strong>of</strong> <strong>the</strong> data <strong>in</strong>to account is <strong>the</strong> multilevel approach[21]. The simplest multilevel model conta<strong>in</strong>s a
M. Fenech et al. / Mutation Research 534 (2003) 45–64 51two-level structure, i.e. <strong>in</strong>dividuals (first level) with<strong>in</strong>groups (second level). The model isy ij = α + αx ij + ω j + α ijwhere an observation y ij referr<strong>in</strong>g to <strong>the</strong> ith <strong>in</strong>dividual<strong>in</strong> <strong>the</strong> jth group is modeled by <strong>the</strong> follow<strong>in</strong>gparameters: α, <strong>the</strong> overall mean; β, <strong>the</strong> regressioncoefficient <strong>of</strong> <strong>the</strong> predictor variable x ij ; ω j , <strong>the</strong> departure<strong>of</strong> <strong>the</strong> jth group mean from <strong>the</strong> overall mean;<strong>and</strong> ε ij , <strong>the</strong> residual. In this model, α <strong>and</strong> β represent<strong>the</strong> fixed part <strong>of</strong> <strong>the</strong> model while ω j <strong>and</strong> ε j are <strong>the</strong>r<strong>and</strong>om part. In particular, we assume that ω j followsa normal distribution with zero mean <strong>and</strong> varianceσw 2 . The multilevel approach consists <strong>in</strong> estimat<strong>in</strong>gα, β <strong>and</strong> σw 2 . This last parameter is <strong>the</strong> <strong>in</strong>dex <strong>of</strong>heterogeneity among groups. This is a parsimoniousmethod to quantify <strong>the</strong> differences among groupsavoid<strong>in</strong>g <strong>the</strong> estimate <strong>of</strong> a regression coefficient foreach group. It is possible to evaluate <strong>the</strong> relative variancecomponent for each level <strong>of</strong> cluster<strong>in</strong>g, i.e. <strong>the</strong>with<strong>in</strong>-<strong>laboratory</strong> variability <strong>in</strong> <strong>the</strong> estimate <strong>of</strong> <strong>the</strong> parameter,<strong>the</strong> <strong>in</strong>tra-<strong>laboratory</strong>-<strong><strong>in</strong>ter</strong>-scorer variability,<strong>the</strong> proportion <strong>of</strong> variance due to sta<strong>in</strong><strong>in</strong>g, <strong>and</strong> <strong>the</strong>heterogeneity between spots. S<strong>in</strong>ce our observationsare counts, we can fit a Poisson multilevel model toour data. All analyses were carried out with GLIM[22] <strong>and</strong> MLwiN [23] statistical s<strong>of</strong>tware.3. ResultsAll participat<strong>in</strong>g labs completed <strong>the</strong> scor<strong>in</strong>g <strong>of</strong> <strong>the</strong>pre-sta<strong>in</strong>ed slides. Only 2 labs (#1 <strong>and</strong> 22) were unableto adequately sta<strong>in</strong> <strong>the</strong> unsta<strong>in</strong>ed slides provided <strong>and</strong>were <strong>the</strong>refore unable to provide data for this part <strong>of</strong><strong>the</strong> study.3.1. Descriptive statisticsA summary <strong>of</strong> results is reported <strong>in</strong> Table 2. Measures<strong>of</strong> central tendency (median <strong>and</strong> mean) <strong>and</strong>variability (S.D. <strong>and</strong> range) by dose <strong>of</strong> radiation arereported for each endpo<strong>in</strong>t studied. Data from slidessta<strong>in</strong>ed by <strong>the</strong> referent <strong>laboratory</strong> (pre-sta<strong>in</strong>ed) <strong>and</strong>data from those sta<strong>in</strong>ed by <strong>the</strong> preferred method <strong>of</strong>participat<strong>in</strong>g laboratories (lab-sta<strong>in</strong>ed) were analyzedseparately. An evident <strong>and</strong> significant positive association(P < 0.01) with <strong>the</strong> level <strong>of</strong> irradiationis present for all <strong>the</strong> genotoxicity end-po<strong>in</strong>ts evaluatedapart from NDI, which decreased with dose(P < 0.01). The mean frequency <strong>of</strong> MN per 1000b<strong>in</strong>ucleated cells at 1 Gy is 8–11% higher that <strong>of</strong> micronucleatedcells (MNed) at <strong>the</strong> background level.This difference is more pronounced at higher doses<strong>of</strong> irradiation, up to 34% at 2 Gy. The frequency <strong>of</strong>MN scored on pre-sta<strong>in</strong>ed slides was generally higherTable 2Descriptive statistics concern<strong>in</strong>g endpo<strong>in</strong>ts evaluated <strong>in</strong> <strong>the</strong> st<strong>and</strong>ardization studyEnd-po<strong>in</strong>t a Dose Gray Pre-sta<strong>in</strong>ed slides (51 scorers) Lab-sta<strong>in</strong>ed slides (44 scorers)Median Mean S.D. M<strong>in</strong>–max Median Mean S.D. M<strong>in</strong>–maxMNed 0 8.0 8.8 4.3 2–28 7.0 7.4 3.3 1–191 116.5 118.4 29.8 59–217 95.0 98.8 33.5 35–2002 305.9 302.2 69.9 165–563 257.5 255.4 77.6 63–564MN 0 9.0 9.8 4.9 2–28 7.6 8.0 3.7 1–231 138.5 140.8 37.1 61–265 105.0 115.3 39.5 36–2302 401.4 405.5 104.8 191–753 345.5 334.2 109.6 78–763NPB 0 2.0 5.2 13.5 0–125 2.0 5.0 15.0 0–1211 18.0 22.3 18.1 3–124 16.8 19.6 16.0 0–932 45.1 51.8 36.7 9–300 36.2 40.8 29.0 1–191NDI 0 1.95 1.94 0.18 1.56–2.47 1.92 1.92 0.19 1.49–2.391 1.89 1.88 0.19 1.44–2.37 1.86 1.84 0.19 1.43–2.212 1.77 1.75 0.15 1.45–2.19 1.73 1.74 0.15 1.39–2.12a MNed, micronucleated cells per 1000 BN cells; MN, <strong>micronuclei</strong> per 1000 BN cells; NPB, nucleoplasmic bridges per 1000 BN cells;NDI, nuclear division <strong>in</strong>dex.
52 M. Fenech et al. / Mutation Research 534 (2003) 45–64than those <strong>of</strong> lab-sta<strong>in</strong>ed slides, with a difference <strong>in</strong>mean values <strong>of</strong> 14% (P
M. Fenech et al. / Mutation Research 534 (2003) 45–64 53Fig. 2. (A) Laboratory MNed cell frequency scores (y-axis) for pre-sta<strong>in</strong>ed slides from untreated cultures; (B) Laboratory MNed cellfrequency scores (y-axis) for lab-sta<strong>in</strong>ed slides from control cultures; (C) Laboratory MNed cell frequency scores (y-axis) for pre-sta<strong>in</strong>edslides from cultures exposed to 1 Gy; (D) Laboratory MNed cell frequency scores (y-axis) for lab-sta<strong>in</strong>ed slides from cultures exposed to1 Gy; (E) Laboratory MNed cell frequency scores (y-axis) for pre-sta<strong>in</strong>ed slides from cultures exposed to 2 Gy; (F) Laboratory MNed cellfrequency scores (y-axis) for lab-sta<strong>in</strong>ed slides from cultures exposed to 2 Gy. The solid circles <strong>in</strong>dicate <strong>the</strong> median <strong>of</strong> <strong>the</strong> results obta<strong>in</strong>edby each <strong>laboratory</strong> that is identified by <strong>the</strong> number on <strong>the</strong> x-axis. The open circles <strong>in</strong>dicate <strong>the</strong> results <strong>of</strong> <strong>in</strong>dividual scorers <strong>in</strong> laboratoriesthat had more than one scorer complet<strong>in</strong>g <strong>the</strong> exercise. The solid l<strong>in</strong>e represents <strong>the</strong> overall median <strong>and</strong> <strong>the</strong> broken l<strong>in</strong>es represent <strong>the</strong>25th <strong>and</strong> 75th percentiles.
54 M. Fenech et al. / Mutation Research 534 (2003) 45–64Fig. 2. (Cont<strong>in</strong>ued ).
M. Fenech et al. / Mutation Research 534 (2003) 45–64 55Fig. 2. (Cont<strong>in</strong>ued ).
56 M. Fenech et al. / Mutation Research 534 (2003) 45–64Table 3The ratio <strong>of</strong> <strong>the</strong> median value <strong>of</strong> MNed cell frequency for 1 <strong>and</strong>2 Gy cultures vs. <strong>the</strong> control culture by number <strong>of</strong> slides scoredlifetimeSlides scoredlifetimeScorers (slides)Median ratio0 Gy 1 Gy 2 Gy500 21 (252) 1.24 17.71 44.70a Reference level.value <strong>of</strong> MNed cell frequency for 1 <strong>and</strong> 2 Gy culturesversus <strong>the</strong> control culture clearly reflects <strong>the</strong> number<strong>of</strong> slides scored previously, experienced scorers had abetter capability to discrim<strong>in</strong>ate <strong>the</strong> effect <strong>of</strong> irradiation.Those laboratories with two scorers (n = 10)showed overall <strong><strong>in</strong>ter</strong>-scorer differences below 25%,with <strong>the</strong> most homogeneous scor<strong>in</strong>g <strong>in</strong> laboratories16 <strong>and</strong> 17. Laboratories with three or more scorers(n = 4) obviously produce more heterogeneity. Auseful <strong>and</strong> straightforward measure to express <strong>the</strong> <strong><strong>in</strong>ter</strong>nalconsistency <strong>of</strong> a scorer is <strong>the</strong> CV obta<strong>in</strong>ed from<strong>the</strong> discrepancy between spot a <strong>and</strong> spot b scores. Thisstatistic, which is based on <strong>the</strong> ratio <strong>of</strong> <strong>the</strong> st<strong>and</strong>arddeviation to <strong>the</strong> mean, simply describes <strong>the</strong> variabilityas a proportion <strong>of</strong> <strong>the</strong> mean. This value turned outto be strictly dependent on <strong>the</strong> radiation dose, withan <strong>in</strong>creas<strong>in</strong>g precision <strong>of</strong> <strong>the</strong> estimates with <strong>in</strong>creas<strong>in</strong>gdose <strong>of</strong> exposure. Fig. 3 shows this dependency,reveal<strong>in</strong>g a real difference between irradiated cells,which have a median <strong>in</strong>tra-scorer CV’s for MNed <strong>of</strong>14 <strong>and</strong> 11% at 1 <strong>and</strong> 2 Gy, respectively, versus <strong>the</strong>non-treated cells with a CV <strong>of</strong> 29%. A greater heterogeneityfor <strong>the</strong> set <strong>of</strong> untreated slides is evident<strong>in</strong> Fig. 3, although some laboratories, e.g. <strong>laboratory</strong>#29, also had a great variability <strong>in</strong> irradiated cells.These figures are consistent with those for MN. Incontrast <strong>the</strong> scorer CV for NPB are much higher, withmedian scorer values <strong>of</strong> 82, 26, <strong>and</strong> 23% at 0, 1, <strong>and</strong>2 Gy, respectively.3.3. Measures <strong>of</strong> effectIn order to evaluate whe<strong>the</strong>r <strong>the</strong> MNed biomarkeris concordant <strong>in</strong> evaluat<strong>in</strong>g <strong>the</strong> effect <strong>of</strong> radiation,despite <strong>the</strong> heterogeneity found among absolute measures<strong>of</strong> MNed frequency, <strong>the</strong> median MNed frequenciesat 2 <strong>and</strong> 1 Gy were compared with <strong>the</strong> frequencies<strong>in</strong> <strong>the</strong> unexposed cells obta<strong>in</strong>ed from each <strong>laboratory</strong>.This exercise showed that irradiated cells experienceda higher frequency <strong>of</strong> MNed cells <strong>in</strong> pre- <strong>and</strong>lab-sta<strong>in</strong>ed slides, <strong>in</strong> all laboratories, with a 14.3-foldhigher frequency <strong>of</strong> MNed cells <strong>in</strong> cultures irradiatedwith 1 Gy, <strong>and</strong> an <strong>in</strong>crease <strong>of</strong> 37.3-fold <strong>in</strong> those irradiatedwith 2 Gy. This pattern is overlapp<strong>in</strong>g <strong>in</strong> pre<strong>and</strong>lab-sta<strong>in</strong>ed slides for MNed cells <strong>and</strong> for MN.The distribution <strong>of</strong> s<strong>in</strong>gle laboratories around <strong>the</strong>sevalues is exemplified <strong>in</strong> Fig. 4. This figure refers to<strong>the</strong> median ratio values <strong>of</strong> MNed cell frequency forcells exposed to 1 or 2 Gy (relative to <strong>the</strong> control culture)based on all <strong>the</strong> slides scored (pre-sta<strong>in</strong>ed <strong>and</strong>lab-sta<strong>in</strong>ed) by each <strong>laboratory</strong>. All laboratories foundan <strong>in</strong>creas<strong>in</strong>g MNed cell frequency by dose, althoughto different extents. The effect for 1 Gy ranged from7.4- to 29.2-fold <strong>in</strong>crease, <strong>and</strong> <strong>the</strong> 50% most frequentestimates were between 10.7 <strong>and</strong> 16.6, whereas expos<strong>in</strong>gcells to 2 Gy caused a fold-<strong>in</strong>crease <strong>of</strong> MNedcells rang<strong>in</strong>g from 16.0 to 60.7, with <strong>the</strong> 50% mostfrequent estimates between 28.3 <strong>and</strong> 46.4.The evaluation <strong>of</strong> NPB frequency <strong>in</strong> lab-sta<strong>in</strong>edslides describes non-homogeneously <strong>the</strong> effect <strong>of</strong> irradiation.In this set <strong>of</strong> slides, three laboraratoriesscored more NPB <strong>in</strong> <strong>the</strong> 1 Gy slides than <strong>in</strong> <strong>the</strong> 2 Gyslides, <strong>and</strong> two laboratories scored <strong>the</strong> same number<strong>of</strong> NPB at <strong>the</strong> two doses. This was not <strong>the</strong> case with<strong>the</strong> pre-sta<strong>in</strong>ed slides, where <strong>the</strong> differential effect <strong>of</strong>two doses was always correctly recognized. In general,however, <strong>the</strong>re was a good correlation between MNed<strong>and</strong> NPB frequency <strong>in</strong> both pre- (0.63; P
M. Fenech et al. / Mutation Research 534 (2003) 45–64 57Fig. 3. <strong>Intra</strong>-scorer coefficient <strong>of</strong> <strong>variation</strong> for spot a <strong>and</strong> spot b. MNed, MN, <strong>and</strong> NPB frequency results for slides from unexposed, 1<strong>and</strong> 2 Gy cultures. The results shown as box <strong>and</strong> whisker plots represent <strong>the</strong> median, <strong>the</strong> 25th <strong>and</strong> 75th percentile, <strong>and</strong> range for data <strong>of</strong>all scorers (N = 51).3.5. Proportion <strong>of</strong> expla<strong>in</strong>ed variabilityOne <strong>of</strong> <strong>the</strong> most important aspects <strong>in</strong> <strong>the</strong> st<strong>and</strong>ardization<strong>of</strong> an assay is <strong>the</strong> quantitative def<strong>in</strong>ition <strong>of</strong>sources <strong>of</strong> variability. To provide an evaluation <strong>of</strong> <strong>the</strong>contribution <strong>of</strong> various parameters to <strong>the</strong> general variability<strong>of</strong> data, a Poisson regression model that <strong>in</strong>cluded<strong>the</strong> ma<strong>in</strong> effects <strong>of</strong> all studied variables wasfitted to <strong>the</strong> whole database. A backward extraction <strong>of</strong>variables from this model allowed an estimation <strong>of</strong> <strong>the</strong>contribution <strong>of</strong> each variable <strong>in</strong> terms <strong>of</strong> variability.The results <strong>of</strong> this procedure are reported <strong>in</strong> Figs. 5<strong>and</strong> 6. The percentages reflect <strong>the</strong> <strong>in</strong>dependent contribution<strong>of</strong> each variable, but because <strong>the</strong>se parametersare not orthogonal (i.e. not <strong>in</strong>dependent), a portion <strong>of</strong>variability is expla<strong>in</strong>ed by <strong>the</strong> correlation <strong>of</strong> two ormore variables <strong>in</strong> <strong>the</strong> model. This part has been describedas covariance.From Fig. 5, it is evident that <strong>the</strong>re is a very lowlevel <strong>of</strong> unexpla<strong>in</strong>ed variance for MNed frequency, i.e.3.1%, partly due to <strong>the</strong> experimental design, whichtook <strong>the</strong> ma<strong>in</strong> explanatory variables <strong>in</strong>to consideration,
58 M. Fenech et al. / Mutation Research 534 (2003) 45–64Fig. 4. Open <strong>and</strong> solid circles represent <strong>the</strong> median ratio values for cells exposed to 1 <strong>and</strong> 2 Gy, respectively, vs. <strong>the</strong> control culture shownfor each <strong>laboratory</strong>, based on all <strong>the</strong> slides (pre- <strong>and</strong> lab-sta<strong>in</strong>ed) scored. The horizontal l<strong>in</strong>es represent <strong>the</strong> mean ratio values for 1 <strong>and</strong>2 Gy. The numbers on <strong>the</strong> x-axis are <strong>the</strong> <strong>laboratory</strong> code number. Note: <strong>the</strong> vertical l<strong>in</strong>es between <strong>the</strong> open <strong>and</strong> closed circles are <strong>of</strong> noma<strong>the</strong>matical significance <strong>and</strong> are simply used to help dist<strong>in</strong>guish results <strong>of</strong> a s<strong>in</strong>gle <strong>laboratory</strong>.but also to <strong>the</strong> good agreement among participat<strong>in</strong>glaboratories. The ma<strong>in</strong> response variable, i.e. <strong>the</strong> dose<strong>of</strong> irradiation, is responsible for almost two-thirds <strong>of</strong><strong>the</strong> expla<strong>in</strong>ed variability. This is an important observationsupport<strong>in</strong>g <strong>the</strong> sensitivity <strong>of</strong> <strong>the</strong> test for <strong>the</strong> monitor<strong>in</strong>g<strong>of</strong> this k<strong>in</strong>d <strong>of</strong> exposure. The contribution <strong>of</strong><strong>laboratory</strong> to <strong>the</strong> variance is quite small, <strong>and</strong> this is notsurpris<strong>in</strong>g given that <strong>the</strong> <strong>in</strong>dividual contributions <strong>of</strong>o<strong>the</strong>r variables responsible for <strong>the</strong> differences amonglaboratories, such as NDI, scorer, spot, <strong>and</strong> sta<strong>in</strong><strong>in</strong>gmethod, are <strong>in</strong>dependently considered. The rema<strong>in</strong><strong>in</strong>gvariance is due to external <strong>and</strong> unknown factors. Morethan a quarter <strong>of</strong> <strong>the</strong> variability is due to <strong>the</strong> covariancebetween variables.A different pattern is evident for NPB, where <strong>the</strong>proportion <strong>of</strong> unexpla<strong>in</strong>ed variance is over 20%. Thecontribution <strong>of</strong> <strong>the</strong> dose is only one-third, <strong>and</strong> <strong>the</strong>28.4% is attributable to unknown <strong><strong>in</strong>ter</strong>-<strong>laboratory</strong> factors(Fig. 6). These results confirm <strong>the</strong> need <strong>of</strong> improv<strong>in</strong>gtra<strong>in</strong><strong>in</strong>g <strong>and</strong> scor<strong>in</strong>g procedures for this endpo<strong>in</strong>t.The role <strong>of</strong> different methods used for <strong>laboratory</strong>sta<strong>in</strong><strong>in</strong>g <strong>of</strong> <strong>the</strong> slides has been evaluated by simplycompar<strong>in</strong>g <strong>the</strong> fluorescent versus non-fluorescentmethods. A 15% lower frequency <strong>of</strong> MNed cells(95% CI; 6–23%) was found <strong>in</strong> <strong>the</strong> slides sta<strong>in</strong>edwith fluorescent methods. For <strong>the</strong> three laboratoriesthat chose fluorescence microscopy only 27% <strong>of</strong> <strong>the</strong><strong>laboratory</strong> mean scores were with<strong>in</strong> <strong>the</strong> 25th <strong>and</strong> 75th
M. Fenech et al. / Mutation Research 534 (2003) 45–64 59Fig. 5. Proportion <strong>of</strong> variance expla<strong>in</strong>ed by variables <strong>in</strong> <strong>the</strong> model describ<strong>in</strong>g MNed frequency.percentile compared to 56% for <strong>the</strong> <strong>laboratory</strong> meanscores from laboratories that chose light microscopymethods for scor<strong>in</strong>g.3.6. Measures <strong>of</strong> errorThe design <strong>of</strong> this experiment has produced a typicalhierarchical structure <strong>of</strong> data, with each level <strong>of</strong>aggregation nested with<strong>in</strong> <strong>the</strong> follow<strong>in</strong>g level. In each<strong>laboratory</strong>, scorers read slides sta<strong>in</strong>ed by differentmethods, slides conta<strong>in</strong>ed cells treated at differentdoses <strong>of</strong> radiation, <strong>and</strong> each slide had two cell samples,each on a separate spot. At each level <strong>of</strong> cluster<strong>in</strong>git is possible to estimate variance components,e.g. if we consider <strong><strong>in</strong>ter</strong>-<strong>laboratory</strong> variability, it ispossible to estimate how much <strong>of</strong> this variability isdue to <strong>the</strong> scorer, to slide treatment, to <strong>the</strong> irradiationdose, <strong>and</strong> to sampl<strong>in</strong>g error between <strong>the</strong> two spots,<strong>and</strong> how much is due to external factors. This analysishas been performed <strong>in</strong> a subset <strong>of</strong> <strong>the</strong> whole database,i.e. <strong>in</strong> those laboratories with more than one scorer,to permit <strong>the</strong> evaluation <strong>of</strong> <strong>the</strong> variability due to thisparameter. Variance components estimates have beencalculated us<strong>in</strong>g r<strong>and</strong>om effects models, <strong>and</strong> <strong>the</strong> result<strong>of</strong> this analysis is shown <strong>in</strong> Table 4. If we look at <strong>the</strong>MNed assay we see that all components <strong>in</strong>vestigated,exclud<strong>in</strong>g <strong>the</strong> scorer, showed a remarkable degree <strong>of</strong>heterogeneity. The presence <strong>of</strong> this rema<strong>in</strong><strong>in</strong>g uncerta<strong>in</strong>ty,despite <strong>the</strong> <strong>in</strong>clusion <strong>in</strong> <strong>the</strong> model <strong>of</strong> ma<strong>in</strong> potentialpredictors, means that <strong>the</strong>re are o<strong>the</strong>r variablesresponsible for <strong><strong>in</strong>ter</strong>-<strong>laboratory</strong> differences that havenot been considered <strong>in</strong> our model. On <strong>the</strong> o<strong>the</strong>r h<strong>and</strong>,if we look at <strong>the</strong> variable describ<strong>in</strong>g <strong>the</strong> scorer wesee that this parameter is not significant. The reasonis that all variability due to <strong>the</strong> scorer is completelyexpla<strong>in</strong>ed by differences <strong>in</strong> sta<strong>in</strong><strong>in</strong>g methods, dose,
60 M. Fenech et al. / Mutation Research 534 (2003) 45–64Fig. 6. Proportion <strong>of</strong> variance expla<strong>in</strong>ed by variables <strong>in</strong> <strong>the</strong> model describ<strong>in</strong>g NPB frequency.Table 4Fixed <strong>and</strong> r<strong>and</strong>om coefficients <strong>of</strong> <strong>the</strong> multilevel hierarchical model for <strong>the</strong> three end-po<strong>in</strong>ts consideredModel MNed MN NPBFixed partLog median ratio (S.E.)Intercept −4.766 (0.181) −4.578 (0.199) −3.641 (0.891)Dose 1 2.594 (0.044) a 2.641 (0.044) a 1.220 (0.183) aDose 2 3.599 (0.045) a 3.721 (0.046) a 1.921 (0.195) aNDI −0.053 (0.089) −0.093 (0.098) −0.683 (0.434)R<strong>and</strong>om partVariance component (S.E.)Laboratory 0.023 (0.011) a 0.026 (0.014) 0.982 (0.441) aScorer 0.001 (0.006) 0.0001 (0.007) 0.0001 (0.0001)Sta<strong>in</strong> 0.016 (0.007) a 0.019 (0.009) a 0.210 (0.117)Dose 0.012 (0.004) a 0.014 (0.004) a 0.663 (0.121) aSpot 0.008 (0.002) a 0.014 (0.003) a 0.365 (0.047) aData <strong>in</strong>clude 13 laboratories (329 slides) with two or more scorers; S.E.: st<strong>and</strong>ard error.a Coefficient/S.E. ratio > 2.
M. Fenech et al. / Mutation Research 534 (2003) 45–64 61Table 595% frequency <strong><strong>in</strong>ter</strong>vals compatible with variance componentsestimated by <strong>the</strong> multilevel hierarchical model0 Gy 1 Gy 2 GyMNed 5.1–12.6 68.9–169.6 176.4–434.8MN 5.3–14.4 76.8–208.6 221.6–602.1NPB 1.4–12.4 5.8–51.0 12.9–113.0Note: <strong>the</strong> results refer to frequency per 1000 BN cells.<strong>and</strong> spot. Once <strong>the</strong>se variables are considered, scorersfrom <strong>the</strong> same <strong>laboratory</strong> provide homogeneous read<strong>in</strong>gs.This pattern is similar for all <strong>the</strong> three endpo<strong>in</strong>ts.The first part <strong>of</strong> Table 4 reports <strong>the</strong> log medianratio <strong>of</strong> fixed parameters represent<strong>in</strong>g <strong>the</strong> mean effect<strong>of</strong> dose <strong>and</strong> NDI. As would be expected, radiationdose is <strong>the</strong> strongest predictor <strong>of</strong> MNed frequency <strong>and</strong>despite its <strong>in</strong>clusion <strong>in</strong> <strong>the</strong> fixed part <strong>of</strong> <strong>the</strong> modelthis variable generates fur<strong>the</strong>r heterogeneity, as shownby <strong>the</strong> r<strong>and</strong>om term. The <strong>in</strong>formation about variancecomponents can be used to estimate <strong>the</strong> extent <strong>of</strong> <strong>the</strong>error due to <strong>the</strong> known sources <strong>of</strong> variability.These results can be used to estimate ranges <strong>of</strong> MNfrequency that are compatible with r<strong>and</strong>om variabilitydue to major confounders. Us<strong>in</strong>g this approachwe found that when <strong>the</strong> variability due to <strong>laboratory</strong>,sta<strong>in</strong><strong>in</strong>g method, <strong>and</strong> spot, are considered, <strong>the</strong> basel<strong>in</strong>efrequency <strong>of</strong> MNed cells is between 5.1 <strong>and</strong> 12.6MNed per 1000 BN cells. Similar estimates for allendpo<strong>in</strong>ts at different doses <strong>of</strong> irradiation are given<strong>in</strong> Table 5.4. DiscussionThe practical use <strong>of</strong> a biomarker <strong>of</strong> DNA damage<strong>in</strong> population monitor<strong>in</strong>g is limited by (a) itsreproducibility among laboratories when differentlaboratories attempt to compare <strong>the</strong>ir results obta<strong>in</strong>edfor <strong>the</strong>ir local populations, <strong>and</strong> (b) its reproducibilitywith<strong>in</strong> <strong>the</strong> same <strong>laboratory</strong> when a population (whichmay <strong>in</strong>clude <strong>the</strong> same subjects with<strong>in</strong> a population)is be<strong>in</strong>g studied repeatedly <strong>and</strong> longitud<strong>in</strong>ally over anextended time-frame (e.g. years). The identification<strong>of</strong> factors affect<strong>in</strong>g reproducibility <strong>in</strong> <strong>the</strong> CBMN assay,<strong>and</strong> a measure <strong>of</strong> <strong>the</strong> reproducibility, is essentialfor <strong>the</strong> determ<strong>in</strong>ation <strong>of</strong> absolute MN frequency, accuracy<strong>in</strong> biological dosimetry <strong>of</strong> genotoxic exposure,<strong>and</strong> for <strong>the</strong> establishment <strong>of</strong> “normal” or “acceptable”base-l<strong>in</strong>e rates <strong>of</strong> chromosomal damage.In spite <strong>of</strong> be<strong>in</strong>g provided slides prepared <strong>in</strong> identicalmanner from samples from <strong>the</strong> same cultures <strong>the</strong>rewas still a large extent <strong>of</strong> <strong>variation</strong> among <strong>laboratory</strong>scores for MN frequency. It is plausible that some <strong>of</strong>this <strong>variation</strong> could have been due to real differencesbetween <strong>the</strong> cells <strong>in</strong> each sample. However, <strong>the</strong> factthat (a) each <strong>laboratory</strong> correctly ranked <strong>the</strong> slides accord<strong>in</strong>gto radiation dose, <strong>and</strong> (b) those laboratoriesthat scored low or high values for one dose also did s<strong>of</strong>or <strong>the</strong> o<strong>the</strong>r doses, would tend to suggest that sampl<strong>in</strong>gdifferences are unlikely to be <strong>the</strong> ma<strong>in</strong> cause <strong>of</strong><strong>the</strong> variability. The o<strong>the</strong>r possibility is that <strong>the</strong> <strong><strong>in</strong>ter</strong>pretation<strong>of</strong> <strong>the</strong> scor<strong>in</strong>g criteria provided, detailed as<strong>the</strong>y were, ultimately depends on <strong>the</strong> subjective evaluation<strong>of</strong> each scorer <strong>and</strong> <strong>laboratory</strong>, so that some laboratoriesmay have been more cautious than o<strong>the</strong>rs withregard to accept<strong>in</strong>g a b<strong>in</strong>ucleated cell with a micronucleus.The o<strong>the</strong>r practical limitation <strong>of</strong> identify<strong>in</strong>g <strong>and</strong>visualis<strong>in</strong>g cells is <strong>the</strong> quality <strong>of</strong> <strong>the</strong> optics <strong>of</strong> <strong>the</strong> microscopeused; we have not measured this differencebetween laboratories, although it is a potential source<strong>of</strong> <strong>variation</strong> that should be considered <strong>in</strong> future st<strong>and</strong>ardizationstudies.We have observed considerable <strong>variation</strong> <strong>in</strong> <strong>the</strong>results <strong>of</strong> different scorers even with<strong>in</strong> experiencedlaboratories. Assum<strong>in</strong>g that scorers with<strong>in</strong> a specific<strong>laboratory</strong> were us<strong>in</strong>g similar, or <strong>the</strong> same, microscopesit is still possible that <strong>the</strong>re is <strong>variation</strong> <strong>in</strong> an<strong>in</strong>dividual’s capacity to correctly identify a micronucleusor a nucleoplasmic bridge. Such discrim<strong>in</strong>ationwould depend on <strong>the</strong> filters used, <strong>the</strong> precise focus,<strong>and</strong> <strong>the</strong> visual capacity to clearly identify micronuclear<strong>and</strong> nuclear boundaries. An important role isplayed by scorer’s experience, as demonstrated byresults <strong>in</strong> Table 4, which show that as <strong>the</strong> number<strong>of</strong> events to be scored <strong>in</strong>creased with <strong>the</strong> <strong>in</strong>creas<strong>in</strong>gradiation dose, <strong>the</strong> ability to discrim<strong>in</strong>ate betweenexposed <strong>and</strong> control cells is more evident <strong>in</strong> thosescorers with more experience. The observation <strong>of</strong> important<strong><strong>in</strong>ter</strong>-scorer variability fits well with <strong>the</strong> conclusion<strong>of</strong> Brown et al. [24] who also studied sources<strong>of</strong> variability <strong>in</strong> <strong>the</strong> CBMN assay us<strong>in</strong>g repeatedscor<strong>in</strong>g <strong>of</strong> slides from one culture <strong>and</strong> compar<strong>in</strong>gscores <strong>of</strong> three different scorers. The analysis <strong>of</strong> <strong>the</strong>irdata showed a consistent performance <strong>of</strong> scorers onrepeat counts <strong>and</strong> consistent, significant large differ-
62 M. Fenech et al. / Mutation Research 534 (2003) 45–64ences <strong>in</strong> <strong>the</strong> results <strong>of</strong> different scorers. A measure<strong>of</strong> consistency <strong>of</strong> results from <strong>the</strong> same scorer is <strong>the</strong>coefficient <strong>of</strong> <strong>variation</strong> (CV). The results for base-l<strong>in</strong>eMN frequency CV for repeat counts by <strong>the</strong> samescorer values <strong>in</strong> this study (29%) are lower than thosereported by Radack et al. [25] (52%) who, however,based <strong>the</strong>ir estimates on repeat measures from 100BN cells <strong>in</strong>stead <strong>of</strong> 1000 BN cells.The extent <strong>of</strong> <strong>variation</strong> <strong>in</strong> <strong>the</strong> data for NPB wasmuch greater than <strong>the</strong> <strong>variation</strong> observed for MN, asis clearly shown by <strong>the</strong> data <strong>in</strong> Fig. 3 <strong>and</strong> comparison<strong>of</strong> data <strong>in</strong> Figs. 5 <strong>and</strong> 6. This result was not unexpectedgiven that only one <strong>laboratory</strong> was experienced<strong>in</strong> scor<strong>in</strong>g this biomarker with<strong>in</strong> <strong>the</strong> CBMN assay.Identification <strong>of</strong> NPB can be more difficult than identify<strong>in</strong>gMN because <strong>the</strong> thickness <strong>of</strong> an NPB <strong>of</strong>tencan be much smaller than <strong>the</strong> diameter <strong>of</strong> an MN. Inaddition, NPB can be difficult to identify when nuclei<strong>in</strong> a BN cell are close to each o<strong>the</strong>r. Never<strong>the</strong>less,<strong>the</strong> great majority <strong>of</strong> <strong>the</strong> laboratories (31 out <strong>of</strong> 33)correctly identified <strong>the</strong> rank <strong>of</strong> <strong>the</strong> radiation dose.The results <strong>in</strong> Table 4 clearly show that <strong>in</strong>tra<strong>laboratory</strong>variability is almost completely expla<strong>in</strong>edby <strong>the</strong> variables that we have <strong>in</strong>cluded <strong>in</strong><strong>the</strong> experiment—sta<strong>in</strong><strong>in</strong>g, dose <strong>and</strong> spot—<strong>and</strong> no<strong><strong>in</strong>ter</strong>-scorer variability rema<strong>in</strong>s once <strong>the</strong>se are controlled.In comparison, as regards <strong><strong>in</strong>ter</strong>-<strong>laboratory</strong>variability, additional <strong>laboratory</strong>-l<strong>in</strong>ked featuresshould be considered to fully underst<strong>and</strong> this aspect.This high (<strong>and</strong> significant) degree <strong>of</strong> heterogeneityamong laboratories is ma<strong>in</strong>ly based on <strong>the</strong> results <strong>of</strong> alimited number <strong>of</strong> laboratories, which scored greatlydifferent frequencies <strong>of</strong> events from <strong>the</strong> majority.The use <strong>of</strong> r<strong>and</strong>om-effect models, which provides abetter model<strong>in</strong>g <strong>of</strong> variance over <strong>the</strong> Poisson regressionanalysis, allowed <strong>the</strong> calculation <strong>of</strong> a range <strong>of</strong>‘reliable’ values for different endpo<strong>in</strong>ts <strong>and</strong> levels<strong>of</strong> irradiation (Table 4). This estimate can be usedas a reference for all laboratories when scor<strong>in</strong>g <strong>the</strong>endpo<strong>in</strong>ts described here.The results <strong>of</strong> this study raise important questionswith respect to overcom<strong>in</strong>g <strong>the</strong> <strong><strong>in</strong>ter</strong>-<strong>laboratory</strong> <strong>and</strong><strong><strong>in</strong>ter</strong>-scorer <strong>variation</strong>, <strong>and</strong> <strong>in</strong>dicate that even underclose to optimal conditions <strong>the</strong> calibration <strong>of</strong> scorers<strong>and</strong> laboratories rema<strong>in</strong>s an important requirement.This leads immediately to <strong>the</strong> important goal <strong>of</strong>achiev<strong>in</strong>g a reliable procedure for calibrat<strong>in</strong>g scorersso that data from different scorers <strong>and</strong> laboratoriescan be corrected to values that are reliably close to <strong>the</strong>absolute/actual score. This goal could be achieved byus<strong>in</strong>g a common set <strong>of</strong> slides or, more practically, aset <strong>of</strong> digitized images made available on <strong>the</strong> HUMNproject web site, toge<strong>the</strong>r with detailed scor<strong>in</strong>g <strong>in</strong>structions.This same tra<strong>in</strong><strong>in</strong>g module could be usedto tra<strong>in</strong> scorers to a st<strong>and</strong>ard method, <strong>the</strong>reby mak<strong>in</strong>gmore possible <strong>the</strong> achievement <strong>of</strong> comparable databetween laboratories. However, <strong>the</strong> use <strong>of</strong> digitizedimages does not take <strong>in</strong>to account <strong><strong>in</strong>ter</strong>-<strong>laboratory</strong><strong>variation</strong> <strong>in</strong> <strong>the</strong> quality <strong>of</strong> microscope optics, <strong>in</strong>dicat<strong>in</strong>gthat ultimately <strong>the</strong> use <strong>of</strong> a st<strong>and</strong>ard slide setshould also be used as a procedure for scorer calibration.Unravel<strong>in</strong>g <strong>the</strong> effect <strong>of</strong> scor<strong>in</strong>g criteria, <strong>the</strong><strong>in</strong>fluence <strong>of</strong> microscope optics, <strong>and</strong> visual ability <strong>of</strong><strong>the</strong> scorer, is a challeng<strong>in</strong>g scientific question <strong>in</strong> itself.5. ConclusionIn conclusion, this <strong><strong>in</strong>ter</strong>-<strong>laboratory</strong> comparison hasproved to be a fruitful exercise. It has verified thatwith respect to visual measurement <strong>of</strong> <strong>micronuclei</strong>we can confidently conclude that all laboratoriescorrectly classified <strong>the</strong> slides accord<strong>in</strong>g to radiationdose, <strong>and</strong> that dose <strong>of</strong> radiation accounted for most<strong>of</strong> <strong>the</strong> <strong>variation</strong> <strong>in</strong> <strong>the</strong> reported MNed cell frequency,while <strong>the</strong> importance <strong>of</strong> sta<strong>in</strong><strong>in</strong>g method was m<strong>in</strong>imal.This study has estimated <strong>the</strong> expected CV forduplicate scores by <strong>the</strong> same scorer as be<strong>in</strong>g 29% forcontrol cultures <strong>and</strong> 11–14% for cultures with MNfrequencies that are an order <strong>of</strong> magnitude greaterthan that observed <strong>in</strong> control cultures. The report<strong>in</strong>g<strong>of</strong> <strong>in</strong>tra-scorer CV values <strong>in</strong> <strong>the</strong> CBMN assay shouldbecome a st<strong>and</strong>ard requirement for all published studies,<strong>and</strong> large CV values should be carefully notedwhen evaluat<strong>in</strong>g <strong>the</strong> quality <strong>of</strong> <strong>the</strong> data. The o<strong>the</strong>r importantproduct <strong>of</strong> this exercise was <strong>the</strong> development<strong>of</strong> a comprehensive set <strong>of</strong> scor<strong>in</strong>g criteria for MN <strong>and</strong>NPB <strong>in</strong> human lymphocytes, as well as <strong>in</strong> o<strong>the</strong>r celltypes that can be scored <strong>in</strong> <strong>the</strong> CBMN assay, toge<strong>the</strong>rwith a comprehensive set <strong>of</strong> l<strong>in</strong>e diagrams <strong>and</strong> photomicrographsfor illustration, which are described <strong>in</strong><strong>the</strong> accompany<strong>in</strong>g paper [17]. F<strong>in</strong>ally it is evident that<strong>the</strong> use <strong>of</strong> “calibration” or “control” slides is essentialto reduce <strong>in</strong>tra- <strong>and</strong> <strong><strong>in</strong>ter</strong>-<strong>laboratory</strong> variability <strong>and</strong>to allow comparison <strong>of</strong> MN frequency data acrosslaboratories <strong>and</strong> populations.
M. Fenech et al. / Mutation Research 534 (2003) 45–64 63AcknowledgementsThe contribution <strong>of</strong> Ricardo Marcos, Ala<strong>in</strong> Botta,Hubert Thierens, Kirsti Bredholt, Elena Szabova <strong>and</strong>o<strong>the</strong>rs who have contributed to this study with <strong>the</strong>irwork is k<strong>in</strong>dly acknowledged. We are <strong>in</strong>debted to Pr<strong>of</strong>.Annibale Biggeri, Florence, Italy, for his assistancewith <strong>the</strong> use <strong>of</strong> multilevel models. This work wassupported by grants funded by <strong>the</strong> Associazione Italianaper la Ricerca sul Cancro (AIRC) <strong>and</strong> <strong>the</strong> EuropeanUnion 5th FP (QLRT-2000-00628). Interestedresearchers are <strong>in</strong>vited to collaborate <strong>and</strong> to get <strong>in</strong>touch with any member <strong>of</strong> <strong>the</strong> steer<strong>in</strong>g committee <strong>of</strong><strong>the</strong> HUMN project (M.F., S.B., W.P.C., N.H., M.K.V.,E.Z.). Fur<strong>the</strong>r <strong>in</strong>formation can be found on <strong>the</strong> website <strong>of</strong> <strong>the</strong> project: http://www.HUMN.orgReferences[1] M. Fenech, N. Holl<strong>and</strong>, W.P. Chang, E. Zeiger, S.Bonassi, The HUman MicroNucleus project—an <strong><strong>in</strong>ter</strong>nationalcollaborative study on <strong>the</strong> use <strong>of</strong> <strong>the</strong> micronucleus techniquefor measur<strong>in</strong>g DNA damage <strong>in</strong> humans, Mutat. Res. 428(1999) 271–283.[2] S. Bonassi, M. Fenech, C. L<strong>and</strong>o, Y.-P. L<strong>in</strong>, M. Ceppi, W.P.Chang, N. Holl<strong>and</strong>, M. Kirsch-Volders, E. Zeiger, S. Ban, R.Barale, M.P. Bigatti, C. Bolognesi, C. Jia, M. Di Giorgio, L.R.Ferguson, A. Fucic, O. Garcia Lima, P. Hrelia, A.P. Krishnaja,T.-K. Lee, L. Migliore, L. Mikhalevich, E. Mirkova, P.Mosesso, W.-U. Müller, Y. Odagiri, M.R. Scarfì, E. Szabova,I. Vorobtsova, A. Vral, A. Zijno, The HUman MicroNucleusproject. International Data Base Comparison for resultswith <strong>the</strong> cytok<strong>in</strong>esis-block micronucleus assay <strong>in</strong> humanlymphocytes. Part I. Effect <strong>of</strong> <strong>laboratory</strong> protocol, scor<strong>in</strong>gcriteria, <strong>and</strong> host factors on <strong>the</strong> frequency <strong>of</strong> <strong>micronuclei</strong>,Environ. Mol. Mutagen. 37 (2001) 31–45.[3] M. Fenech, The <strong>in</strong> vitro micronucleus technique, Mutat. Res.455 (2000) 81–95.[4] M. Kirsch-Volders, T. S<strong>of</strong>uni, M. Aardema, S. Albert<strong>in</strong>i, D.Eastmond, M. Fenech, M. Ishidate, E. Lorge, H. Norppa,J. Surrales, W. von der Hude, A. Wakata, Report from <strong>the</strong>In Vitro Micronucleus Assay Work<strong>in</strong>g Group, Environ. Mol.Mutagen. 35 (2000) 167–172.[5] K. Umegaki, M. Fenech, Cytok<strong>in</strong>esis-block micronucleusassay <strong>in</strong> WIL2-NS cells: a sensitive system to detectchromosomal damage <strong>in</strong>duced by reactive oxygen species <strong>and</strong>activated human neutrophils, Mutagenesis 15 (2000) 261–269.[6] M. Fenech, C. Aitken, J. R<strong>in</strong>aldi, Folate, Vitam<strong>in</strong> B12,homocyste<strong>in</strong>e status <strong>and</strong> DNA damage <strong>in</strong> young Australianadults, Carc<strong>in</strong>ogenesis 19 (1998) 1163–1171.[7] M. Kirsch-Volders, A. Elhajouji, E. Cundari, P. VanHummelen, The <strong>in</strong> vitro micronucleus test: a multi-endpo<strong>in</strong>tassay to detect simultaneously mitotic delay, apoptosis,chromosome breakage, chromosome loss <strong>and</strong> non-disjunction,Mutat. Res. 392 (1997) 19–30.[8] W.P. Chang, B.F. Hwang, D. Wang, J.D. Wang, Cytogeneticeffect <strong>of</strong> chronic low-dose, low-dose-rate gamma-radiation <strong>in</strong>residents <strong>of</strong> irradiated build<strong>in</strong>gs, Lancet 350 (1997) 330–333.[9] L.G. da Silva Augusto, S.R. Lieber, M.A. Ruiz, C.A.de Souza, Micronucleus monitor<strong>in</strong>g to assess humanoccupational exposure to organochlorides, Environ. Mol.Mutagen. 29 (1997) 46–52.[10] W.P. Chang, S.R. Lee, J. Tu, S.S. Hseu, Increasedmicronucleus formation <strong>in</strong> nurses with occupational nitrousoxide exposure <strong>in</strong> operat<strong>in</strong>g <strong>the</strong>aters, Environ. Mol. Mutagen.27 (1996) 93–97.[11] W.A. Anwar, S.I. Salama, M.M. el Serafy, S.A. Hemida,A.S. Hafez, Chromosomal aberrations <strong>and</strong> micronucleusfrequency <strong>in</strong> nurses occupationally exposed to cytotoxicdrugs, Mutagenesis 9 (1994) 315–317.[12] A.D. Tates, F.J. van Dam, F.A. de Zwart, F. Darroudi,A.T. Natarajan, P. Rossner, K. Peterkova, K. Peltonen, N.A.Demopoulos, G. Stephanou, D. Vlachodimitropoulos, R.J.Sram, Biological effect monitor<strong>in</strong>g <strong>in</strong> <strong>in</strong>dustrial workers from<strong>the</strong> Czech Republic exposed to low levels <strong>of</strong> butadiene,Toxicology 113 (1996) 91–99.[13] H. Norppa, S. Luomahaara, H. Heikanen, S. Roth, M. Sorsa,L. Renzi, C. L<strong>in</strong>dholm, Micronucleus assay <strong>in</strong> lymphocytes asa tool to biomonitor human exposure to aneuploidogens <strong>and</strong>clastogens, Environ. Health Perspect. 101 (Suppl 3) (1993)139–143.[14] M. Fenech, A.A. Morley, Measurement <strong>of</strong> <strong>micronuclei</strong> <strong>in</strong>human lymphocytes, Mutat. Res. 148 (1985) 29–36.[15] M. Fenech, A.A. Morley, Solutions to <strong>the</strong> k<strong>in</strong>etic problem <strong>in</strong><strong>the</strong> micronucleus assay, Cytobios 43 (1985) 223–246.[16] M. Fenech, A.A. Morley, Cytok<strong>in</strong>esis−block micronucleusmethod <strong>in</strong> human lymphocytes: effect <strong>of</strong> <strong>in</strong> vivo age<strong>in</strong>g <strong>and</strong>low−dose X−irradiation, Mutat. Res. 161 (1986) 193–198.[17] M. Fenech, W.P. Chang, M. Kirsch-Volders, N. Holl<strong>and</strong>, S.Bonassi, E. Zeiger, HUMN Project: detailed description <strong>of</strong><strong>the</strong> scor<strong>in</strong>g criteria for <strong>the</strong> cytok<strong>in</strong>esis-block micronucleusassay us<strong>in</strong>g isolated lymphocyte cultures, Mutat. Res. 534(2003) 65–75.[18] M. Fenech, The cytok<strong>in</strong>esis-block micronucleus technique:a detailed description <strong>of</strong> <strong>the</strong> method <strong>and</strong> its application togenotoxicity studies <strong>in</strong> human populations, Mutat. Res. 285(1993) 35–44.[19] M. Aitk<strong>in</strong>, D. Anderson, B. Francis, J. H<strong>in</strong>de, StatisticalModell<strong>in</strong>g <strong>in</strong> GLIM, Oxford Science Publications, ClaredonPress, Oxford, 1990.[20] S. Bonassi, V. Fontana, M. Ceppi, R. Barale, A. Biggeri,Analysis <strong>of</strong> correlated data <strong>in</strong> human biomonitor<strong>in</strong>g studies.The case <strong>of</strong> high SCE frequency cells (HFC), Mutat. Res.438 (1999) 13–21.[21] H. Goldste<strong>in</strong>, Multilevel Statistical Models, Halsted, NewYork, 1995, p. 178.[22] Generalized L<strong>in</strong>ear Interactive Model<strong>in</strong>g (GLIM) System,Release 3.77, Numerical Algorithms Group, Oxford, UK,1987.[23] J. Rasbash, W. Browne, H. Golgste<strong>in</strong>, M. Yang, I. Plewis,M. Healy, G. Woodhouse, D. Draper, I. Langford, T. Lewis,
64 M. Fenech et al. / Mutation Research 534 (2003) 45–64MLwiN Version 2.0. Multilevel Models Project Institute <strong>of</strong>Education, University <strong>of</strong> London, London, 1999.[24] J.K. Brown, A. Williams, H.R. Wi<strong>the</strong>rs, K.T. Ow, C.Gramacho, R. Grey, C. Amies, Sources <strong>of</strong> variability <strong>in</strong> <strong>the</strong>determ<strong>in</strong>ation <strong>of</strong> <strong>micronuclei</strong> <strong>in</strong> irradiated peripheral bloodlymphocytes, Mutat. Res. 389 (1997) 123–128.[25] K.L. Radack, S.M. P<strong>in</strong>ney, G.K. Liv<strong>in</strong>gston, Sources <strong>of</strong>variability <strong>in</strong> <strong>the</strong> human lymphocyte micronucleus assay: apopulation-based study, Environ. Mol. Mutagen. 26 (1995)26–36.