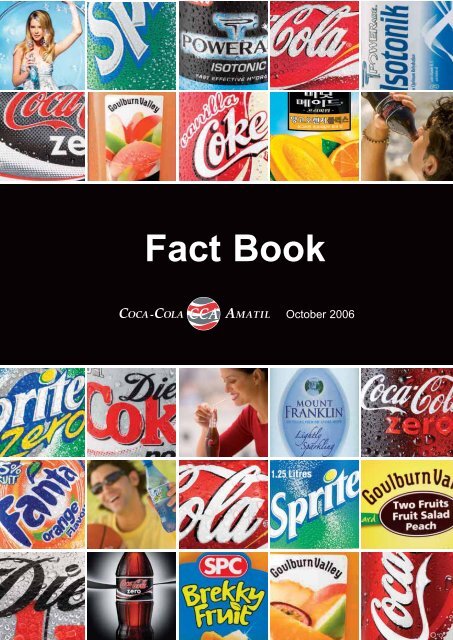
Fact Book - Coca-Cola Amatil
Fact Book - Coca-Cola Amatil
Fact Book - Coca-Cola Amatil
You also want an ePaper? Increase the reach of your titles
YUMPU automatically turns print PDFs into web optimized ePapers that Google loves.
<strong>Fact</strong> <strong>Book</strong>October 2006
Contents<strong>Coca</strong>-<strong>Cola</strong> <strong>Amatil</strong>’sPresence 3Highlights of 2006 HalfYear Results 4Review by Region 5CCA at a Glance 6Australia 8New Zealand and Fiji 10South Korea 12Indonesia andPapua New Guinea 14SPC Ardmona 16Five Year FinancialPerformance Summary 18Shareholder Information 192 <strong>Coca</strong>-<strong>Cola</strong> <strong>Amatil</strong> 2006 <strong>Fact</strong> <strong>Book</strong>
<strong>Coca</strong>-<strong>Cola</strong> <strong>Amatil</strong>’s PresenceCCA is the largest bottler of non-alcoholic ready-to-drink beverages in the Asia-Pacific region and one of the top five <strong>Coca</strong>-<strong>Cola</strong> bottlers in the world, employingclose to 19,000 people. CCA beverages operates in six countries – Australia,New Zealand, Fiji, South Korea, Indonesia and Papua New Guinea and hasaccess to 283 million consumers through over 600,000 active customers. SPCArdmona is primarily Australian based and is the largest supplier of ready-to-eatfruit and vegetable products in Australia.CCA’s expansion into non-carbonated beverages and food100%75%50%25%0%5%10%21%95%69%2001 H106Revenue splitFoodNon-CSDsCSDsBy broadening the product offering,CCA has grown its non-carbonatedbeverage business into bottledwater, juice, sports drinks, ready-todrinktea and with the acquisition ofSPC Ardmona, CCA has enteredthe ready-to-eat deciduous fruit andvegetable category. Since 2001,revenue generated from noncarbonatedbeverages and food hasgrown from 5% to 31% of totalrevenue for the first half of 2006.<strong>Coca</strong>-<strong>Cola</strong> <strong>Amatil</strong> 2006 <strong>Fact</strong> <strong>Book</strong> 3
Highlights of 2006 Half Year ResultsCCA delivered a net profit after tax for the halfyearof $145.4 million (before significant items),representing an increase of $0.2 million or 0.1%on the comparative half-year. The interim dividendhas been increased by 3.6% to 14.5 cents pershare and is fully franked.CCA's profit result has been delivered in a periodof record commodity driven cost increases,deteriorating economic conditions in Indonesia,and greater levels of price competition in Australiaand New Zealand as a result of theoverwhelmingly positive consumer response to<strong>Coca</strong>-<strong>Cola</strong> Zero.Beverage revenue increased by 6.3%, or 8.3% ona per unit case basis, driven by price increasesacross the business, solid growth from Australiaand a significant improvement in South Koreantrading. The volume and EBIT decline wasprimarily driven by the performance of theIndonesian business.The most significant impact on the first half tradingresult was a $23.4 million reduction in earningsfrom Indonesia & PNG. The economic impact ofthe removal of the government's fuel subsidy inIndonesia has been significant. The fuel priceincreases in that country of over 160% haveincreased inflation and driven down discretionaryspending and particularly demand for consumerproducts and beverages.Despite the most difficult operating environmentCCA has had to contend with for many years, CCAhas improved its market share in its major marketsof Australia and South Korea. CCA has aimed toachieve a balance between the need to recoverabnormal cost increases while maintaining thestrong value proposition our brands represent toour customers and consumers.The business has continued to invest in its nonalcoholicbeverage portfolio through product andpackage innovation, backed by up-weightedmarketing programmes, to strengthen ourconsumer franchise during this period of risingprices.Impact of rising commodity pricesCommodity price increases have had a significantimpact on CCA's manufacturing cost base. Theincreased cost of sugar, aluminium and PET resinhave driven increases of $83 million in the cost ofgoods sold for our beverages, a 9% increase overthe past 12 months.Notwithstanding the pressure the commodity cyclehas placed on the business, CCA has been able tobetter manage its portfolio to recover the cost ofgoods increases in all markets except Indonesia.Successful launch of <strong>Coca</strong>-<strong>Cola</strong> ZeroThe highlight for the half has been the outstandingsuccess of <strong>Coca</strong>-<strong>Cola</strong> Zero. <strong>Coca</strong>-<strong>Cola</strong> Zero hasbeen the biggest beverage launch for CCA in 22years, and an exceptional opportunity for thebusiness to develop a major new segment.In the six months since its Australian launch,<strong>Coca</strong>-<strong>Cola</strong> Zero has captured 13% of the colacategory, with CCA's total cola market sharegrowing from 74% to 78% (according to ACNielsen foodstore data). Combined <strong>Coca</strong>-<strong>Cola</strong>,diet Coke and <strong>Coca</strong>-<strong>Cola</strong> Zero volumes grew by9% in the first six months and <strong>Coca</strong>-<strong>Cola</strong> Zero isalready tracking above 60% of diet Coke monthlyvolumes, which is well ahead of expectations.The material market share gains made by<strong>Coca</strong>-<strong>Cola</strong> Zero have been met with increasedprice competition, with the average retail price gapto brand Coke's largest competitor widening from33% last year to 36% over the last three months.Earnings Before Interestand Tax 1 $AUD millionNet Profit 1$AUD millionReturn on CapitalEmployed 1 %Dividends per ShareCents6003503002502001501005002535302520151050500400300200100251.2H2H1145.4H2H1201510516.014.5H2H102002 2003 2004 2005 H1062002 2003 2004 2005 H10602002 2003 2004 2005 H1062002 2003 2004 2005 H1064 <strong>Coca</strong>-<strong>Cola</strong> <strong>Amatil</strong> 2006 <strong>Fact</strong> <strong>Book</strong>
EBIT $M 1Review by RegionAUSTRALIA50040030020010002182002 2003 2004 2005 H106H2H1Australia achieved volume growth of 3.4%with solid revenue growth of 6.4%, drivenby the successful launch of <strong>Coca</strong>-<strong>Cola</strong>Zero, Powerade Isotonic and thecontinued growth of water brands MountFranklin and Pump. EBIT growth waslimited by commodity driven cost of goodssold (COGS) increases and higher levelsof price competition, particularly in thesupermarket channel.ProductLaunches in2006EBIT $M 1EBIT $M 1EBIT $M 1EBIT $MNEW ZEALAND & FIJI100806040200312002 2003 2004 2005 H106SOUTH KOREA806040208.502002 2003 2004 2005 H106-20INDONESIA & PNG6040200-20-122002 2003 2004 2005 H106SPC ARDMONA6040202002005 H106(10 months)H2H1H2H1H2H1H2H1In local currency, New Zealand increasedrevenue by 2.0% and Fiji deliveredrevenue growth of 4.1%. A slowdown inconsumer demand in New Zealand led todeclines in the overall non-alcoholic readyto-drink(NARTD) market. Combined withgreater price competition, the regionreported an EBIT decline for the half.The South Korean business delivered asignificantly improved earnings result withEBIT increasing nine-fold to $8.5 million(before significant items). The improvedresult was a combination of better revenuemanagement, stronger promotionaldiscipline, successful new productlaunches, and the initial benefits from theearly retirement plan which was completedin April.The Indonesia & PNG region experienceda loss of $12.1 million in the first half ashigh inflation and year-on-year fuel priceincreases of over 160% in Indonesiamaterially impacted consumer confidenceand spending on discretionary itemsincluding beverages.SPC Ardmona delivered a record first halfresult generating EBIT of $20.2 million.Highlights were the continued strongperformance of the fruit snacks businessand strong growth of the internationalbusiness. Margin growth was restricteddue to tin plate driven cost of goodsincreases and high levels of pricecompetition from imported private labeltinned products.1 For 2005 and 2004 the financial information has been prepared under Australian equivalents to International Financial ReportingStandards (AIFRS), and for years prior to 2004 the financial information has been prepared under the previous framework ofAustralian Accounting Standards (AGAAP).All numbers are in Australian dollars and exclude significant items.<strong>Coca</strong>-<strong>Cola</strong> <strong>Amatil</strong> 2006 <strong>Fact</strong> <strong>Book</strong> 5
CCA at a GlanceCCA is the largest bottlerof non-alcoholic ready-todrinkbeverages in theAsia-Pacific region andone of the top five<strong>Coca</strong>-<strong>Cola</strong> bottlers inthe world.AustraliaH106 Financial summary A$m% ofCCATrading revenue 1,105.8 54EBIT 1 218.2 82Capital employed 2 1,442.3 39New Zealand & FijiH106 Financial summary A$m% ofCCATrading revenue 201.2 10EBIT 1 30.7 12Capital employed 2 342.3 9CCA employs nearly 19,000 peopleand in beverages has access to 283million consumers through over600,000 active customers.Leading brandsLeading brandsBeverages – 90% of revenueCCA operates in six countries –Australia, New Zealand, Fiji, SouthKorea, Indonesia and PNG.Food – 10% of revenueSPC Ardmona is the largest supplierof ready-to-eat fruit and vegetableproducts in Australia.Broadening our beverageportfolioCCA has leading market sharepositions in all markets.In 2001 CCA recognised theimperative to become a broader basedbeverage business. We have acted onthe opportunity to accelerate ourgrowth into non-carbonated beverageswhere we had only a small presence.Since 2001, non-carbonatedbeverages and food have grown from5% to 21% of revenue and there is stillconsiderable scope to increase ourmarket share of this fast growingcategory.The acquisition of SPC Ardmona inFebruary 2005 has provided leadingbrands (SPC, Goulburn Valley andArdmona) to further develop ourportfolio of health and wellbeingproducts.Note:Market information as perCCA 2005 Annual Report.6 <strong>Coca</strong>-<strong>Cola</strong> <strong>Amatil</strong> 2006 <strong>Fact</strong> <strong>Book</strong>CCA market shareCarbonated beveragesKey brands: Coke, Fanta,SpriteMajor competitor:Pepsi/SchweppesGrowth drivers: Low calorieCategory growth (3 yrs): 1.3%WaterKey brands: Mt Franklin,PumpMajor competitor: P&NGrowth drivers:Cold single serve packsCategory growth (3 yrs): 6.3%JuiceKey brands: FruitopiaMajor competitor: BerriGrowth drivers:Health and wellbeingCategory growth (3 yrs): 6.0%SportsKey brands: PoweradeMajor competitor:Pepsi/SchweppesGrowth drivers:Health and wellbeingCategory growth (3 yrs): 21.8%EnergyKey brands: Recharge bySpriteMajor competitor: FrucorGrowth drivers: Productinnovation and lifestyleCategory growth (3 yrs): 27.5%Market share data relates to the foodstores channel.CCA market share – New ZealandCarbonated beveragesKey brands: Coke, Fanta,SpriteMajor competitor:HousebrandsGrowth drivers: Low calorieCategory growth (3 yrs): 5.2%WaterKey brands: Pump, Kiwi BlueMajor competitor: FrucorGrowth drivers:Health and wellbeingCategory growth (3 yrs): 24.4%JuiceKey brands: KeriMajor competitor: FrucorGrowth drivers: Chilled juiceCategory growth (3 yrs): 9.3%SportsKey brands: PoweradeMajor competitor: n/aGrowth drivers:Health and wellbeingCategory growth (3 yrs): 16.7%EnergyKey brands: e2, Lift PlusMajor competitor: FrucorGrowth drivers: Productinnovation and lifestyleCategory growth (3 yrs): 22.4%Market share data relates to the grocery and petroleum channel.
South KoreaH106 Financial summary A$m% ofCCATrading revenue 366.7 18EBIT 1 8.5 3Capital employed 2 733.2 20Indonesia & PNGH106 Financial summary A$m% ofCCATrading revenue 184.4 9EBIT 1 -12.1 -5Capital employed 2 283.1 8SPC ArdmonaH106 Financial summary A$m% ofCCATrading revenue 197.7 10EBIT 1 20.2 8Capital employed 2 884.5 241 CCA Group EBIT of $251.2 million includes $14.3 million of corporate/unallocated costs not included in the above summary.2 CCA Group capital employed of $3,585.3 million as at 30 June 2006 includes ($100.1) million of corporate/unallocated capital employed not included in the above summary.Leading brands Leading brands Leading brandsCCA market shareCarbonated beveragesKey brands: Coke, FantaMajor competitor: LotteGrowth drivers: Newpackaging and brandextensionsCategory growth (3 yrs): -10.0%CCA market share – IndonesiaCarbonated beveragesKey brands: Sprite, Fanta, CokeMajor competitor: PepsiGrowth drivers:New flavours and packsCategory growth (3 yrs): -3.0%SPCA market shareCanned FruitKey brands: Goulburn Valley,SPCMajor competitor: Golden CircleGrowth drivers:Resealable Fridge PackCategory growth (3 yrs): 7.5%JuiceKey brands: Minute MaidMajor competitor: LotteGrowth drivers:Health and wellbeingCategory growth (3 yrs): -2.8%RTD teaKey brands: FresteaMajor competitor: SosroGrowth drivers: Fruit flavoursCategory growth (3 yrs): 8.0%Fruit snacksKey brands: Goulburn Valley,SPCMajor competitor: n/aGrowth drivers:Health and wellbeingCategory growth (3 yrs): 5.0%WaterKey brands: Soonsoo100Major competitor: NongshimGrowth drivers:Health and wellbeingCategory growth (3 yrs): 8.0%WaterKey brands: AdesMajor competitor: AquaGrowth drivers: Low availabilityof quality drinking waterCategory growth (3 yrs): 14.0%SpreadsKey brands: IXLMajor competitor:Cottees, St DalfourGrowth drivers: Premium jamsCategory growth (3 yrs): -2.9%SportsKey brands: PoweradeMajor competitor: Dong-AGrowth drivers:Health and wellbeingCategory growth (3 yrs): -2.8%RTD teaKey brands: NesteaMajor competitor: LotteGrowth drivers: Asian teaCategory growth (3 yrs): 20.3%Market share data relates to hyper andsupermarkets, mom and pop stores and conveniencechannels.SportsKey brands: PoweradeIsotonicMajor competitor: Pocari SweatGrowth drivers:Health and wellbeingCategory growth (3 yrs): 23.0%Market share data relates to all channels.Tinned tomatoesKey brands: ArdmonaMajor competitor:Imports and housebrandsGrowth drivers:Value-added productsCategory growth (3 yrs): 2.0%Baked beans & spaghettiKey brands: SPCMajor competitor: HeinzGrowth drivers:Health and wellbeingCategory growth (3 yrs): 2.2%<strong>Coca</strong>-<strong>Cola</strong> <strong>Amatil</strong> 2006 <strong>Fact</strong> <strong>Book</strong> 7
AustraliaCarbonated Beverages Water SportsJuiceRTD Tea/CoffeeCategory Mix (unit cases)56%22%16%3%Sugar CSDsNon-sugar CSDsWaterSportsWaterNon-sugar CSDsSugar CSDs1.3%Juice0.3%RTD tea/coffee1.4%OtherPackage Mix (unit cases)Channel Mix (unit cases)57%52%47%26%12%6%1%PET Cans Fountain OtherSupermarkets C&L Other11 Convenience & Leisure8 <strong>Coca</strong>-<strong>Cola</strong> <strong>Amatil</strong> 2006 <strong>Fact</strong> <strong>Book</strong>
Key <strong>Fact</strong>sBeverage Market*Production Facilities 15Employees 3,700Production Lines 36Number of Branded Coolers 130,000Warehouses 20Stock Keeping Units 390Cross Dock Locations 43Number of Customers 86,800WaterJuice58%19%19%1.7%0.4%0.5%1.6%CSDsJuiceWaterSportsRTD tea/coffeeEnergyOtherCSDs* Non-alcoholic ready-to-drinkFinancial Summary ($AUD)2002 2003 2004 2005 H106Revenue ($ million) 1,776.8 1,882.9 2,041.6 2,125.1 1,105.8Volume (million unit cases) 285.8 301.2 322.9 322.0 160.1Revenue per unit case $6.22 $6.25 $6.32 $6.60 $6.91EBIT ($ million) 317.0 377.7 432.5 455.5 218.2EBIT margin 17.8% 20.1% 21.2% 21.4% 19.7%Capex to revenue 1.7% 5.2% 6.3% 7.8% 3.3%NBFor 2005 and 2004 the financial information has been prepared under Australian equivalents to International Financial Reporting Standards (AIFRS), and for years priorto 2004 the financial information has been prepared under the previous framework of Australian Accounting Standards (AGAAP).All numbers exclude significant items.% of CCA Capital Employed Revenue $M EBIT 1 $M220050039%165011005501,106H2H1400300200100218H2H102002 2003 2004 2005 H10602002 2003 2004 2005 H1061 Before significant items<strong>Coca</strong>-<strong>Cola</strong> <strong>Amatil</strong> 2006 <strong>Fact</strong> <strong>Book</strong> 9
New Zealand & FijiCarbonated Beverages Water SportsJuiceEnergyCategory Mix - New Zealand (unit cases)58%14%Sugar CSDsNon-sugar CSDsNon-sugar CSDsJuice14%7%JuiceWaterSugar CSDs4%Sports2%Energy1%OtherPackage Mix - New Zealand (unit cases)Channel Mix - New Zealand (unit cases)75%55%44%11% 9%5%1%PET Fountain Cans OtherSupermarkets C&L Other11 Convenience & Leisure10 10 <strong>Coca</strong>-<strong>Cola</strong> <strong>Amatil</strong> 2006 <strong>Fact</strong> <strong>Book</strong>
Key <strong>Fact</strong>sBeverage Market* - New ZealandNZFijiProduction Facilities 5 1Production Lines 13 4WaterJuiceCSDsWarehouses 4 5Employees 1,010 246Number of Coolers 26,550 3,500Stock Keeping Units 245 200Number of Customers 18,930 2,60059%26%8%3%3%1%1%CSDsJuiceWaterEnergyFlavoured MilkLifestyleSports* Non-alcoholic ready-to-drinkFinancial Summary ($AUD)2002 2003 2004 2005 H106Revenue ($ million) 322.2 411.1 427.2 451.9 201.2Volume (million unit cases) 57.4 67.3 67.7 67.1 31.5Revenue per unit case $5.61 $6.11 $6.31 $6.73 $6.39EBIT ($ million) 55.7 75.9 81.9 72.0 30.7EBIT margin 17.3% 18.5% 19.2% 15.9% 15.3%Capex to revenue 3.6% 5.1% 5.4% 5.8% 11.3%NBFor 2005 and 2004 the financial information has been prepared under Australian equivalents to International Financial Reporting Standards (AIFRS), and for years priorto 2004 the financial information has been prepared under the previous framework of Australian Accounting Standards (AGAAP).All numbers exclude significant items.% of CCA Capital Employed Revenue $M EBIT 1 $M4801009%360240HH806040H2H1120201203102002 2003 2004 2005 H10602002 2003 2004 2005 H1061 Before significant items<strong>Coca</strong>-<strong>Cola</strong> <strong>Amatil</strong> 2006 <strong>Fact</strong> <strong>Fact</strong> <strong>Book</strong> 11 11
South KoreaCarbonated BeveragesRTD TeaWaterSportsJuiceCategory Mix (unit cases)Non-sugarCSDs73%Sugar CSDsWater4%Non-sugar CSDsSugar CSDs9%Water7%Juice4%RTD tea/coffee3%SportsPackage Mix (unit cases)Channel Mix (unit cases)63%42%35%22%15%12% 11%PET Cans Fountain RGB & Other1C&L Other Supermarkets1 Returnable glass bottles12 <strong>Coca</strong>-<strong>Cola</strong> <strong>Amatil</strong> 2006 <strong>Fact</strong> <strong>Book</strong>
Key <strong>Fact</strong>sBeverage Market*Production Facilities 3Employees 2,300Production Lines 17JuiceWaterCSDsNumber of Coolers 89,000Warehouses 19Stock Keeping Units 20036%25%20%CSDsWaterJuiceCross Dock Locations 6Number of Customers 113,000* Non-alcoholic ready-to-drink5% RTD tea/coffee7% Sports7% OtherFinancial Summary ($AUD)2002 2003 2004 2005 H106Revenue ($ million) 837.5 612.5 561.5 630.7 366.7Volume (million unit cases) 143.9 121.7 122.7 126.0 61.9Revenue per unit case $5.82 $5.03 $4.58 $5.01 $5.92EBIT ($ million) 62.0 14.2 4.6 -6.6 8.5EBIT margin 7.4% 2.3% 0.8% -1.0% 2.3%Capex to revenue 1.6% 4.7% 6.2% 6.7% 1.7%NBFor 2005 and 2004 the financial information has been prepared under Australian equivalents to International Financial Reporting Standards (AIFRS), and for years priorto 2004 the financial information has been prepared under the previous framework of Australian Accounting Standards (AGAAP).All numbers exclude significant items.% of CCA Capital Employed Revenue $M EBIT 1 $M10008020%750500H2H16040H2H125036702002 2003 2004 2005 H1062008.5-202002 2003 2004 2005 H1061 Before significant items<strong>Coca</strong>-<strong>Cola</strong> <strong>Amatil</strong> 2006 <strong>Fact</strong> <strong>Book</strong> 13
Indonesia & Papua New GuineaCarbonated Beverages RTD Tea Sports WaterCategory Mix - Indonesia (unit cases)76%14%CSDsRTD tea/coffeeRTD tea/coffeeWaterCSDs8%Water2%SportsPackage Mix - Indonesia (unit cases)Channel Mix - Indonesia (unit cases)61%60%26%20%14%6%14%1RGB PET Cans Fountain & OtherC&L Other Supermarkets1 Returnable glass bottles14 14 <strong>Coca</strong>-<strong>Cola</strong> <strong>Amatil</strong> 2006 <strong>Fact</strong> <strong>Fact</strong> <strong>Book</strong> <strong>Book</strong>
Key <strong>Fact</strong>sBeverage Market* - IndonesiaIndonesiaPNGProduction Facilities 10 1Production Lines 29 5Warehouses 126 7Employees 8,800 500Number of Coolers 102,000 7,900Stock Keeping Units 105 72Number of Customers 468,000 6,200RTDtea/coffee66%12%12%10%WaterCSDsWaterCSDsRTD tea/coffeeOther* Non-alcoholic ready-to-drinkFinancial Summary ($AUD)2002 2003 2004 2005 H106Revenue ($ million) 496.1 450.6 419.8 427.9 184.4Volume (million unit cases) 116.2 109.5 113.1 124.0 44.4Revenue per unit case $4.27 $4.12 $3.71 $3.45 $4.15EBIT ($ million) 28.8 28.5 32.4 42.9 -12.1EBIT margin 5.8% 6.3% 7.7% 10.0% -6.6%Capex to revenue 8.1% 8.3% 6.1% 9.0% 11.2%NBFor 2005 and 2004 the financial information has been prepared under Australian equivalents to International Financial Reporting Standards (AIFRS), and for years priorto 2004 the financial information has been prepared under the previous framework of Australian Accounting Standards (AGAAP).All numbers exclude significant items.% of CCA Capital Employed Revenue $M EBIT 1 $M500608%400300200100184H2H14020H2H102002 2003 2004 2005 H1060-122002 2003 2004 2005 H1061 Before significant items<strong>Coca</strong>-<strong>Cola</strong> <strong>Amatil</strong> 2006 <strong>Fact</strong> <strong>Book</strong> 15
SPC ArdmonaPackaged FruitFruit SnacksBaked Beans & SpaghettiTomatoesSpreadsCategory Mix (box quantities)43%11%Packaged fruitFruit snacksFruit SnacksTomatoes14%12%3%17%TomatoesBaked Beans & SpaghettiSpreadsOtherPackaged FruitPackage Mix (box quantities)Channel Mix (box quantities)70%34%26%19%8%3%16%12%8%4%Cans Plastic Other GlassRetail BrandedFood ServiceOtherExpor tPrivate LabelIndustrial16 16 <strong>Coca</strong>-<strong>Cola</strong> <strong>Amatil</strong> <strong>Amatil</strong> 2006 2006 <strong>Fact</strong> <strong>Fact</strong> <strong>Book</strong> <strong>Book</strong>
Key <strong>Fact</strong>sProduction Facilities 5Production Lines 54Warehouses 15Employees 1,060(> 3,000 during fruit processing season)SPCA Market PositionRankPackaged Fruit 1Tinned Tomatoes 1Henry Jones Spreads 2Baked Beans & Spaghetti 2Source: AC Nielsen Scan Track. (Excludes food service)Domestic Stock Keeping Units 1,400International Stock Keeping Units 760Financial Summary ($AUD)2005 H10610 months 6 monthsRevenue ($ million) 351.9 197.7EBIT ($ million) 45.7 20.2EBIT margin 13.0% 10.2%Capex to revenue 6.2% 6.4%% of CCA Capital Employed Revenue $M EBIT $M4006024%300H240H2200100198H12020H102005 H10602005 H106(10 months)<strong>Coca</strong>-<strong>Cola</strong> <strong>Amatil</strong> 2006 <strong>Fact</strong> <strong>Book</strong> 17
Five Year FinancialPerformance SummaryOngoing Business$AUD 2002 1 2003 1 2004 1 2005 1 H106Volume – unit cases million 603.3 599.7 626.4 639.1 297.9Revenue – Beverages $ million 3,432.6 3,357.1 3,450.1 3,635.6 1,858.1Revenue – Food $ million – – – 351.9 197.7EBIT 2 $ million 421.9 470.0 518.3 570.6 251.2EBIT Margin 2 % 12.3 14.0 15.0 14.3 12.2Operating Cash Flow $ million 389.2 384.3 381.0 435.2 120.7Capital Expenditure to Revenue 3 % 2.8 4.8 6.1 7.4 4.8Return on Average Capital Employed 2 % 8.8 10.2 21.6 17.5 16.0CCA GroupNet Profit 2 – Ongoing business $ million 205.5 238.8 274.3 320.5 145.4Significant Items (net of tax) $ million 4.0 -44.6 2.3 – -31.1Net Profit $ million 209.5 194.2 276.6 320.5 114.3Gearing RatiosEBIT Interest Cover 2 times 3.2 4.1 4.7 4.1 3.8Net Debt to Equity % 46.0 54.1 164.8 149.7 151.3Balance SheetNet Debt $ million 1,478.6 1,579.5 1,536.8 2,132.7 2,158.6Equity $ million 3,215.2 2,921.7 932.5 1,424.8 1,426.7Capital Employed (year end) $ million 4,693.8 4,501.2 2,469.3 3,557.5 3,585.3Per Share InformationEarnings per Share – before Significant Items cents 29.8 34.3 39.0 43.3 19.4Earnings per Share cents 30.4 27.9 39.3 43.3 15.3Dividends per Share cents 18.5 23.0 28.0 31.5 14.5Level of Franking – Final % 50 75 100 100 -– Interim % 50 50 100 100 1001 For 2005 and 2004 the financial information has been prepared under Australian equivalents to International Financial Reporting Standards (AIFRS), and for years prior to2004 the financial information has been prepared under the previous framework of Australian Accounting Standards (AGAAP).2 Before significant items.3 2005 and 2004 capital expenditure includes purchases of returnable containers owing to a change in accounting policy in 2004, whereby returnable containers werereclassified from inventories to property, plant and equipment. 2003 and prior years have not been restated for this change.18 <strong>Coca</strong>-<strong>Cola</strong> <strong>Amatil</strong> 2006 <strong>Fact</strong> <strong>Book</strong>
Shareholder InformationRegistered Office<strong>Coca</strong>-<strong>Cola</strong> <strong>Amatil</strong>71 Macquarie StreetSydney NSW 2000David WylieCompany SecretaryPh: (61) 13 26 53Investor Relations<strong>Coca</strong>-<strong>Cola</strong> <strong>Amatil</strong>Kristina DevonInvestor Relations ManagerPh: (02) 9259 6159Fax: (02) 9259 6614aus_investor_relations@anz.ccamatil.comShare RegistryLink Market ServicesLocked Bag A14Sydney South NSW 1235Ph: (02) 8280 7121Fax: (02) 9287 0303registrars@linkmarketservices.com.auwww.linkmarketservices.com.auAmerican Depositary Receipts (ADR)The Bank of New YorkInvestor ServicesPO Box 11258, Church Street StationNew York NY 10286-1258 USAToll Free Ph: 1 888 269 2377Int’l Ph: (1 212) 815 3700shareowners@bankofny.comwww.adrbny.comFor more information about <strong>Coca</strong>-<strong>Cola</strong> <strong>Amatil</strong> please visit our website atThe Active <strong>Fact</strong>or program supports a number of initiativestargeted towards increasing activity in children. Active <strong>Fact</strong>oris a proactive and responsible approach to helpinggovernment and community groups address the issues ofwww.ccamatil.comOver 300,000 people attended the 12thannual <strong>Coca</strong>-<strong>Cola</strong> Christmas in the Park inAucklandand Christchurch, New Zealand. In 2006,the event won a judges special mention19 <strong>Coca</strong>-<strong>Cola</strong> <strong>Amatil</strong> 2005 Annual Report<strong>Coca</strong>-<strong>Cola</strong> <strong>Coca</strong>-<strong>Cola</strong> <strong>Amatil</strong> <strong>Amatil</strong> 2005 2006 Annual <strong>Fact</strong> Report <strong>Book</strong> 19
<strong>Coca</strong>-<strong>Cola</strong> <strong>Amatil</strong> LimitedABN 26 004 139 39720 <strong>Coca</strong>-<strong>Cola</strong> <strong>Amatil</strong> 2005 Annual Report


