Brennan Report - Department of Health and Children
Brennan Report - Department of Health and Children Brennan Report - Department of Health and Children
Report of the Commission on Financial Management and Control Systems in the Health ServiceCHAPTER 7ACCOUNTABILITY - EMPLOYMENT AND PAYIn this Chapter, we focus specifically on health service employment. We detail the increase in health servicepay and employment in recent years and we examine how factors including overtime and allowances areaffecting the overall pay bill. We consider the systems for setting authorised staff numbers and how theseoperate in practice. We make recommendations in relation to negotiating and implementing pay agreementsand the operation of the Common Recruitment Pool.7.1 OVERVIEWPay is the single biggest cost driver in the health service. It accounts for over two-thirds of totalnon-capital health expenditure. In absolute terms, pay costs have risen by a cumulative ¤ 2.1billion or 69% over the four-year period, 1999 to 2002.Numbers employed in the health service increased by 37% between 1997 and 2001 – from68,000 to 93,000. For a number of groups in the health sector, gross pay rates (i.e. withovertime, call-out payments, etc. included) are significantly higher than basic pay.We believe the health service does not have adequate information to facilitate proper costingand control on issues of employment and pay.There is a lack of co-ordination in the health service in the collection and validation of basicinformation on national employment levels and pay patterns.There is an absence of manpower planning at national level on issues including conditions ofemployment, recruitment policies, rostering arrangements, flexibility requirements etc.The methods used to negotiate pay agreements have sometimes produced expensive knock-onconsequences and this aspect of the system needs to be urgently reviewed.At present vacancies within many areas of the health service can only be filled by a systemknown as the Common Recruitment Pool. This agreement, dating back to 1970, was designedto preserve the promotional outlets of certain employees within the Pool. This blocks accessfor applicants from such areas as the private sector, voluntary hospitals, mental handicapagencies and the civil service. We believe these arrangements are not appropriate and shouldbe changed.We also recommend the introduction of effective performance management systems and anaccelerated management development programme for senior managers in the health service.7.2 PAYExpenditure on PayAs can be seen below (Table 7.1 and Figure 7.1), pay is the single biggest cost driver in the healthsystem.There are, essentially, three variables that drive pay costs:86
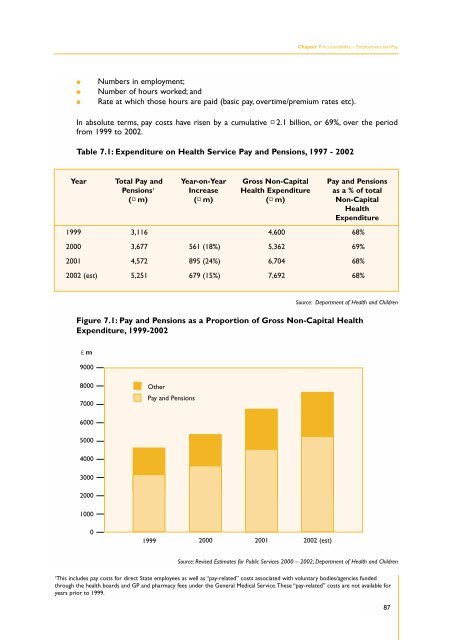
Chapter 7 Accountability – Employment and Pay●●●Numbers in employment;Number of hours worked; andRate at which those hours are paid (basic pay, overtime/premium rates etc).In absolute terms, pay costs have risen by a cumulative ¤ 2.1 billion, or 69%, over the periodfrom 1999 to 2002.Table 7.1: Expenditure on Health Service Pay and Pensions, 1997 - 2002Year Total Pay and Year-on-Year Gross Non-Capital Pay and PensionsPensions 1 Increase Health Expenditure as a % of total(¤ m) (¤ m) (¤ m) Non-CapitalHealthExpenditure1999 3,116 4,600 68%2000 3,677 561 (18%) 5,362 69%2001 4,572 895 (24%) 6,704 68%2002 (est) 5,251 679 (15%) 7,692 68%Source: Department of Health and ChildrenFigure 7.1: Pay and Pensions as a Proportion of Gross Non-Capital HealthExpenditure, 1999-2002£ m900080007000OtherPay and Pensions600050004000300020001000019992000 2001 2002 (est)Source: Revised Estimates for Public Services 2000 – 2002; Department of Health and Children1This includes pay costs for direct State employees as well as “pay-related” costs associated with voluntary bodies/agencies fundedthrough the health boards and GP and pharmacy fees under the General Medical Service.These “pay-related” costs are not available foryears prior to 1999.87
- Page 37 and 38: Chapter 2 Overview and IssuesThe an
- Page 39 and 40: Chapter 2 Overview and IssuesTable
- Page 41 and 42: Chapter 2 Overview and IssuesProble
- Page 43 and 44: Chapter 3 Managing the Health Servi
- Page 45 and 46: Chapter 3 Managing the Health Servi
- Page 47 and 48: Chapter 3 Managing the Health Servi
- Page 49 and 50: Chapter 3 Managing the Health Servi
- Page 51 and 52: Chapter 3 Managing the Health Servi
- Page 53 and 54: Chapter 3 Managing the Health Servi
- Page 55 and 56: Chapter 3 Managing the Health Servi
- Page 57 and 58: Chapter 3 Managing the Health Servi
- Page 59 and 60: Chapter 4 Service Planning, Budgeti
- Page 61 and 62: Chapter 4 Service Planning, Budgeti
- Page 63 and 64: Chapter 4 Service Planning, Budgeti
- Page 65 and 66: Chapter 5 Accountability - Hospital
- Page 67 and 68: Chapter 5 Accountability - Hospital
- Page 69 and 70: Chapter 5 Accountability - Hospital
- Page 71 and 72: Chapter 5 Accountability - Hospital
- Page 73 and 74: Chapter 5 Accountability - Hospital
- Page 75 and 76: Chapter 5 Accountability - Hospital
- Page 77 and 78: Chapter 5 Accountability - Hospital
- Page 79 and 80: Chapter 6 Accountability - General
- Page 81 and 82: Chapter 6 Accountability - General
- Page 83 and 84: Chapter 6 Accountability - General
- Page 85 and 86: Chapter 6 Accountability - General
- Page 87: Chapter 6 Accountability - General
- Page 91 and 92: Chapter 7 Accountability - Employme
- Page 93 and 94: Chapter 7 Accountability - Employme
- Page 95 and 96: Chapter 7 Accountability - Employme
- Page 97 and 98: Chapter 7 Accountability - Employme
- Page 99 and 100: Chapter 7 Accountability - Employme
- Page 101 and 102: Chapter 8 Audit ReformCHAPTER 8AUDI
- Page 103 and 104: Chapter 8 Audit ReformRecommendatio
- Page 105 and 106: Chapter 8 Audit Reformoutsourcing)
- Page 107 and 108: Chapter 8 Audit Reformaudit reports
- Page 109 and 110: Chapter 8 Audit Reformas relating t
- Page 111 and 112: Chapter 8 Audit Reform●●Penalti
- Page 113 and 114: Chapter 9 External Reporting Proced
- Page 115 and 116: Chapter 9 External Reporting Proced
- Page 117 and 118: Chapter 9 External Reporting Proced
- Page 119 and 120: Chapter 10 Information SystemsStrat
- Page 121 and 122: Chapter 10 Information SystemsRecom
- Page 123 and 124: Chapter 11 ImplementationRecommenda
- Page 125 and 126: Chapter 11 Implementationbeing brou
- Page 127 and 128: Appendix 1Appendix 1COMMISSION MEMB
- Page 129 and 130: Appendix 1He has held this position
- Page 131 and 132: Appendix 2SIPTU*South Eastern Healt
- Page 133 and 134: Appendix 3Name of AgencyBord na Rad
- Page 135 and 136: Appendix 3Name of AgencyIrish Blood
- Page 137 and 138: Appendix 3Name of AgencyWomen’s H
Chapter 7 Accountability – Employment <strong>and</strong> Pay●●●Numbers in employment;Number <strong>of</strong> hours worked; <strong>and</strong>Rate at which those hours are paid (basic pay, overtime/premium rates etc).In absolute terms, pay costs have risen by a cumulative ¤ 2.1 billion, or 69%, over the periodfrom 1999 to 2002.Table 7.1: Expenditure on <strong>Health</strong> Service Pay <strong>and</strong> Pensions, 1997 - 2002Year Total Pay <strong>and</strong> Year-on-Year Gross Non-Capital Pay <strong>and</strong> PensionsPensions 1 Increase <strong>Health</strong> Expenditure as a % <strong>of</strong> total(¤ m) (¤ m) (¤ m) Non-Capital<strong>Health</strong>Expenditure1999 3,116 4,600 68%2000 3,677 561 (18%) 5,362 69%2001 4,572 895 (24%) 6,704 68%2002 (est) 5,251 679 (15%) 7,692 68%Source: <strong>Department</strong> <strong>of</strong> <strong>Health</strong> <strong>and</strong> <strong>Children</strong>Figure 7.1: Pay <strong>and</strong> Pensions as a Proportion <strong>of</strong> Gross Non-Capital <strong>Health</strong>Expenditure, 1999-2002£ m900080007000OtherPay <strong>and</strong> Pensions600050004000300020001000019992000 2001 2002 (est)Source: Revised Estimates for Public Services 2000 – 2002; <strong>Department</strong> <strong>of</strong> <strong>Health</strong> <strong>and</strong> <strong>Children</strong>1This includes pay costs for direct State employees as well as “pay-related” costs associated with voluntary bodies/agencies fundedthrough the health boards <strong>and</strong> GP <strong>and</strong> pharmacy fees under the General Medical Service.These “pay-related” costs are not available foryears prior to 1999.87


