UNIVERSITE LIBRE DE BRUXELLES Gene expression profiles of ...
UNIVERSITE LIBRE DE BRUXELLES Gene expression profiles of ...
UNIVERSITE LIBRE DE BRUXELLES Gene expression profiles of ...

You also want an ePaper? Increase the reach of your titles
YUMPU automatically turns print PDFs into web optimized ePapers that Google loves.
<strong>UNIVERSITE</strong> <strong>LIBRE</strong> <strong>DE</strong> <strong>BRUXELLES</strong>FACULTE <strong>DE</strong> ME<strong>DE</strong>CINEInstitut de Recherche Interdisciplinaire en Biologie Humaine et Moléculaire(IRIBHM)Promoteur de Thèse : Dr. C. MaenhautCo-Promoteur de Thèse : Pr. J.E Dumont<strong>Gene</strong> <strong>expression</strong> <strong>pr<strong>of</strong>iles</strong> <strong>of</strong> Papillary and AnaplasticThyroid CarcinomasThèse présentée en vue de l’obtention du grade académique deDocteur en Sciences BiomédicalesLaurent DelysNovembre 2007
<strong>Gene</strong> <strong>expression</strong> <strong>pr<strong>of</strong>iles</strong> <strong>of</strong> Papillary and AnaplasticThyroid CarcinomasPromoteur de Thèse : Dr. C. MaenhautCo-Promoteur de Thèse : Pr. J.E DumontMembres du jury :Pr. Magali Waelbroeck (Présidente)Pr. Laurence LeenhardtPr. Marie-Christine ManyPr. Daniel GlinoerDr. Pierre HeimannDr. Christos Sotiriou
RemerciementsVoilà maintenant 5 ans que je suis arrivé à l’IRIBHM et le temps est passé à unevitesse vertigineuse. Je me vois encore arrivé dans le bureau de Carine pour qu’elle mepropose un sujet de thèse, ou encore le premier jour effectif de ma thèse où j’étais stresséet me demandait si j’en étais capable. Que de chemin parcouru depuis lors ! J’aivraiment l’impression d’avoir énormément évolué intellectuellement. Cette gymnastiquede l’esprit, je la dois à l’IRI avec ses personnes enrichissantes et ses différents séminaires,où il est vrai, on se force parfois pour y aller. Tout ceci m’a rendu plus fort et plus mûr.Je pars maintenant pour d’autres horizons, mais il est certain que cette période de 5 anspassée avec vous restera comme l’une des toutes bonnes périodes de ma vie. Merci.Et si je suis arrivé à l’IRI, c’est tout d’abord grâce à l’accueil des pr<strong>of</strong>esseurs G.Vassartet J.E Dumont dans leur institut. Mr Vassart, vous avez déclaré un jour que votreporte était toujours ouverte aux doctorants en cas de problème. J’ai pu le constater àquelques reprises et j’ai apprécié nos franches discussions. Mr Dumont, comment vousremerciez en quelques mots alors que vous m’avez tant apporté ? Cette thèse n’auraitjamais pu être réalisée sans votre aide. D’autre part, j’espère que vos connaissances« gigantissimes » auront un peu déteint sur moi. Enfin, je ne suis pas prêt d’oubliervotre bonne humeur et votre rire légendaire.Carine, j’ai réellement apprécié ta disponibilité tout au long de cette thèse et ta manièrede diriger tes doctorants. Tu nous soutiens toujours dans nos initiatives et tu nous faisconfiance. Tu es également prête à te remettre en question et j’ai apprécié nos discussionssincères. J’espère que mes futurs patrons seront tous comme toi ! Mille mercis.La vie à l’IRI n’aurait jamais été aussi agréable sans les nombreuses personnes seréunissant au C4.124 à l’heure du midi. Entre les discussions culinaires et d’actualités,et nos fous rires, nous discutions de tout à l’exception, à mon grand regret, de sport. Ilfaut dire que nous, les mâles, étions en minorité. Quitte à paraître goujat, je vais donccommencer pour nous remercier, nous les « gibiers », pour avoir supporté cette horde defilles dont leurs discussions et leurs réactions m’échappaient parfois. Fabrice, tu es lepremier doctorant que j’ai rencontré en arrivant à l’IRI. Le contact est tout de suitepassé et tu étais parfois le seul de mon avis contre toutes ces filles. Merci pour cesoutien durant les premières années de ma thèse ! Nicolas, la force tranquille du groupe.Tu es doté d’une intelligence rare et tu es toujours prêt à aider et à rendre des petitsservices. Je te souhaite vraiment de réaliser une belle thèse et beaucoup de courage, … àtout point de vue ! Je dois reconnaître que, malgré tout ce que je peux dire, c’étaitvraiment sympa de passer du temps au labo et en dehors avec vous, les filles. J’ai appris
à mieux comprendre cette alchimie qui fait que nous sommes si différents, et sicomplémentaires à la fois. Alors parce que j’ai appris durant ces 5 années que les« truites » sont souvent jalouses entre elles (vous ne saviez pas que je vous appelaiscomme cela ?), je vais donc vous remerciez par ordre alphabétique pour éviter touteembrouille. Aline, grâce à toi, j’ai la preuve qu’on peut être plus hyperkinétique que moi !Tu ne tiens pas en place, c’est incroyable ! De plus, avec toi, pas besoin de montre : à12h précise, tu rentrais dans le bureau avec un air mi interrogateur mi pitié et une soupeen main et tu posais la question que tout le monde attendait : on mange ? Christine, quela fin de ta thèse est déjà loin ! Mes souvenirs sont assez confus mais je garderai de toil’image d’une personne épanouie. Delphine, ton sourire, ta bonne humeur et tes pasdansants hantent encore les murs du C4.124 ! D’autre part, je pense que tu esresponsable de l’apparition de mes premiers cheveux blancs, mais bon, je te pardonne(lol)… <strong>Gene</strong>viève, la dernière venue. Tu as, à la fin de ma thèse, amener une petitetouche supplémentaire de bonne humeur. Julie, tu es responsable de la plus grandetraîtrise que j’ai eu à subir depuis que je suis né (loup-garou). Je te retiens et gardesecrètement ma revanche… Sinon, je pense que tu es la personne qui me cerne le mieux àl’IRI. Tu vois tout de suite quand je ne suis pas au top et tu as toujours été là pour meremonter le moral. Merci et donne toi à fond pour la fin de ta thèse. Nathalie, tu es lapremière à m’avoir fait découvrir les voyages pas chers (UCPA) et à me montrerReference Manager. Merci. Sandra, je pense que tu possèdes le sourire le plus large del’institut, ce qui fait de toi une personne unique avec qui il est agréable de discuter.Sandrine, tu seras toujours pour moi quelqu’un à deux faces. La première, celle du matin,qui est calme et réservée, et la deuxième, celle du soir, qui jouit d’une explosivité et d’unejoie de vivre à couper le souffle ! Sara, je t’ai connu très timide au début et puis, petit àpetit, tu as pris tes marques pour te faire une place dans le groupe. J’ai appris à teconnaître et ai toujours apprécié ton extrême gentillesse. Sheela, la réservée du groupe.Malgré cela, tu sais exactement ce que tu veux et c’est une qualité que j’apprécieénormément. Nos discussions sur les voyages me manqueront. Wilma, les journées de« franglais » ont été très enrichissantes et je t’en remercie.Vincent et David, vos connaissances en bioinformatique, totalement obscures pour moi,auront été cruciales pour la réalisation de ma thèse. Merci à vous. Vincent, j’admirel’enthousiasme avec lequel tu mènes ta double vie, séparée entre les sciences et le cinéma.Je tiens également à remercier Stéphane S., qui nous rappelait les notions de physiquesélémentaires par des expériences amusantes tout en ayant une banane en bouche,Isabelle, qui m’a suggéré l’une ou l’autre expérience intéressante et Sarah, avec qui jepouvais toujours discuter de n’importe quel sujet. Chantal, je suis impressionné par tarapidité à réaliser des manips et ton envie de toujours rendre service. Mille mercis pourton aide technique.
Je remercie tout particulièrement Stéphane M., qui était le seul de l’IRI avec qui jediscutais de sport ! Tu m’as préparé aux 20 km et m’as permis d’atteindre mes objectifs.Mais bon, je ne suis pas aussi fou que toi car jamais je ne ferai un iron man ! Hakim, ungrand merci pour m’avoir initié aux expériences qRT-PCR malgré ton planningsurchargé. Frédérick, tu es quelqu’un que j’apprécie énormément, d’une part parce que tume rappelles mon chanteur préféré, et d’autre part parce que malgré les nombreuxproblèmes techniques que tu as rencontré, tu ne renonces jamais. Tu es un modèle pourmoi ! Anne, je ne me souviens pas t’avoir vu un seul jour de mauvaise humeur. Tuagrémentais mes passages au 6 ème et je t’en remercie.Merci aussi à Tanja, Séverine, Barbara, Thalie, Maria, Françoise, Agnès, Daniel,Vanessa C., Audrey, Colette, Xavier P., Milutin, Jing, Song, Vanessa V., Xavier D.,Jingwei, Bruno et tous les autres qui ont fait de l’IRI un espace où il fait bon vivre ettravailler.Gerry, I would like to thank you for having given me the opportunity to spend sometime in your lab in Swansea. I have experienced the Welsh culture and have improvedmy English. Many thanks to Sarah and Steve for your kindness and the time you spentshowing me around your country.J’ai également une pensée pour les personnes qui permettent à l’IRI de fonctionnercorrectement. Merci à Claude, Danielle, Joelle, Cathy, Christian, Diana, Johan, Josephet Yves pour avoir apporter leur soutien logistique, informatique ou autre.Je remercie mes parents qui m’ont toujours soutenu et cru en moi tout au long de mesétudes et mes grands-parents qui ont permis la réalisation de mes études universitaires.Ricarda, ta présence à mes côtés depuis maintenant 10 ans m’a permis de m’améliorer etde me remettre en question quand cela était nécessaire. Tu m’as toujours soutenu et tonamour me comble chaque jour de joie.Ce travail a été réalisé grâce aux soutiens financiers du Fond pour la formation à laRecherche dans l’Industrie et l’Agriculture (FRIA) et au Télévie.
RésuméLes tumeurs thyroïdiennes constituent les tumeurs endocrines les plus fréquentes. Parmi celles-ci,on distingue les adénomes, tumeurs bénignes et encapsulées, et les carcinomes, tumeurs malignes.Ceux-ci sont eux-mêmes subdivisés, principalement sur base histologique, en carcinomespapillaires ou folliculaires, qui conservent certaines caractéristiques de différenciation descellules thyroïdiennes initiales dont ils dérivent, et qui peuvent évoluer en carcinomesanaplasiques, totalement dédifférenciés. Les carcinomes différenciés de la thyroïde sontgénéralement de bon pronostic, contrairement aux cancers anaplasiques qui sont nettement plusagressifs, avec un taux de survie à 5 ans inférieur à 5%.La technologie des microarrays permet d’analyser simultanément l’<strong>expression</strong> de milliers degènes dans différentes cellules et différentes conditions physiologiques, pathologiques outoxicologiques. Au cours de cette thèse de doctorat, nous avons déterminé le pr<strong>of</strong>il d’<strong>expression</strong>génique des carcinomes papillaires de la thyroïde à l’aide de la technique des microarrays enutilisant une plateforme contenant plus de 8000 gènes. Douze des 26 cancers papillaires étudiésétaient issus de patients habitant la région de Tchernobyl lors de l’explosion de la centralenucléaire de 1986 et sont considérés comme des cancers radio-induits. Les 14 tumeurs restantesproviennent de patients habitant la France. Leur étiologie n’étant pas connue, ils sont considéréscomme des cancers sporadiques.La réalisation de ces expériences nous a permis d’identifier des signatures moléculaires entre dessous-types de cancers papillaires. Premièrement, nous avons montré que malgré un pr<strong>of</strong>ild’<strong>expression</strong> génique global similaire entre les cancers papillaires sporadiques et radio-induits,une signature multigénique permet de les séparer, indiquant que des subtiles différences existententre les deux types de tumeurs. Deux autres signatures indépendantes, l’une liée aux agentsétiologiques présumés de ces tumeurs (radiation vs. H 2 O 2 ), l’autre liée aux mécanismes derecombinaison homologue de l’ADN, permettent également de séparer les cancers post-Tchernobyl des cancers sporadiques. Nous avons interprété ces résultats comme une différence desusceptibilité à l’irradiation entre ces deux types de tumeurs. D’autre part, nous avons puidentifier une liste de gènes permettant de séparer les cancers papillaires à variante classique desautres sous-types de cancers papillaires. L’analyse de cette liste de gènes a permis de mettre enrelation cette signature avec l’important remodelage de cette variante histologique par rapport auxautres.Ces expériences ont aussi abouti à l’obtention d’une liste de gènes différentiellement exprimésentre les cancers papillaires et leur tissu normal adjacent. Une analyse minutieuse de cette liste àl’aide d’outils statistiques a permis de mieux comprendre la physiopathologie de ces tumeurs etd’aboutir à différentes conclusions : (1) un changement de population cellulaire est observé, avecune sur<strong>expression</strong> de gènes liés à la réponse immune, reflétant l’infiltration lymphocytaire de cestumeurs par rapport au tissu normal adjacent (2) la voie de signalisation JNK est activée parsur<strong>expression</strong> de ses composants (3) la voie de signalisation de l’EGF, également par unesur<strong>expression</strong> de ses composants, complémente les altérations génétiques des cancers papillairespour l’activation constitutive de la voie ERK1/2 (4) une sous<strong>expression</strong> des gènes de réponseprécoce est observée (5) une sur<strong>expression</strong> de nombreuses protéases, d’inhibiteurs de protéases etde protéines de la matrice extracellulaire permet d’expliquer l’important remodelage des cancerspapillaires (6) le pr<strong>of</strong>il d’<strong>expression</strong> génique des cancers papillaires peut être corrélé avec unmode de migration collectif de ces tumeurs.Finalement, dans la dernière partie de la thèse, nous avons déterminé le pr<strong>of</strong>il d’<strong>expression</strong>génique des cancers anaplasiques de la thyroïde et l’avons comparé à celui des cancers papillaires.Nous avons montré que les deux types de tumeurs présentent des pr<strong>of</strong>ils moléculaires globauxdistincts, reflétant leur comportement tumoral très différent.
AbbreviationsAIT apical I - transporterAPS ammonium persulfateATC anaplastic thyroid carcinomaATF-1 activating transcription factor-1BrdU bromodeoxyuridineBSA bovin serum albumincAMP cyclic adenosin 3’, 5’-monophosphateCRE cAMP responsive elementCREB CRE-binding proteinCREM cAMP responsive element modulatorDAG 1, 2 diacylglycerolDAVID database for annotation, visualizationand integrated discoveryDIT 3,5-diiodotyrosinesDTC differentiated thyroid carcinomaDTT 1,4-dithiotreitolECM extracellular matrixEGF epidermal growth factorERK extracellular signal-regulated kinaseFAP familial adenomatous polyposisFBS fœtal bovin serumFdU fluorodeoxyuridineFGF fibroblast growth factorFISH fluorescent in situ hybridizationFNAC fine-needle aspiration cytologyFOXO forkheadFTC follicular thyroid carcinomaFVPTC follicular variant <strong>of</strong> PTCGAB GRB2-associated binding proteinGEF guanine nucleotide-exchange factorGO gene ontologyGPCR receptors coupled to G-proteinsGPLS generalized partial least squareGRB2 growth-factor-receptor-bound-2HGF hepatocyte growth factorIEGs immediate early genesIGF insulin growth factorIGF-1 insulin like growth factorIP3 inositol 1, 4, 5 triphosphateIPTG isopropyl β-D-1-thiogalactopyranosideJNK c-jun N-terminal kinasekDa kilo DaltonLKSVM linear kernel support vector machinesLNM lymph node metastasesLZ leucine zipperMAPK mitogen-activated protein kinasesMDS Multidimensional scalingMIT 3-monoiodotyrosinesMKK MAPK kinaseMKKK MAPK kinase kinaseNIS Na + /I - symporterPA pool <strong>of</strong> adjacent tissuePAI plasminogen activator inhibitorPAM prediction analysis <strong>of</strong> microarraysPBS Phosphate Buffered SalinePBST PBS tweenPDGF platelet-derived growth factorPDK1 phosphatidylinositol-dependentkinasePI3K Phosphatidylinositol-3-kinasePIP2 phosphatidylinositol-4,5-biphosphatePKB proteine kinase BPLC phospholipase CPTC papillary thyroid carcinomaPtdIns(3,4,5)P 3 phosphatidylinositol-PTEN phosphatase with tensin homologyRF random forestRT room temperatureRTK tyrosine kinase receptorSAM Statistical Significance <strong>of</strong> MicroarraySDS sodium dodecyl sulfateSFK Src family kinaseSH2 Src Homology 2SNPs single nucleotide polymorphismsSOS son-<strong>of</strong>-sevenlessT3 triiodothyroninT4 tetraiodothyroninTBS tris buffered salineTBST TBS tweenTEMED tetra methyl ethylene diamineTg thyroglobulinThOX thyroid oxydaseTIMP tissue inhibitor for metalloproteinasesTPA 12-O-tetradecanoylphorbol-13-acetatetPA tissue-type plasminogen activatorTPO thyroperoxidaseTRH Thyrotropin Releasing HormoneTSH thyroid stimulating hormoneTSHR thyroid stimulating hormone receptoruPA urokinase-type plasminogen activatorWHO World health organizationXGAL 5-bromo-4-chloro-3-indolyl-b-Dgalactopyranoside
Table <strong>of</strong> contentsTABLE OF CONTENTS ................................................................................................. 1CHAPTER I. INTRODUCTION .................................................................................... 4I. SIGNALING CASCA<strong>DE</strong>S INVOLVED IN PHYSIOLOGICAL AND PATHOLOGICALCONDITIONS: GENERALITIES.......................................................................................... 4I.1 Receptors............................................................................................................... 5I.1.1 Receptors with a tyrosine kinase activity ....................................................... 5I.1.2 Receptors coupled to G-proteins (GPCR) ...................................................... 6I.2 Second messengers ............................................................................................... 7I.2.1 Second messengers derived from phosphatidylinositol-4,5-biphosphate....... 7I.2.2 Cyclic AMP .................................................................................................... 7I.3 Downstream signal transduction pathways......................................................... 8I.3.1 The PI3K/Akt signaling pathway ................................................................... 8I.3.2 Signaling cascade induced by cAMP ............................................................. 9I.3.3 The mitogen-activated protein kinase signaling pathways........................... 10I.3.3.1 The ERK1/2 signaling pathway ............................................................. 11I.3.3.2 The JNK signaling pathway................................................................... 12I.3.3.3 The p38 MAPKs signaling pathway ...................................................... 12I.4 Nuclear responses: example <strong>of</strong> the transcription factors AP1 ......................... 13II. THE TUMORIGENESIS PROCESS............................................................................ 14II.1 Introduction....................................................................................................... 14II.2 The multistep process <strong>of</strong> tumorigenesis ........................................................... 14II.3 Behavior <strong>of</strong> metastatic cells.............................................................................. 15II.3.1 <strong>Gene</strong>ral view ............................................................................................... 15II.3.2 Processes involved in tumoral invasion ...................................................... 16II.3.2.1 ECM remodelling ................................................................................. 16II.3.2.2 Diversity <strong>of</strong> tumor invasion mechanisms ............................................. 17II.3.2.3 Integrin signaling ................................................................................. 18III. THE THYROID GLAND ....................................................................................... 20III.1 Introduction..................................................................................................... 20III.2 Thyroid hormone synthesis............................................................................. 21III.3 Regulation <strong>of</strong> the thyroid cell.......................................................................... 22III.4 Control <strong>of</strong> thyroid-specific gene <strong>expression</strong>................................................... 23III.5 Control <strong>of</strong> growth and differentiation ............................................................ 23IV. THYROID TUMORS ............................................................................................ 25IV.1 Introduction ..................................................................................................... 25IV.2 The autonomous thyroid adenomas................................................................ 26IV.3 The thyroid carcinomas................................................................................... 26IV.3.1 Differentiated Thyroid Carcinomas (DTC) ............................................... 27IV.3.1.1 Papillary thyroid carcinomas ............................................................. 28IV.3.1.2 Follicular thyroid carcinoma (FTC)................................................... 291
IV.3.2 Anaplastic thyroid carcinoma (ATC) ........................................................ 30IV.3.3 Medullary thyroid carcinoma (MTC) ........................................................ 31IV.4 The multi-step process <strong>of</strong> thyroid carcinogenesis........................................... 31IV.5 Etiology <strong>of</strong> thyroid cancers.............................................................................. 32IV.6 <strong>Gene</strong>tic alterations commonly found in thyroid cancers ............................... 33IV.6.1 Chromosomal rearrangements................................................................... 33IV.6.1.1 The RET/PTC rearrangement ............................................................. 33IV.6.1.2 Rearrangements involving TRK .......................................................... 35IV.6.1.3 The AKAP9-BRAF fusion.................................................................... 35IV.6.1.4 PAX8-PPARγ rearrangement.............................................................. 36IV.6.2 Point mutations .......................................................................................... 36IV.6.2.1 The BRAF mutations ........................................................................... 36IV.6.2.2 RAS mutations ..................................................................................... 37IV.6.2.3 p53 mutations...................................................................................... 38IV.6.2.4 β-catenin mutations............................................................................. 38IV.6.3 Constitutive activation <strong>of</strong> the MAPK in PTCs .......................................... 39IV.6.4 Mutations along the PI3K/Akt signaling pathway in thyroid tumors........ 40V. THE MICROARRAY TECHNOLOGY........................................................................ 41V.1 Principle............................................................................................................. 41V.2 Analysis <strong>of</strong> microarray data.............................................................................. 42V.2.1 Unsupervised methods ................................................................................ 43V.2.2 Supervised methods .................................................................................... 43CHAPTER II. AIM OF THE WORK........................................................................... 45CHAPTER III. RESULTS ............................................................................................. 47I. <strong>DE</strong>VELOPMENT AND OPTIMIZATION OF A RNA AMPLIFICATION PROTOCOL BY INVITRO TRANSCRIPTION AND ITS COMBINATION WITH MICROARRAY EXPERIMENTS .. 47I.1 Optimization <strong>of</strong> an RNA amplification protocol ............................................... 47I.2 Combination <strong>of</strong> an amplification protocol with a cDNA labelling protocol.... 48I.3 Validation <strong>of</strong> our protocol.................................................................................. 49I.4 Conclusion .......................................................................................................... 50II. THYROID CDNA LIBRARY CONSTRUCTION ......................................................... 51III. I<strong>DE</strong>NTIFICATION OF POTENTIAL MOLECULAR SIGNATURES RELATED TOCLINICAL DATA OF PTC............................................................................................... 54III.1 Characterization <strong>of</strong> the molecular signature discriminating the classicalpapillary variant from the other forms <strong>of</strong> PTC....................................................... 54III.2 Sporadic and post-Chernobyl PTC are distinguishable on the basis <strong>of</strong> asubset <strong>of</strong> genes.......................................................................................................... 56IV. GENE EXPRESSION AND THE BIOLOGICAL PHENOTYPE OF PAPILLARYTHYROID CANCER ......................................................................................................... 65V. STUDY OF THE INTEGRIN SIGNALING PATHWAY IN PTC .................................... 76V.1 <strong>Gene</strong> <strong>expression</strong> <strong>pr<strong>of</strong>iles</strong> revealed a high proportion <strong>of</strong> genes involved inintegrin signalling cascade ...................................................................................... 76V.2 Expression <strong>of</strong> focal adhesion kinase in PTC ................................................... 77V.3 Conclusion......................................................................................................... 792
VI. INVESTIGATION OF THE EXISTENCE OF POTENTIAL PARACRINE FACTORSSECRETED BY TPC1 CELLS AND STIMULATING THE PROLIFERATION OF PCCL3CELLS.. .......................................................................................................................... 80VI.1 Principle <strong>of</strong> the experiments............................................................................ 80VI.2 Preparation <strong>of</strong> mediums .................................................................................. 80VI.2.1 Preparation <strong>of</strong> control 2H medium ............................................................ 81VI.2.2 Preparation <strong>of</strong> 2H medium containing the potential paracrine factors...... 81VI.2.3 Experiment allowing to obtain quiescent PCCL3 cells ready to bestimulated.............................................................................................................. 82V.3 Cell proliferation measurements....................................................................... 83The BrdU incorporation experiments were performed 4 times. Results are shownbelow......................................................................................................................... 83VI.4 Conclusion ....................................................................................................... 84VII. STUDY OF THE GENE EXPRESSION PROFILE OF ATCS..................................... 86CHAPITRE IV. GENERAL DISCUSSION AND PERSPECTIVES........................ 89CHAPTER V. MATERIAL AND METHODS............................................................ 94I. MATERIAL ............................................................................................................ 94I.1 Cell lines.............................................................................................................. 94I.2 Culture mediums ................................................................................................ 94I.3 Solutions ............................................................................................................. 95I.3.1 Protein extraction and quantification............................................................ 95I.3.2 Western blotting ........................................................................................... 96I.3.3 Silver nitrate staining.................................................................................... 98II. METHODS.............................................................................................................. 99II.1 Proteins manipulations..................................................................................... 99II.1.1 Extraction and quantification <strong>of</strong> proteins.................................................... 99II.1.2 Western blotting ........................................................................................ 100II.1.3 Silver Nitrate staining................................................................................ 100II.2 Cell lines manipulations ................................................................................. 101II.2.1 Trypsinisation............................................................................................ 101II.2.2 Bromodeoxyuridine staining and indirect immun<strong>of</strong>luorescence .............. 101II.3 Microarray analyses ....................................................................................... 102II.3.1 Experiments on Agilent cDNA Microarray slides .................................... 102II.3.2 Experiments on Affymetrix slides............................................................. 103II.4 Real-time RT-PCR experiments ..................................................................... 103CHAPTER VI. BIBLIOGRAPHY.............................................................................. 1053
Chapter I : Introduction
Chapter I : IntroductionChapter I. IntroductionI. Signaling cascades involved in physiological and pathological conditions:generalitiesSurvival <strong>of</strong> a multicellular organism depends <strong>of</strong> a wide network <strong>of</strong> intercellularcommunications that coordinates growth, differentiation and metabolism <strong>of</strong> the numerouscells forming tissues and organs. Incapacities to regulate these functions can lead to analtered phenotype, and eventually to cancer.Two types <strong>of</strong> cell communication exist. Specialized junctions in the plasma membraneenable exchanges <strong>of</strong> small molecules and coordination <strong>of</strong> the metabolism betweenadjacent cells. However, this type <strong>of</strong> communication is only possible between closed cells.In order to able communication between distant cells, extracellular messenger moleculesare synthesized and secreted by some cells, and reach target cells where they trigger aspecific response through a signaling cascade. Only cells possessing specific receptors forthese molecular mediators will be able to respond to the signal.Communication by extracellular molecules can be globally represented in two steps.Firstly, an extracellular signal binds and activates a transmembrane receptor. Then, thisreceptor activates multiple signaling proteins in cascade, which finally reach the nucleusin order to induce modifications in gene <strong>expression</strong> leading to cellular responses.Different classes <strong>of</strong> proteins are responsible for this signal transduction: receptors thatreceive the signal, second messengers (such as cAMP, DAG, IP3, Ca ++ ) which amplifythe signal, adaptors which distribute it, and effectors which induce the cellular responses.This mechanism is simplified when the external signal can directly activate atranscription factor (nuclear receptor) or when the receptor directly activates effectors(for instance by phosphorylation). Because the cellular responses <strong>of</strong> some signalingpathways are crucial for proliferation and differentiation, genetic alterations occurringalong these cascades in these different classes <strong>of</strong> proteins can lead to differentpathologies.4
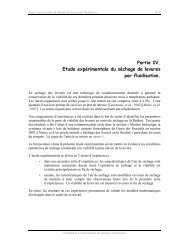
Figure 1. Activation <strong>of</strong> Ras by a receptor tyrosine kinase (here EGF). From «Molecular Cell Biology » by Baltimore et al. 1996.
Chapter I : IntroductionMultiple signaling cascades have been described and their use and functions varyaccording to the cell types. Therefore, in this thesis, we will only describe receptors,second messengers and signaling cascades related to cancer cells, and focus on thyroidcarcinogenesis.I.1 ReceptorsMost <strong>of</strong> the extracellular signals (growth factors, cytokines, hormones, …) are usuallyrecognized by cells through transmembrane receptors. These proteins display at theextracellular side the binding site for the growth factor or hormone and in the cytoplasmthe domains responsible for intracellular signaling. Other membrane receptors are ionicchannels, such as the nicotinic receptor <strong>of</strong> acetylcholine. Binding <strong>of</strong> the ligand to thesereceptors enables an opening <strong>of</strong> the channel, triggering an ions flow throughout the cell.Finally, some ligands are small hydrophobic molecules that diffuse throughout theplasma membrane. These include steroid hormones such as androgens and estrogens.Once entered in the cell, these molecules bind intercellular receptors <strong>of</strong> the steroid familywhich act as transcription factors to modulate gene <strong>expression</strong> 1 .I.1.1 Receptors with a tyrosine kinase activityTyrosine kinase receptors (RTKs) are receptors displaying an intrinsic catalytic activityin the intracellular part <strong>of</strong> their sequence and act as enzyme when they are activated bytheir ligand. Epidermal growth factor (EGF), fibroblast growth factor (FGF), hepatocytegrowth factor (HGF), platelet-derived growth factor (PDGF), insulin like growth factor(IGF-1) and insulin belong to the family <strong>of</strong> growth factors that bind a RTK. Thesereceptors share a common structure: an extracellular N-terminal domain that binds theligand, a transmembrane α-helix and a cytosolic C-terminal domain with the tyrosinekinase activity 2 . The insulin receptor and IGF-1 receptor are dimers constituted by 2extracellular α-chains, each linked by a disulfur binding to a β-chain that crosses themembrane and carries the tyrosine kinase activity 3 .5
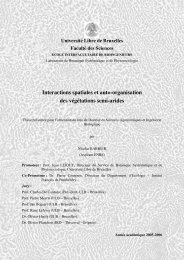
Figure 2. Adenylyl cyclase activation by stimulation <strong>of</strong> a receptor coupled to G protein,such as the TSH receptor. From « Molecular Cell Biology » by Baltimore et al. 1996.
Chapter I : IntroductionThe first step <strong>of</strong> the binding process for most <strong>of</strong> these RTKs is the dimerization <strong>of</strong> thereceptor induced by the ligand 4 (Figure 1). For the insulin receptor, rather than adimerization, ligand binding triggers an interaction between both cytoplasmic β-chains.The dimerization leads to the autophosphorylation <strong>of</strong> the receptor on different tyrosineresidues in the intracellular region 5 . These phosphorylations increase the activity <strong>of</strong> thereceptor and create specific binding sites for proteins such as phospholipase Cγ (PLCγ),phosphatidylinositol-3-kinase (PIP3K) and adaptor proteins (i.e GRB2, Shc, …).Interactions <strong>of</strong> these proteins with receptors are mediated by specific domains whichspecifically bind peptides containing these phosphotyrosines. The best characterized <strong>of</strong>these domains is the SH2 domain (Src Homology 2 domain) constituted <strong>of</strong> about 100amino acids. Association <strong>of</strong> proteins containing SH2 domains and receptor leads torecruitment <strong>of</strong> other proteins and activation <strong>of</strong> downstream signaling pathways.I.1.2 Receptors coupled to G-proteins (GPCR)These receptors are characterized by 7 transmembrane α-helixes with an extracellular N-terminal domain and a cytosolic C-terminal domain. Binding <strong>of</strong> the ligand to theextracellular domain triggers a conformational modification which enables the cytosolicdomain to bind to a G-protein associated with the internal face <strong>of</strong> the plasma membrane(Figure 2). Three subunits constitute a G-protein: α, β and γ. The α-subunit binds to theguanylic nucleotides that regulate the activity <strong>of</strong> the G-protein. When the receptor is notstimulated, the α-subunit <strong>of</strong> the G-protein binds GDP. After ligand stimulation,interaction between the cytosolic domain <strong>of</strong> the receptor and the G-protein leads to theexchange <strong>of</strong> GDP by GTP and the dissociation <strong>of</strong> the α- and β/γ subunits. The respectivesubunits then interact with their target proteins. These proteins are effectors such asadenylyl cyclase, Ras, PI3K, phospholipase Cβ and A2. Activity <strong>of</strong> the α-subunit ends byGTP hydrolysis and reassociation between the GDP-α subunit and the β/γ subunits.Different is<strong>of</strong>orms <strong>of</strong> each subunit have been described, leading to a wide variety <strong>of</strong> G-protein with different effects 6 .6
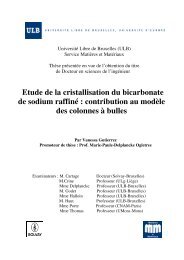
RCGPProteinsphosphorylationCa 2+ release fromendoplasmic reticulumFigure 3. The phosphatidylinositol-4,5-biphosphate cascade. Adapted from «Molecular Biology <strong>of</strong> the cell » by Alberts et al. 1994.Figure 4. From Cully et al, 2006. PI3K can be activated by at least three different ways, all <strong>of</strong> whichstart with activation <strong>of</strong> the RTKs by ligand binding. In one PI3K activation pathway, thanks to its SH2domains, the 85 kDa regulatory subunit (p85) binds directly the cytosolic domain <strong>of</strong> the RTK, triggeringactivation <strong>of</strong> the p110 catalytic subunit (left side <strong>of</strong> the diagram). Other PI3K signaling pathwaysdepend on the adaptor protein GRB2, which also binds RTKs. In the right pathway <strong>of</strong> the diagram,GRB2 binds to the scaffolding protein GAB, which in turn can bind p85. Finally, GRB2 can also exist ina large complex that contain both SOS, Ras, and GAB or other scaffolding proteins, bringing theactivators into close proximity with p110 PI3K.
Chapter I : IntroductionI.2 Second messengersI.2.1 Second messengers derived from phosphatidylinositol-4,5-biphosphateMany signaling pathways use second messengers derived from the phospholipidphosphatidylinositol-4,5-biphosphate (PIP2). PIP2 is a minor component <strong>of</strong> the plasmamembrane localized in the internal layer. A wide variety <strong>of</strong> hormones and growth factorsstimulate hydrolysis <strong>of</strong> PIP2 by phospholipase C (PLC). This reaction produces twosecond messengers, diacylglycerol (DAG) and inositol-1,4,5-triphosphate (IP3) 7 (Figure3).Hydrolysis <strong>of</strong> PIP2 is activated by receptors coupled to G-proteins and by RTKs. Indeed,PLCβ is stimulated by G-proteins 8 whereas PLCγ displays SH2 domains that enableassociation with activated RTKs 9 . This interaction with RTK leads to its phosphorylationand increases its catalytic activity (Figure 3).DAG produced by hydrolysis <strong>of</strong> PIP2 activates the PKC family <strong>of</strong> serine/threoninekinases, that plays a major role in the control <strong>of</strong> growth and differentiation byphosphorylation <strong>of</strong> different proteins such as MEKK, Raf-1, EGFR 10 . While DAG staysassociated to the plasma membrane, IP3, the second messenger induced by hydrolysis <strong>of</strong>PIP2, is released in the cytosol where it induces Ca + release from intracellular stocks.This increased rate <strong>of</strong> Ca + modulates the activity <strong>of</strong> many proteins such as kinases andphosphatases, <strong>of</strong>ten through another protein, calmodulin.Finally, PIP2 is also the starting point <strong>of</strong> a signaling cascade that plays a key role in thesurvival <strong>of</strong> cells. In this cascade, PIP2 is phosphorylated by phosphatidylinositol-3-kinase(PI3K) leading to the formation <strong>of</strong> phosphatidylinositol-3,4,5-triphosphate((PtdIns(3,4,5)P 3 ) which act as a second messenger 11 (see §I.3.1 <strong>of</strong> introduction).I.2.2 Cyclic AMPAccording to the cell type, cyclic adenosine 3’,5’-monophosphate (cAMP) controlsproliferation, differentiation, secretion or cell adhesion 12 . Although in the 1970s cAMPwas considered as a negative regulator <strong>of</strong> proliferation, it is now well known that it7
Growth factorPTENExtracellular spaceRTKGRB2PIP2PI3KPIP3PDK1SOSRasRafGSK3PKBBADMEK1/2ERKCytosolNucleusERKFOXO1PKBFOXO3AFOXO4TranscriptionTranscriptionProliferationApoptosisCell-cycle arrestFigure 5. Schematic and simplified view <strong>of</strong> the PI3K/Akt and ERK signaling networksleading to cell survival and proliferation.
Chapter I : Introductionproduces a mitogenic effect from hormones and neurotransmettors in some epithelialcells such as dog and human thyrocytes, epithelial mammal cells and melanocytes 13-15 .On the other hand, cAMP inhibits proliferation <strong>of</strong> fibroblasts, macrophages andastrocytes 15 .cAMP is synthesized from ATP through the action <strong>of</strong> adenylyl cyclase and can bedegraded by phosphodiesterases 16 (Figure 2). At least ten different adenylyl cyclases havebeen identified. All are activated by the αs subunit <strong>of</strong> the Gs-protein and most <strong>of</strong> them areinhibited by the αi subunit <strong>of</strong> the Gi-protein. Some are activated whereas others areinhibited by the βγ complex <strong>of</strong> Gs or Gi. Their activity can also be modulated by calciumand by phosphorylation through PKC and PKA 17 .I.3 Downstream signal transduction pathwaysI.3.1 The PI3K/Akt signaling pathwayThe phosphatidyl inositol 3-kinase (PI3K)/Akt pathway is activated downstream <strong>of</strong> avariety <strong>of</strong> extracellular signals and activation <strong>of</strong> this signaling pathway impacts a number<strong>of</strong> cellular processes including cell growth, proliferation and survival. The alteration <strong>of</strong>components <strong>of</strong> this pathway, through either activation <strong>of</strong> oncogenes or inactivation <strong>of</strong>tumor suppressors, disrupts a signaling equilibrium and can thus lead to tumorigenesis 18 .Three classes <strong>of</strong> phosphatidylinositol-3-kinase (PI3K) have been described, based on thehomology <strong>of</strong> their sequence, their substrate preference and their regulation. Class I is thebest characterized and includes enzymes phosphorylating PIP2. It is also the only classinvolved in carcinogenesis. Members <strong>of</strong> this class are heterodimers composed by acatalytic subunit <strong>of</strong> 110 kDa (p110) and a regulatory subunit <strong>of</strong> 85 kDa (p85).The phosphatidylinositol-3-kinase (PI3K) signaling pathway starts with PI3K activationby RTKs (Figure 4). PI3K activity phosphorylates and converts the second messengerPIP2 into PIP3, which recruits and activates phosphatidylinositol-dependent kinase 1(PDK1) (Figure 5). PDK1 in turn phosphorylates and activates protein kinase B (PKB,also known as AKT), which phosphorylates different substrates playing crucial roles in8
cytosolnucleusAdenylylcyclasecAMPGPCRFigure 6. The cAMP signaling cascade. Adapted from « Molecular Cell Biology » fromBaltimore et al. 1996.
Chapter I : Introductioncell-cycle regulation and survival. This includes inhibition <strong>of</strong> the forkhead (FOXO)transcription factors which are mediators <strong>of</strong> apoptosis and cell-cycle arrest, resulting incell proliferation and survival 18 . Another PKB target is BAD (pro-apoptotic proteinBCL2-antagonist <strong>of</strong> cell death) which binds 14-3-3 proteins after phosphorylation,sequestering it in the cytoplasm and preventing its pro-apoptotic effects 19 . PKB mightalso indirectly stabilize the cell-cycle proteins c-Myc and cyclin D1 through theinhibition <strong>of</strong> GSK3, leading to proliferation 19 . The tumor-suppressor phosphatase withtensin homology (PTEN) negatively regulates PI3K signaling by dephosphorylating PIP3,converting it back to PIP2 (Figure 5).I.3.2 Signaling cascade induced by cAMPRegulation <strong>of</strong> gene <strong>expression</strong> by cAMP plays a crucial role in the control <strong>of</strong> proliferation,survival and differentiation in a large variety <strong>of</strong> cells.cAMP can directly regulate CNG ionic channels (Cyclic Nucleotide-Gated) found inolfactory neurons in brain and in some non neuronal tissues 20,21 . It also activates EPACwhich itself activates Rap1. Nevertheless, the majority <strong>of</strong> cAMP effects are transmittedby PKA (cAMP-dependent protein kinase). The inactive form <strong>of</strong> PKA is a tetramerconstituted by 2 catalytic and 2 regulatory subunits, respectively called C and R subunits.cAMP binds to R subunits, triggering a conformational modification leading to thedissociation <strong>of</strong> the C subunits (Figure 6). The active free C subunits subsequentlyphosphorylate serine and threonine residues <strong>of</strong> their target proteins. Increasing cAMPlevels activate the transcription <strong>of</strong> target genes that contain a specific regulatory sequencecalled CRE (cAMP Responsive Element). In this case, the signal is transmitted from thecytoplasm to the nucleus by the C subunit <strong>of</strong> PKA which can enter into the nucleus. Csubunits can then phosphorylate the transcription factors <strong>of</strong> the CREB family, such asCREB (CRE-binding protein), CREM (cAMP responsive element Modulator) and ATF-1(Activating transcription factor-1), leading to the activation or the repression <strong>of</strong> cAMPinducible-genes 22,23 (Figure 6). Phosphorylation <strong>of</strong> CREB on serine 133 by PKA isrequired for its interaction with CBP/p300 (CREB-binding protein), a coactivator thatinteracts with many transcription factors and carrying a histone acetyl transferase9
DrugsCytokinesUVO2-EnvironmentAntigensToxinsColdGrowth factorsECMIntegrinGPCRRTKRasCytoskeletonCytoplasmA RafTpl2B RafMosC RafLZKASK1MLK1MLK3MLK2DLKMEKK1MEKK2MEKK3MEKK4ASK2TAO1TAO2TAK1TAO3MAP3KMEK1MEK2MEK7MEK4MEK3MEK6MAP2KERK1ERK2JNK1JNK2p38αp38βJNK3p38γp38γMAPKNucleusCellular responseFigure 7. Integration <strong>of</strong> the MAPK pathway in the cellular response to environmental stimuli,schematic view. Adapted from Dhanasekaran and Johnson, 2007.
Chapter I : Introductionactivity 23 . Different is<strong>of</strong>orms <strong>of</strong> members <strong>of</strong> the CREB family have been described andare mainly produced by alternative splicing. Some <strong>of</strong> them act as activators (CREMτ,CREB, ATF-1) and others as repressors (CREMα, β γ and CREB-2).I.3.3 The mitogen-activated protein kinase signaling pathwaysThe mitogen-activated protein kinases (MAPKs) are generally expressed in all cell types,yet they function to regulate specific responses that differ from cell type to cell type.These cascades are intensely studied, especially the extracellular signal-regulated kinases(ERK) 1/2, the c-jun N-terminal kinase (JNK) 1, 2, 3 and the p38 kinase (p38α, β, γ andδ). Reasons for such intensive studies are explained by involvement <strong>of</strong> MAPKs in thecellular responses to almost all stimuli. In general, the ERK subfamily is mainly activatedby growth factors, p38 by stress factors and JNK are activated by stress- and growthfactors24 . MAPK family is conserved in evolution and is involved in diverse cellularprocesses including proliferation, apoptosis, survival, migration and development.The MAPK signaling cascades are now well-known. The aim <strong>of</strong> the current intensiveresearches is now to understand how MAPKs, which can be activated by a plethora <strong>of</strong>stimuli, can have highly specific biological functions. The answer is in part related to thespatio-temporal regulation <strong>of</strong> MAPKs within cells. MAPKs transmit signals by sequentialphosphorylation events. The phospho-relay system is composed <strong>of</strong> three kinase modules(Figure 7): MAPKs are phosphorylated and activated by MAPK kinases (MKKs orMAP2Ks); MAPK kinase kinases (MKKKs or MAP3Ks) phosphorylate and activateMKKs 25 . Note that additional kinases may also be required upstream <strong>of</strong> this three-kinasemodule. Whereas there are at least 11 MAPKs, there are only 7 MKKs, but at least 20MKKKs. The different regulatory domains and motifs encoded in the different MKKKsselectively control localization, activation and inactivation <strong>of</strong> associated MKKs andMAPKs. In addition, scaffold proteins such as kinase suppressor <strong>of</strong> Ras, β-arrestin andthe JNK-interacting proteins organize MAPK modules in complexes with other proteins,control trafficking and subcellular location and duration <strong>of</strong> MAPK signaling 26 . Thus, therole <strong>of</strong> MKKKs in regulation <strong>of</strong> specific MAPKs and the organization <strong>of</strong> signaling10
Chapter I : Introductioncomplexes by scaffolding proteins are two key elements providing a combinatorialdiversity for the integration <strong>of</strong> cellular networks in the cellular response to stimuli.Given the role <strong>of</strong> MAPKs as important mediators <strong>of</strong> cellular responses to so manyextracellular signals, it is not surprising that loss <strong>of</strong> fine control <strong>of</strong> MAPK regulationresulting from mutations (such as activating Ras or Raf mutations), or changes in<strong>expression</strong> <strong>of</strong> proteins regulating MAPK signaling (such as EGF receptor over<strong>expression</strong>),contribute to cancer.I.3.3.1 The ERK1/2 signaling pathwayERK1 and ERK2, sharing 83% identity, are ubiquitously expressed and are involved inmany cellular responses such as cell motility, proliferation, differentiation and survival 24 .They are activated to varying extents by growth factors, serum, phorbol esters, cytokines,osmotic and other cell stresses 24,25 . Nevertheless, the most well defined signalingpathway from the cell membrane to ERK1/2 is that used by RTKs. Phosphorylation <strong>of</strong>these receptors results in the formation <strong>of</strong> multiprotein complexes whose organizationdictates further downstream signaling events. A major function is the activation <strong>of</strong> themonomeric G protein Ras, achieved by the recruitment <strong>of</strong> adaptator proteins such as Shcand Grb2 (Figure 1). SOS then becomes engaged with the complex and induces Ras toexchange GDP for GTP. GTP-liganded Ras is able to interact with a number <strong>of</strong> effectors,including Raf is<strong>of</strong>orms. Ras binding to Raf results in conformational changes in Raf thatincrease its kinase activity. The increase in Raf activity leads to the phosphorylation <strong>of</strong>MEK1 and 2, the two MKKs that specifically phosphorylate and activate ERK1/2 (Figure7).Activated ERK1/2 may phosphorylate proteins involved in cell attachment and migrationsuch as paxillin and focal adhesion kinase (FAK). ERK1/2 can also enter in the nucleusand phosphorylate transcription factors such as Elk1, c-fos and c-myc 24 .11
Chapter I : IntroductionI.3.3.2 The JNK signaling pathwayThe JNK are encoded by three genes: JNK1/SAPKβ, JNK2/SAPKα, JNK3/SAPKγ. Theproteins share more than 85% <strong>of</strong> identity and more than 10 spliced forms have beendescribed. JNK1 and JNK2 are expressed ubiquitously. In contrast, JNK3 has a morelimited pattern <strong>of</strong> <strong>expression</strong> and is restricted to brain 24,27 .The c-jun N-terminal kinase (JNK) pathway is activated primarily by cytokines andexposure to environmental stress. Phosphorylation <strong>of</strong> transcription factors, such as c-jun,JunB, JunD and ATF2 by JNK causes increased transcriptional activity. In each case, thesites <strong>of</strong> phosphorylation correspond to motifs located in the activation domain <strong>of</strong> thetranscription factor. Activation <strong>of</strong> these transcription factors regulates the <strong>expression</strong> <strong>of</strong>specific sets <strong>of</strong> genes that mediate cell proliferation, differentiation or apoptosis. JNKproteins are involved in cytokine production, inflammatory response, stress-inducedapoptosis, actin reorganization and metabolism 24,27 .The JNK are activated by phosphorylation by 2 MKKs, MEK4 (MKK4) and MEK7(MKK7). In certain conditions, these two proteins may also activate the p38 pathway.These two MKKs are activated by a large group <strong>of</strong> MKKKs, such as the MEKK group (1to 4), the ASK group (ASK1 and ASK2, also known as MAP3K5 and MAP3K6,respectively) and the mixed-lineage protein kinase group (MLK1-3, DLK and LZK)(Figure 7). Different ways can lead to activation <strong>of</strong> MKKKs: Rho proteins may mediatethe activation <strong>of</strong> JNK caused by RTKs while activation <strong>of</strong> JNK by cytokine receptorsappears to be mediated by the TRAF group <strong>of</strong> adaptator proteins. It is also shown that theadaptator protein Nck and the Ste20-like protein kinase NIK may mediate JNK activationby Eph receptors 27 .I.3.3.3 The p38 MAPKs signaling pathwayThe p38 family includes four members (α, β, γ, δ) and responds to a wide range <strong>of</strong>extracellular stimuli, particularly cellular stresses, such as UV radiation, osmotic shock,hypoxia, pro-inflammatory cytokines and less <strong>of</strong>ten growth factors.12
Chapter I : IntroductionThe MKKs MEK3 and MEK6 may both be required for maximal activation <strong>of</strong> p38.MEK3 and MEK6 are activated by numerous MKKKs, including MEKK1-4, TAO group(1 to 3) and TAK1. Activation <strong>of</strong> the transcription factors by the p38 family mediates cellproliferation, differentiation, development and response to stress (Figure 7).I.4 Nuclear responses: example <strong>of</strong> the transcription factors AP1Signaling cascades usually lead to activation <strong>of</strong> transcription factors inside the nucleus.For instance, quiescent cells exposed to serum or growth factors lead to a fast and usuallytemporary transcription <strong>of</strong> genes called “immediate early genes” (IEGS) 28,29 . AmongIEGs, a very well known family is the family <strong>of</strong> the nuclear proto oncogenes fos and jun.The fos family includes c-fos, fosB, fra-1 and fra-2 and the jun family includes c-jun,junB and junD. Jun proteins have the possibility to homodimerize or heterodimerize withone member <strong>of</strong> the fos family to form the transcription factors AP-1 30 . Members <strong>of</strong> fosfamily cannot homodimerize. Binding between these proteins are mediated byhydrophobic interactions between their leucine zippers domain (LZ). A basic region inthe complex enables the binding to the consensus DNA sequence TGACTCA called TRE(TPA responsive element) 31,32 .AP-1 complexes are activated by many stimuli, such as mitogenic growth factors,inflammatory cytokines, UV and radiations or other cellular stresses 33 . For instance,ERK1/2 can induce phosphorylation <strong>of</strong> the Elk1/TCF transcription factor, that stimulatesthe transcription <strong>of</strong> c-fos by binding to a SRE (Serum Response Element) localized in thepromoter <strong>of</strong> c-fos. This leads to an increase <strong>of</strong> the AP-1 complexes activity 34,35 . Activity<strong>of</strong> AP-1 complexes can also be stimulated by the phosphorylation <strong>of</strong> jun by the JNK 36 .AP-1 complexes bind the consensus DNA sequence TRE in the regulatory region <strong>of</strong> alarge variety <strong>of</strong> genes usually important for cellular growth, such as interleukin 2, TGFβ,c-jun or cyclin D1 30 . It can also bind DNA sequences called CRE (Cyclic AMPresponsive element), normally recognized by proteins <strong>of</strong> the CREB family.13
Chapter I : IntroductionII.The tumorigenesis processII.1 IntroductionCell proliferation is a very well controlled process which meets the organism needs. In ayoung animal, cell division and multiplication overtake apoptosis, enabling the growth <strong>of</strong>the organism. In adults, birth <strong>of</strong> new cells is compensated by apoptosis, leading to adynamic but stationary state. A tumor, by definition, is an abnormal growth <strong>of</strong> tissueresulting from uncontrolled, progressive multiplication <strong>of</strong> cells and serving nophysiological function. Tumors may be benign (not cancerous) or malignant (cancerous).A malignant tumor may destroy adjacent tissues and may spread to distant anatomic sitesthrough a process called metastasis. These malignant properties <strong>of</strong> cancers differentiatethem from benign tumors, which are eventually self-limited in their growth and do notinvade or metastasize. Nevertheless, additional genetic alterations in some benign tumorscan transform them in malignant tumors.II.2 The multistep process <strong>of</strong> tumorigenesisSeveral lines <strong>of</strong> evidence indicate that tumorigenesis is a multistep process and that thesesteps reflect genetic alterations in proto-oncogenes or tumor-suppressor genes that drivethe progressive transformation <strong>of</strong> normal cells into highly malignant derivatives 37 . Aproto-oncogene is defined as a non-mutated cellular gene which may be the origin <strong>of</strong> anoncogene. An oncogene is a mutated gene which contributes to the initiation orprogression <strong>of</strong> cancers by over<strong>expression</strong> or constitutive activation <strong>of</strong> its correspondingprotein. Examples <strong>of</strong> oncogenes are Ras, BRAF, β-catenin, erbB, fos and myc. A tumorsuppressorgene is a growth controlling gene that normally limits the normal growth <strong>of</strong>cells. When a tumor suppressor gene is mutated and inactivated, it fails to keep cells fromproliferating. Examples <strong>of</strong> tumor-suppressor genes are p53, Rb, PTEN and p16INK4a.Gain <strong>of</strong> function mutations in oncogenes, and loss <strong>of</strong> function mutations in tumor-14
Figure 8. Behavior <strong>of</strong> metastatic cells. From Guo and Giancotti, 2004.
Chapter I : Introductionsuppressor genes only when both alleles are mutated, disrupt the regulatory circuits thatcontrol cell fate, conferring on neoplastic cells the ability to survive and proliferate, evenif appropriate extracellular signals are not available 38 .It is proposed that the large majority <strong>of</strong> cancer genotypes, if not all, are a manifestation <strong>of</strong>six essential alterations in cell physiology that collectively drive to malignant growth:self-sufficiency in growth signals, insensitivity to growth-inhibitory signals, evasion <strong>of</strong>apoptosis, limitless replicative potential, sustained angiogenesis, and tissue invasion andmetastasis. Each alteration enables cancer cells to acquire novel capabilities and favorsthe development and progression <strong>of</strong> the tumor 38 .II.3 Behavior <strong>of</strong> metastatic cellsII.3.1 <strong>Gene</strong>ral viewCancer cells spread throughout the body by metastasis. To have emergence <strong>of</strong> cells withmetastatic capability, both genetic and epigenetic changes have to appear in the primarytumor. Recent findings indicate that metastatic subclones probably arise from primarytumors that have already progressed to the invasive stage 39 . Several sequential andobligatory steps have to occur in order to have metastasis formation (Figure 8). First,cancer cells need to detach from their neightbouring cells, degrade the basementmembrane and penetrate into the interstitial stroma. Secondly, tumor cells penetrate intoblood and lymphatic vessels in a process known as intravasation. To enter into vessels,cancer cells must traverse the endothelial basement membrane and disrupt their cell-celladhesion. After reaching the bloodstream, either directly or through the lymphatic system,tumor cells <strong>of</strong>ten adhere to platelets and leukocytes, facilitating their circulation until thetarget organs compared to isolated tumor cells 40,41 . Finally, metastatic cells exit thebloodstream by a process known as extravasation, and start to grow in the parenchyma <strong>of</strong>the target organ. Expansion <strong>of</strong> cancer cells in the new organ requires similar needs than inthe primary organ, including a supportive stroma and an adequate blood supply 38 .15
Chapter I : IntroductionII.3.2 Processes involved in tumoral invasionMultiple acquired capabilities contribute to the invasive properties <strong>of</strong> metastatic cells.First is the ability to move through tissues. To break away from their primary tissue,metastatic cells have to loose their proteins enabling adhesion with the adjacentnonmetastatic cells and the basement membrane, acquire a migratory phenotype, anddegrade or remodel the ECMs that impose barriers to their dissemination. Secondly,metastatic cells have to induce angiogenesis in order to provide oxygen and nutrientsrequired for their tumor growth. Indeed, cancer cells cannot grow beyond a relativelylimited size unless they elicit an angiogenesis response 42 . Thirdly, metastatic cells have tosurvive in foreign microenvironnements before they colonize their target organ, and theyhave to survive and proliferate within the stroma <strong>of</strong> the target organ. In the nextparagraphs, we discuss some aspects <strong>of</strong> the carcinogenesis process involved inprogression and invasion <strong>of</strong> cancer cells.II.3.2.1 ECM remodellingThe extracellular matrix (ECM) is a complex architecture composed <strong>of</strong> collagens, fibrillarglycoproteins and proteoglycans that play a major role in the tissue architecture and thecellular adhesion. Components <strong>of</strong> the ECM provide a large variety <strong>of</strong> specific signals thatdirectly influence cell proliferation, migration and cell survival, mainly by theirinteractions with integrins (see below). Alterations <strong>of</strong> the ECM might therefore lead tocancer. It is suggested that perturbation <strong>of</strong> the tissue microenvironment may be sufficientto induce tumor formation. Moreover, tumor cell invasion and metastasis also requiredestruction <strong>of</strong> the ECM during local invasion, angiogenesis, intravasation andextravasation 43,44 .These processes are mediated by multiple degradative actions <strong>of</strong> proteolytic enzymes.These complex events need cooperation <strong>of</strong> different proteases, including aspartyl andcysteine enzymes (mainly cathepsins) involving in intracellular proteolysis withinlysosomes, serine enzymes (the urokinase-type plasminogen activator, uPA and thetissue-type plasminogen activator, tPA) and metal-dependent enzymes(metalloproteinases, MMPs). Both last ones are responsible for extracellular proteolysis.16
Figure 9. Diversity <strong>of</strong> tumor invasion mechanisms. From Friedl and Wolf, 2003. Individual orcollective tumor-cell migration strategies are determined by different molecular programmes(triangles). From individual (top) to collective (bottom) movements, increased control <strong>of</strong> cell-ECMinteractions is provided by integrins and matrix-degrading proteases. Cell-cell adhesion throughcadherins and other adhesion receptors as well as cell-cell communication via gap junctions, arespecific characteristics <strong>of</strong> collective cell behaviour. Detached and disseminating cell collectives(cluster or cohorts) are observed in epithelial cancers that retain high or intermediate levels <strong>of</strong>differentiation, such as breast and colon cancer. Multicellular strands and sheets that do not detach areinvasive, yet rarely metastatic. These occur in some epithelial cancers, including basal-cellcarcinomas and benign vascular tumors.
Chapter I : IntroductionThese enzymes can act directly by degrading ECM or indirectly by activating otherproteases, which in turn degrade the ECM 45 . ECM remodeling is also mediated byinhibitors <strong>of</strong> these proteases, such as cystatins for cathepsins, plasminogen activatorinhibitor 1 and 2 (PAI1 and PAI2) for serine proteases and the TIMP family members(tissue inhibitor for metalloproteinases) for MMPs 45 .II.3.2.2 Diversity <strong>of</strong> tumor invasion mechanismsTo spread within tissues, tumor cells use migration mechanisms that are similar, if notidentical, to those occurring in normal, non-neoplastic cells during physiologicalprocesses such as embryonic morphogenesis 46 . To migrate, the cell body must modify itsshape and stiffness to interact with the surrounding tissue structures. Hereby, the ECMprovides the substrate, as well as a barrier towards the advancing cell body. In vitro andin vivo observations have shown that tumor cells infiltrate neighbouring tissue matricesby different ways. They can disseminate as individual cells (amoeboid and mesenchymalmigration), referred to as “individual cell migration”, or expand in solid cell strands,sheets or clusters, called “collective migration” (Figure 9). Whereas leukaemias,lymphomas and most solid stromal tumors, such as sarcomas, disseminate via single cells,epithelial tumors commonly use collective migration mechanisms. In principle, the lowerde differentiation stage, the more likely the tumor is to disperse via individual cells 47 . Thecentral molecules that govern and specify such diverse migration processes are: thematrix-binding adhesion receptors, most notably those belonging to the integrin family;matrix-degrading proteases <strong>of</strong> the MMP family and serine protease family (uPA/uPAR);molecules that enable cell-cell adhesion and communication (Figure 9).During progressive dedifferentiation in epithelial cancer, the conversion frommulticellular growth and invasion to mesenchymal single cell migration is termed theepithelial-mesenchymal transition (EMT) 47 . The primary step is the loss <strong>of</strong> cell-junctionsvia several mechanisms. These include reduced cadherin <strong>expression</strong>, loss-<strong>of</strong>-functionmutations in cadherin and deregulated functions <strong>of</strong> proteases leading to degradation <strong>of</strong>cadherins and other cell-cell adhesion molecules. These changes in cell morphology and17
Figure 10. From Guo and Giancotti, 2004. Clustering <strong>of</strong> integrins leads to activation <strong>of</strong> FAK thatrecruits SH2-containing proteins such as Src-family kinases (SFKs). When recruited, SFKphosphorylates P130CAS, which recruit the complex DOCK180/Crk leading to activation <strong>of</strong> Rac.This in turn results in the activation <strong>of</strong> p21-activated kinase (PAK), Jun amino-terminal kinase(JNK) and nuclear factor κB (NF-κB). Activation <strong>of</strong> FAK also enables the recruitment <strong>of</strong> the p85subunit <strong>of</strong> PI3K, leading to the activation <strong>of</strong> AKT/proteine kinase B (PKB) through the synthesis <strong>of</strong>phosphatidylinositol-3,4,5-triphosphate (PtdIns(3,4,5)P3. Finally, there are multiple pathways thatresult in ERK activation through integrins and FAK. This includes activation by recruiting theRAP1 guanine nucleotide-exchange factor (GEF) C3G leading to B-RAF activation through RAP1.Another pathway involves the growth-factor-receptor-bound-2 (GRB2) and son-<strong>of</strong>-sevenless (SOS)complex, and transactivation <strong>of</strong> the epidermal growth factor (EGF) receptor.
Chapter I : Introductionfunctions are accompanied by changes in protein <strong>expression</strong> <strong>pr<strong>of</strong>iles</strong>, including the loss<strong>of</strong> cytokeratins and appearance <strong>of</strong> vimentin.The EMT is considered to be a significant step in the invasive cascade. Once the tumorhas achieved the dedifferentiated stage <strong>of</strong> single-cell dissemination, metastatic spread isincreased, resulting in poor prognosis 46,47 .II.3.2.3 Integrin signalingIntegrins are a large family <strong>of</strong> receptors that mediate the adhesive interactions <strong>of</strong> the cells.They are heterodimerics proteins composed <strong>of</strong> α and β transmembrane subunits. Sixteenα and height β different subunits have been described, leading to at least 25 differentintegrins, each being specific for a unique set <strong>of</strong> ligands. Most <strong>of</strong> the integrins bind tocomponents <strong>of</strong> the ECM (such as fibronectin and collagen). Upon binding <strong>of</strong> the integrinsto the ECM components, the integrins cluster and their cytoplasmic tails provide bindingsites for cytoskeletal and signaling molecules 43 .FAK (Focal adhesion kinase) is a nonreceptor tyrosine kinase that plays a major role inthe integrin signaling. FAK was initially found to be localized to focal adhesions,providing a structural link between the ECM and the actin cytoskeleton 48 . After morethan 15 years <strong>of</strong> investigation, many studies have shown that integrins and FAK canregulate many aspects <strong>of</strong> cell behavior other than the cytoskeleton. Signaling enzymesand adaptor proteins regulated by integrins control cell survival, proliferation, motilityand differentiation.Most integrins recruit FAK through their β-subunits (Figure 10). Integrin clusteringfacilitates the autophosporylation <strong>of</strong> tyrosine 397 which increases the catalytic activity <strong>of</strong>FAK. This phosphorylation is required for the recruitment <strong>of</strong> SH2-containing proteinssuch as Src or p85 subunit <strong>of</strong> PI3K. When recruited to the 397Y, Src mediatesphosphorylation on other sites on FAK, creating additional SH2-domain binding sites.Protein bindings to these sites result in a cascade <strong>of</strong> protein interactions that transducesignals to many downstream pathways, including PI3K/Akt, Crk/Dock180/Rac and18
Chapter I : IntroductionRas/Erk. These signaling pathways exert a stringent control on cell survival, cellproliferation and cell migration (Figure 10) 43,49 .It has been shown that integrins and RTKs exert a joint control on survival and mitogenicpathways 50 . This property can be explained by the fact that even if RTKs are activated,normal cells are unable to proliferate when cultured in suspension and are referred to as“anchorage-dependent”. Normal cells need ECM adhesion through integrins for theirsurvival and their proliferation. In contrast, tumor cells are shown to replicate withoutattachment to a substratum. But despite their relative anchorage independence, cancercells still benefit from integrin signals and because integrins connected to RTKs lead toactivation <strong>of</strong> important signaling pathways for cell development and proliferation,deregulations in integrins and their downstream proteins contribute to tumor initiationand progression. Activating mutations <strong>of</strong> Src-family kinases (SFKs), Ras, variousguanine nucleotide-exchange factors (GEFs), AKT/PKB, B-RAF, NF-κB and c-jun, andloss-<strong>of</strong>-functions mutations <strong>of</strong> PTEN have been identified in primary tumors 43 . Moreover,a large number <strong>of</strong> reports show an enhanced <strong>expression</strong> <strong>of</strong> FAK mRNA and/or protein ina variety <strong>of</strong> human cancers, including invasive colon and breast cancers, metastaticprostate carcinoma and malignant melanoma 51 . Neoplastic cells also tend to lose integrinsthat secure their adhesion to the basement membrane and help them to remain in aquiescent and differentiated state. However, they maintain or overexpress integrins thatfoster their survival, migration and proliferation during tumor invasion and metastasis.Unfortunately, cell-type-dependent changes in integrin signaling make it impossible torigidly assign each <strong>of</strong> the integrins to the “anti-neoplastic” or the “pro-neoplastic”category 43 . Nevertheless, dysregulated joint integrin-RTK signaling seems to play amajor role in numerous steps <strong>of</strong> tumor progression, including disruption <strong>of</strong> cell-celladhesion, migration <strong>of</strong> tumor cells, matrix remodeling and tumor angiogenesis 43 .19
Figure 11. The thyroid gland.
Chapter I : IntroductionIII.The thyroid glandIII.1 IntroductionThyroid is an endocrine gland with a butterfly shape as seen from the front. It is fixed byfibrous tissue to the anterior and lateral parts <strong>of</strong> the larynx and trachea (Figure 11). Theweight <strong>of</strong> a thyroid from a normal nongoitrous adult is 10-20 g depending on body sizeand iodine supply. The major role <strong>of</strong> thyroid gland is to trap iodide in blood andsynthetize the thyroid hormones, triiodothyronine (T 3 ) and tetraiodothyronine orthyroxine (T 4 ). T 3 is the active form and constitutes 10% <strong>of</strong> the production, whom 1% isan inactive isomer (rT 3 ). Secreted in the circulatory system, thyroid hormones act onperipheral tissues in order to control different physiological functions, such as growth andthe development <strong>of</strong> the central nervous system in fetus and during the first weeks <strong>of</strong> life.They also participate to the general metabolism <strong>of</strong> the body (stimulation <strong>of</strong> proteinssynthesis in all tissues, participation in lipids and carbohydrate metabolism).The adult thyroid is composed <strong>of</strong> follicles, or acini, a spheric structure constituted by asingle layer <strong>of</strong> epithelial cells, the thyrocytes (Figure 12). Follicles may be considered,from both structural and functional points <strong>of</strong> view, as the primary, or secretory, units <strong>of</strong>the organ. Thyrocytes enable to delimit a closed compartment called the follicular lumen,which contains the colloid, a sticky substance secreted by thyrocytes and mainlyconstituted by thyroglobulin (Tg). Tg is a glycoprotein with a high molecular weight (2sub-units <strong>of</strong> 330 kDa each) which is synthesized by the thyrocytes and then excreted inthe follicular lumen. Tg serves as a precursor for thyroid hormones synthesis 52 .In addition to follicles, there are individual cells or small groups <strong>of</strong> cells that do notextend to the follicular lumen and which may appear between follicles. These cells, or C-cells, secrete calcitonin in response to an increase in serum calcium 53 . This hormone isimportant in the regulation <strong>of</strong> bone resorption and lowers plasma free Ca ++ levels. Inadult human thyroid, they represent 1% <strong>of</strong> the cell population.20
folliclecolloidBasolateralmembraneApicalmembraneNIS2 Na +I -AIT/pendrinI -NADPHoxydaseThOXsO 2H 2O 2TGTGTSHNISAC+cAMPGsTSHRNIS+TPOPrimarylysosomeTPOI -MIT DITT3TGT4T3T4MIT DITT3T4AASecondarylysosomeMIT DITT3TGT4EndosomeFigure 12. Synthesis and secretion <strong>of</strong> thyroid hormones. From N.Fortemaison, PhD thesis.TSH: thyroid stimulating hormone, TSHR: TSH receptor, AC: adenylyl cyclase, NIS:iodide Na+/I– symporter, AIT: Apical I- Transporter, TPO: thyroperoxydase, TG:thyroglobulin, MIT/DIT: mono/di-iodotyrosines, T 3 : triiodotyronine, T 4 : thyroxine, AA:amino acids.
Chapter I : IntroductionOutside the follicles, two other types <strong>of</strong> cells are described in thyroid: the endothelialcells forming the wall <strong>of</strong> blood vessels and fibroblasts acting as support. In normalhuman thyroid, the relative proportions <strong>of</strong> follicular, fibroblasts and endothelial cells areabout 70%, 20% and 10%, respectively.III.2 Thyroid hormone synthesisThe main function <strong>of</strong> the thyroid gland is to make hormones, triiodothyronine (T 3 ) andtetraiodothyronin or thyroxine (T 4 ), which are essential for the regulation <strong>of</strong> metabolicprocesses throughout the body. Thyroid hormone synthesis requires the uptake <strong>of</strong> iodideby active transport, thyroglobulin biosynthesis, oxidation and binding <strong>of</strong> iodide tothyroglobulin and oxidative coupling <strong>of</strong> two iodotyrosines into iodothyronines 54,55 .Thyrocytes are polarized cells: the basolateral membrane is in contact with the connectivetissue and vessels while the apical membrane is in direct contact with the colloid. Iodideis actively transported by the iodide Na+/I– symporter (NIS) at the basal membrane <strong>of</strong> thethyrocyte 56,57 and diffuses passively from the cell to the lumen at the apical membrane bya mechanism which would involved pendrin 58,59 and/or AIT (Apical I - Transporter) 60 ,although this is still debated. Iodide is finally stored in the follicle lumen (Figure 12).At the apical membrane, after having concentrated iodide, thyroid rapidly oxidizes it t<strong>of</strong>orm iodine which is incorporated into tyrosyl residues <strong>of</strong> thyroglobulin (Tg) to form 3-monoiodotyrosines (MIT) and 3,5-diiodotyrosines (DIT). Oxidative coupling <strong>of</strong> a MITand a DIT, or <strong>of</strong> two DIT then allow to form T 3 and T 4 , respectively. These processesrequire the presence <strong>of</strong> thyroperoxidase (TPO) and H 2 O 2 .H 2 O 2 is produced at the apical plasma membrane by a H 2 O 2 generating system belongingto the family <strong>of</strong> NOX (NADPH oxydase) enzymes. Its main components are the recentlycloned thyroid THOX1 and THOX2 61,62 (Figure 12).To exert their action at their distant target tissues, thyroid hormones must be releasedfrom Tg and delivered to the blood circulation. After TSH stimulation, Tg molecules arefirst taken up by polarized thyrocytes in endocytosis vesicles and then conveyed to21
HypothalamusTRHpituitary glandTSHThyroidT3/T4StimulationinhibitionFigure 13. Regulation <strong>of</strong> thyroid function.
Chapter I : Introductionlysosomal compartments for proteolytic cleavage that releases T 3 and T 4 from theirpeptide linkages (Figure 12). Amino acids and iodotyrosines (MIT and DIT) which havenot participated to the coupling for sterical reasons are also released. T 3 and T 4 aresecreted to the basal membrane to reach vessels and the last are de-ioded. Nonhormonaliodine, about 70% <strong>of</strong> Tg iodine, is retrieved and made available for recycling within thegland. In healthy human subjects with an adequate iodide intake, the thyroid glandproduces predominantly the prohormone T 4 and a small amount <strong>of</strong> the bioactive thyroidhormone T 3 . Roughly 80% <strong>of</strong> T 3 is produced by deiodination <strong>of</strong> T 4 in peripheral tissues.By these mechanisms enabling the efficient iodide absorption and its storage at the Tglevel, the thyroid gland can provide appropriate bloody concentrations <strong>of</strong> thyroidhormones, despite a non constant and intermittent iodide availability. According to theneeds <strong>of</strong> the organism, T 4 undergoes conversion to the active hormone T 3 or to theinactive hormone rT 3 (reverse T 3 ).III.3 Regulation <strong>of</strong> the thyroid cellThe activity <strong>of</strong> the thyroid gland is predominantly regulated by the concentration <strong>of</strong> thethyroid stimulating hormone (TSH) secreted by the pituitary gland in response tothyrotropin releasing hormone (TRH), itself secreted by the hypothalamus and regulatedby temperature variations and repressed by stress (Figure 13). On the other hand, thyroidhormones have an inhibitory effect on the TSH and TRH productions, acting as a directnegative feedback on the pituitary gland and the hypothalamus. Any inhibition <strong>of</strong> thethyroid hormone synthesis (for instance by using antagonists agents <strong>of</strong> TPO), andconsequently their secretion, removes this negative feedback, mainly at the pituitarygland, and promotes a hypersecretion <strong>of</strong> TSH and an activation <strong>of</strong> the gland. On theopposite, treatments by exogenous thyroid hormones inhibit the TSH secretion andpromote an inactivation <strong>of</strong> the gland 52 (Figure 13).The consequence <strong>of</strong> the dynamic interplay <strong>of</strong> these two dominant influences on TSHsecretion, the positive effect <strong>of</strong> TRH on the one hand and the negative effects <strong>of</strong> thyroid22
Chapter I : Introductionhormones on the other, result in a remarkably stable concentration <strong>of</strong> TSH in thecirculation and consequently little alteration in the level <strong>of</strong> circulating thyroid hormonesfrom day to day and year to year. This regulation is so carefully maintained that anabnormal serum TSH level generally indicates the presence <strong>of</strong> a disorder <strong>of</strong> thyroid glandfunction.III.4 Control <strong>of</strong> thyroid-specific gene <strong>expression</strong>TSH controls the thyroid metabolism by binding to its receptor 52,54 . This receptor is aseven-transmembrane receptor controlling transducing guanosine triphosphate (GTP)-binding proteins. Activated G proteins belong to the Gs class and activate adenylylcyclase. The cAMP generated by adenylyl cyclase is responsible for the major effects <strong>of</strong>TSH 14 , including iodide transport, synthesis and secretion <strong>of</strong> thyroid hormones, andinduces thyroid-specific gene <strong>expression</strong> (Figure 12).The so-called thyroid-specific genes encode proteins that are either found exclusively inthyroid, like thyroglobulin and thyroperoxidase, or that, although being also found in afew additional tissues, are primarily involved in thyroid function, like TSH receptor andsodium/iodide symporter. The transcription <strong>of</strong> these genes in the thyroid appears to relyon the coordinated action <strong>of</strong> a set <strong>of</strong> transcription factors that includes the homeodomainprotein TTF-1, the paired-domain protein Pax 8, and the forkhead-domain protein TTF-2 63,64 .III.5 Control <strong>of</strong> growth and differentiationIn the thyroid at least three families <strong>of</strong> distinct mitogenic pathways have been welldefined: (1) the TSH receptor–adenylyl cyclase–cAMP-dependent protein kinase system(Figure 6), (2) the growth factor receptor–tyrosine protein kinase pathways (Figure 7),and (3) the hormone receptor–phospholipase C cascade (Figure 3) 52 .23
Chapter I : IntroductionThrough cAMP, TSH directly stimulates proliferation while maintaining the <strong>expression</strong><strong>of</strong> differentiation. All the proliferation effects <strong>of</strong> TSH are mimicked by activators <strong>of</strong> thecAMP cascade, such as cholera toxin and forskolin (which stimulate the protein Gsα andadenylyl cyclase, respectively), and cAMP analogs (which activate the cAMP-dependentprotein kinases) 65,66 .The receptor–tyrosine kinase pathway may be subdivided into two branches; somegrowth factors, such as EGF, induce proliferation and repress differentiation <strong>expression</strong>,whereas others, such as FGF in dog cells or IGF-I and insulin, are either mitogenic or arenecessary for the proliferation effect <strong>of</strong> other factors without being mitogenic bythemselves. These growth factors do not inhibit differentiation <strong>expression</strong> 67,68 . In thyroidcells, IGF-I, which by itself only weakly stimulates proliferation, is required for themitogenic action <strong>of</strong> TSH or EGF 65 .Finally, the tumor-promoting phorbol esters, the pharmacological probes <strong>of</strong> proteinkinase C and analogs <strong>of</strong> diacylglycerol, also enhance the proliferation and inhibit thedifferentiation <strong>of</strong> thyroid cells. These effects are transient because <strong>of</strong> the desensitization<strong>of</strong> the system following protein kinase C inactivation 52,65,69 . Activation <strong>of</strong> the PIP2cascade by a more physiological agent such as TSH in human thyroid cells requires a 10-fold higher concentration than for the cAMP pathway 70,71 .To conclude, thyroid function involves three signaling pathways which all lead tothyrocytes proliferation. Consequently, any functional mutation appearing in proteinsinvolved in these cascades can potentially lead to abnormal proliferation andtumorigenesis.24
Chapter I : IntroductionIV.Thyroid tumorsIV.1 IntroductionA normal human thyroid gland weights between 10 and 20 g. A goiter is a thyroid glandwith an increased volume. It can be diffuse or nodular. The first can be found in relativelyfrequent pathologies such as the sporadic goiter, the Graves-Basedow disease and somethyroidites. The nodular goiter is usually the last stage <strong>of</strong> the diffuse goiter, but notnecessarily. It can be mono- or multi- nodular. Each nodule will be defined as “hot”,“warm” or “cold” according it takes up a higher, the same or a smaller amount <strong>of</strong>radioiodide or 99m TC pertechnetate than the surrounding thyroid tissue. It is estimated that5 to 10% <strong>of</strong> the population will develop a clinically significant thyroid nodule duringtheir lifetime 72 . The histological analysis <strong>of</strong> the nodule by a pathologist enables todistinguish the simple nodule, which is not surrounded by a fibrosis capsule, the benignadenoma encircled by a fibrosis capsule and the carcinomas which invade the capsule andthe adjacent tissue. The benign nodules and adenomas display a follicular structure andthe second are consequently called follicular adenomas. Carcinomas can displayfollicular structures, but also papillae or no structure at all (see further).The iodine supply plays an important role in the repartition <strong>of</strong> thyroid tumors: in the US,where the iodine supply is high (about 500 µg/day), autonomous adenomas constitute lessthan 1% <strong>of</strong> all thyroid tumors while in Europe, the iodine supply is relatively insufficientand this type <strong>of</strong> tumor is more abundant (about 10%) 73 . Among malignant tumors,papillary thyroid carcinoma (PTC) is more prevalent in countries with sufficient iodinediets whereas follicular thyroid carcinoma (FTC) display a higher frequency in regionswith insufficient iodine diets 74 .25
Chapter I : IntroductionIV.2 The autonomous thyroid adenomasHyperfunctioning thyroid adenomas are benign monoclonal encapsulated tumorscharacterized by their capacity to produce high amount <strong>of</strong> thyroid hormones (T 3 and T 4 )autonomously, independently <strong>of</strong> the TSH stimulation.Autonomous adenoma can occur at any age but is generally diagnosed between 30 and 60years old, is more common in women (ratio 6:1 to 15:1) and in areas in which iodineintake is relatively low 75 .Hyperstimulation <strong>of</strong> thyrocytes in autonomous adenomas is due to the constitutiveactivation <strong>of</strong> the cAMP signaling pathway by mutations conferring constitutive activity tothe TSH receptor (70-80%) or an activating mutation <strong>of</strong> the Gsα protein (8%) 76 . In about20-30% <strong>of</strong> autonomous adenomas, no mutation in TSHR or Gsα has been found,suggesting that genetic alterations in other proteins along the cAMP signaling pathwayare likely.IV.3 The thyroid carcinomasThyroid carcinoma is the most frequent endocrine malignancy and representsapproximately 1% <strong>of</strong> all malignancies. In Europe and the United States, about three out<strong>of</strong> 100 000 people will develop a thyroid malignancy but considerable regionaldifferences exist. It is generally more common in women than in men (2-3:1) but theprognosis is generally slightly better in women 77 .Thyroid cancers can be subdivided in 4 major types: papillary thyroid carcinoma (PTC),follicular thyroid carcinoma (FTC), both <strong>of</strong> which may be summarized as differentiatedthyroid cancer (DTC), anaplastic (undifferentiated) thyroid carcinoma (ATC) andmedullary thyroid carcinoma (MTC). PTC, FTC and ATC derive from thyroid follicularepithelial cells while MTC derives from the parafollicular cells (C cells). Increased age atdiagnosis, size <strong>of</strong> the tumor and widespread metastatic disease are associated with poorprognosis, independently <strong>of</strong> the type <strong>of</strong> cancer 78 .26
Chapter I : IntroductionClassification and diagnosis <strong>of</strong> thyroid cancers, and thyroid tumors in general, is verycomplicated and subjective 79,80 . Several classifications have been proposed but none <strong>of</strong>them is entirely satisfactory. Masson stated in frustration 81 , “No classification is moredifficult to establish than that <strong>of</strong> thyroid epitheliomas. Their pleomorphism is almost therule; very few are adapted to a precise classification”. About the ability to separatebenign from malignant tumors, he added “<strong>of</strong> all cancers, thyroid epitheliomas teach,perhaps, the greatest lesson <strong>of</strong> humility to histopathologists… Many pathologists agreewith me in never giving a prognosis on an epithelial thyroid tumor without reservation”.A thyroid nodule is the most common symptom <strong>of</strong> patients with thyroid cancer but lessthan 5 to 10% <strong>of</strong> thyroid nodules are cancers 82 . A cancer has to be suspected if the noduleis solid, irregular, with a high growth rate and if it is scintigraphically cold. If a thyroidnodule is clinically suspicious to be malignant, a fine-needle aspiration cytology (FNAC)is the appropriate initial diagnostic procedure 83 . Papillary, medullary and anaplasticcarcinomas can be readily diagnosed on the basis <strong>of</strong> the results <strong>of</strong> such examination. InFTC, however, the contribution <strong>of</strong> FNAC is limited since it <strong>of</strong>ten fails to distinguishbetween FTC and follicular adenoma. To distinguish between these two types <strong>of</strong> tumors,histological examination needs to be done and shows either invasion through the tumorcapsule or vascular invasion in the case <strong>of</strong> a FTC.Surgery is the treatment <strong>of</strong> choice in thyroid cancer and a total thyroidectomy is generallyperformed. An adjuvant treatment by 131 I is used for tumors which take up iodide (ATCand MTC are not concerned) in order to localize and destroy eventual remaining cancertissues. Finally, external uptake <strong>of</strong> thyroid hormones is provided to patients in order toinhibit TSH secretion, which promotes the proliferation <strong>of</strong> normal thyroid epithelial cells.This treatment decreases the probability <strong>of</strong> recurrence and increases the survival rate.IV.3.1 Differentiated Thyroid Carcinomas (DTC)DTCs consist <strong>of</strong> the two most prevalent thyroid cancers, the papillary and follicularthyroid carcinomas, which still express some differentiation proteins such as NIS, TPO27
Chapter I : Introductionand TSHR. DTC is generally sporadic but familial occurrence has been described andoccur in probably 3 to 7% <strong>of</strong> all thyroid cases. A small subset <strong>of</strong> patients with familialadenomatous polyposis (FAP), an autosomal dominant syndrome, also develop PTC 84 .Moreover, patients with Cowden's disease have an increased risk <strong>of</strong> developingmalignancy, especially breast and thyroid carcinoma 85 .A variety <strong>of</strong> factors have been shown to affect the prognosis <strong>of</strong> DTC. These factorsinclude histological type and subtype, tumor stage, age, gender, histology type anddifferentiation, DNA euploidy, microvessel count, E-cadherin <strong>expression</strong>, telomeraseactivity, capsular and vascular invasion. The value <strong>of</strong> most <strong>of</strong> these prognosis factors,however, is not uniform in all the studies. Primary tumor size, extrathyroidal extensionand distant metastases, however, are among those which are generally correlated withoutcome 74 .Many clinicopathological staging systems exist for differentiated thyroid carcinomas. TheTNM (T, extend <strong>of</strong> primary tumor; N, status <strong>of</strong> regional lymph nodes; M, absence orpresence <strong>of</strong> distant metastases) clinical classification is the most useful prediction <strong>of</strong>evolution for thyroid cancer, and is generally recommended for use 86 . The prognosisimportance <strong>of</strong> histological features, such as tumor size and extrathyroidal invasion,underscores the need for pathologists to report these data in the same way.IV.3.1.1 Papillary thyroid carcinomasAccording to the WHO (World Health Organization), PTC is defined as a malignantepithelial tumor showing evidence <strong>of</strong> follicular cell differentiation, typically withpapillary and follicular structures as well as characteristic nuclear changes.Papillary thyroid carcinoma (PTC) is the most frequent endocrine malignancy in humansand represents up to 70-80% <strong>of</strong> all malignant thyroid tumors. It tends to be biologicallyindolent and has an excellent prognosis with an overall 5-10 year survival rate <strong>of</strong> 80-95%.It occurs in all age groups but is most common in the 3 rd and 5 th decades. Lymph nodemetastasis (LNM) is commonly found in patients with PTC contrasting with a low rate <strong>of</strong>28
A. B.C. D.Figure 14. Histology <strong>of</strong> the four main types <strong>of</strong> thyroid cancer. A. papillary thyroid carcinoma,classical variant ; B. follicular thyroid carcinoma ; C. anaplastic thyroid carcinoma ; D medullarythyroid carcinoma.
Chapter I : Introductiondistant metastases to lungs and bones (5 to 7% at the moment <strong>of</strong> diagnosis). PTC also<strong>of</strong>ten displays lymphocytic infiltration and fibrosis 74 .The diagnosis <strong>of</strong> PTC is based on the presence <strong>of</strong> a number <strong>of</strong> different features, not all<strong>of</strong> which need to be present in the same lesion, such as papillary architecture, thepresence <strong>of</strong> psammoma bodies (masses <strong>of</strong> calcareous material), and characteristic nuclearfeatures (ground glass, large size, pale, irregular outline with deep grooves andpseudoinclusions). The most common pathological subtype <strong>of</strong> PTC is the classical variant,characterized by the presence <strong>of</strong> papillae (Figure 14) but many other subtypes have beendescribed: the follicular variant (FVPTC), a very common pathological subtype, lookslike FTC but displays nuclear features <strong>of</strong> PTC; the diffuse sclerosing variant frequentlyappears in young people and is characterized by a fibrotic and lymphocytic reactionacross the tumor; the encapsulated variant is difficult to diagnose but should display abetter prognosis; the tall-cell variant can be found in older patients and is associated witha bad prognosis; the solid variant is described in very young children (usually less thanfour years old) and is very common in the Chernobyl area. Other variants include thepapillary micro-carcinoma (or occult), where size is < 1 cm <strong>of</strong> diameter. Its discovery isusually fortuitous, generally after autopsy (up to 30%) and its mortality is very low 87 .IV.3.1.2 Follicular thyroid carcinoma (FTC)FTC is an epithelial thyroid malignant tumor showing follicular cell differentiation, butlacking the diagnostic features <strong>of</strong> PTC (WHO classification <strong>of</strong> tumors).FTC accounts for about 10-20% <strong>of</strong> all thyroid cancers. The survival rate <strong>of</strong> patients withFTC is slightly lower compared to PTC with a 10 year survival rates between 70 and 95%.It occurs over a wide age range but is most common in the 5 th and 6 th decades 74 . Contraryto PTC, in patients with FTC, distant metastases to lungs and bones are more common(11-20%) than lymph node metastases and may be the initial symptom. Dissemination isusually hematogenous.FTC derives from a follicular adenoma and its diagnosis is not always easy to establish. Itis usually composed <strong>of</strong> the juxtaposition <strong>of</strong> large and small follicles (Figure 14).29
Chapter I : IntroductionArchitectural structures are used to be polymorph and the cytological abnormalities arevariable. It is important to note that no cellular or architectural features enable toconclude to the malignant phenotype. The only criteria to conclude to the malignity arecapsule and/or vessels invasion. Two groups <strong>of</strong> FTC with different prognosis exist: theminimally invasive (encapsulated) follicular cancer is generally an isolated nodule whichis very well delimited by its capsule. It really looks like a follicular adenoma except bythe presence <strong>of</strong> vascular invasions, associated or not with capsular invasions. In somecases, presence <strong>of</strong> invasion is not sure and the lesion is then called atypical adenoma 88 ;the widely invasive follicular cancer is partially encapsulated but its malignity is notcontroversial. Indeed, a follicular cancer has to display a minimum <strong>of</strong> 7 vascularinvasions to be classified as widely invasive follicular cancer 89 .IV.3.2 Anaplastic thyroid carcinoma (ATC)ATC is defined as a highly malignant tumor composed, at least partially, byundifferentiated cells (WHO classification <strong>of</strong> tumors).ATC accounts for about 5% <strong>of</strong> all malignant thyroid tumors but its incidence has beengradually declining in many communities 90 due to more precise and accurate diagnosisand early resection for DTC. ATC, characterized by a rapid growth <strong>of</strong> the thyroid cancermass, is one <strong>of</strong> the most aggressive and lethal malignancies with a 5 year survival rate <strong>of</strong>1-5% and accounts for up to 40% <strong>of</strong> thyroid cancer mortality 91 . It typically occurs inpatients beyond the 6 th decade 92 . Patients with ATC usually present widespread localinvasion and a high frequency <strong>of</strong> distant metastases in lung, pleura, bone and brain 93 .Histologically, there are few resemblances between an ATC and a normal thyroid. Threedistinct histological subtypes have been identified: the spindle cell subtype (Figure 14),giant cell subtype and a squamoid or mixed variant subtype. Histologically, all threesubtypes are well-vascularized tumors with significant areas <strong>of</strong> necrosis.Note that although it is not a WHO classification, the term poorly differentiated thyroidcarcinoma is commonly used to describe tumors with intermediate pr<strong>of</strong>ile betweendifferentiated and anaplastic thyroid cancer.30
PapillaryCarcinomaRET rearrangementsBRAF mutationNormalthyrocyteRAS mutationp53mutationβ-cateninmutationAnaplasticCarcinomaFollicularAdenomaPAX8/PPARγrearrangementFollicularCarcinomaGα mutationTSHR mutationAutonomousAdenomaFigure 15. Multistep tumorigenesis in follicular thyroid neoplasms. Main mutations leading to the nextstep in the carcinogenesis processes are represented in italic.
Chapter I : IntroductionIV.3.3 Medullary thyroid carcinoma (MTC)MTC differs from all other thyroid cancers and derives from parafollicular C-cells whichsecrete calcitonin in order to regulate calcium concentration in blood.MTC represents about 5% <strong>of</strong> thyroid cancers. About 25% <strong>of</strong> patients with MTC arehereditary and the remaining 75% are sporadic. Sporadic MTC appear usually later thanthe hereditary form (between 5 th and 6 th decades compared to 3 rd and 4 th decades). Theprognosis <strong>of</strong> MTC strictly depends on the invasion grading. It is excellent when thetumor is completely encapsulated (10 year survival rate <strong>of</strong> 92%) but is bad when capsularinvasions are observed (10 year survival rate <strong>of</strong> 67%).The architectural polymorphism <strong>of</strong> MTC is very important and the tumor can look likeother thyroid cancers with papillae, small cells or anaplastic aspects (Figure 14). Thestromal component is particular, characterized by an amyloid substance in 80% <strong>of</strong> MTCs.Routine measurement <strong>of</strong> serum calcitonin concentrations, although suggested by someexperts, is not recommended for the assessment <strong>of</strong> a nodule because results can bemisleading 93 .IV.4 The multi-step process <strong>of</strong> thyroid carcinogenesisThyroid carcinogenesis is considered as a very interesting multi-step process wherenormal epithelial follicular cell evolves through a more and more dedifferentiated andaggressive phenotype (Figure 15).Clinically, as mentioned previously, follicular adenoma derives from follicular cells andthe only distinction between a follicular adenoma and a FTC is the presence <strong>of</strong> capsularand/or vascular invasion in the last one. On the other hand, pathologists observe thatabout half <strong>of</strong> patients with ATC have a previous or coexistent DTC, with evidence <strong>of</strong>dedifferentiation from more differentiated tumors 93 . These data suggest that FTCs mightderive from follicular adenomas and at least some ATCs, from PTC or FTC.31
Chapter I : IntroductionMolecular evidences also support this concept <strong>of</strong> stepwise progression. Several studieshave shown that ATC may harbor the mutations <strong>of</strong> well-differentiated thyroid carcinomas.In particular, a high frequency <strong>of</strong> BRAF mutations have been reported in ATC 94,95 . Rasmutations have also been detected in undifferentiated carcinomas 94-96 . These studiesstrongly support that most ATC probably arise from a pre-existing, well differentiatedprecursor lesion, even in case where this component has been completely over-run by theundifferentiated component (see further for more information about genetic alterations inthyroid cancers).IV.5 Etiology <strong>of</strong> thyroid cancersRadiation is the only proven cause <strong>of</strong> thyroid cancer. On 26 th April 1986, the unit 4reactor <strong>of</strong> the Chernobyl nuclear-power plant in northern <strong>of</strong> Ukraine exploded andreleased massive radioactive materials into the atmosphere. Initial ionizing radiationexposure consisted <strong>of</strong> 131-iodine ( 131 I), whereas later phases <strong>of</strong> environmentalcontamination were mainly due to isotopes <strong>of</strong> caesium ( 137 Cs, 134 Cs) and strontium ( 90 St).The release <strong>of</strong> radioactive iodine isotopes was <strong>of</strong> immediate concern in the first weeksafter the accident, but became less significant thereafter due to its short half life (8 days).Ionizing radiation can initiate carcinogenesis by directly damaging DNA or by causingformation <strong>of</strong> highly reactive free radicals that can eventually introduce genetic lesionssuch as DNA strand breaks.Leukaemias and cancers <strong>of</strong> thyroid, lung, and breast have been most consistentlyassociated with ionizing radiation exposure 97 . Particularly, several reports providedevidence <strong>of</strong> an increase in thyroid-cancer incidence in children living in Belarus andUkraine after the Chernobyl catastrophe 98 . In fact, the risk <strong>of</strong> developing thyroid cancersdue to ionizing radiation depends heavily on the age <strong>of</strong> exposure to fallout, with childrenunder 10-15 years old being the most susceptible. Ninety five percent <strong>of</strong> these thyroidtumors were classified as PTC on the basis <strong>of</strong> their histology. The short-latency tumorswere clinically aggressive and pathologically unusual. The longer-latency ones were32
<strong>Gene</strong>tic alterationsSporadicPTCRadioinducedFTCPoorlydifferentiatedATCRET/PTC 20-40% 50-80% 0% 9% 0%TRK rearrangements 0%
Chapter I : Introductionmore typical and less aggressive, with a changing pattern <strong>of</strong> oncogene mutation 98,99 (seefurther for more information about genetic alterations).Explosion <strong>of</strong> the Chernobyl nuclear-power plant is not the only catastrophe which causedthyroid cancer. Indeed, 20 years after the atomic bombings in Japan, the Atomic BombCasualty Commission reported significant increases in the incidence <strong>of</strong> thyroid cancer 97 .Although the etiology <strong>of</strong> PTC in patients not exposed to radiation remains uncertain,H 2 O 2 and estrogen could play a role in the development <strong>of</strong> this type <strong>of</strong> cancer 100-102 .IV.6 <strong>Gene</strong>tic alterations commonly found in thyroid cancersSeveral genetic alterations have been identified in thyroid cancers and some <strong>of</strong> them areusually relatively specific to a type <strong>of</strong> thyroid cancer. They can be classified into 2 majorcategories, the chromosomal rearrangements and the point mutations. A summary <strong>of</strong> thegenetic alterations and their prevalence in thyroid tumors is shown in table 1.IV.6.1 Chromosomal rearrangementsIV.6.1.1 The RET/PTC rearrangementRET/PTC rearrangement has been known for two decades as one <strong>of</strong> the most commonmolecular alterations in thyroid cancers, especially those <strong>of</strong> the papillary type. It wasdiscovered by Fusco et al in 1987 103 using a transfection assay on NIH3T3 cells, whichrevealed the transforming activity <strong>of</strong> DNA isolated from PTC. The new oncogene, namedRET/PTC, was subsequently found to be a fusion between the RET gene and the H4gene 104 . RET encodes a membrane tyrosine kinase receptor for a family <strong>of</strong> ligands, theprototype <strong>of</strong> which is glial cell-derived neurotrophic growth factor 105 . The RETprotooncogene is involved in the regulation <strong>of</strong> growth, survival, differentiation, andmigration <strong>of</strong> cells <strong>of</strong> neural crest origin. The RET gene is normally not expressed inthyroid follicular cells but is present in parafollicular C cells.33
Chapter I : IntroductionThere are several types <strong>of</strong> RET rearrangements found in PTC, formed by the fusion <strong>of</strong> theintracellular tyrosine kinase domain <strong>of</strong> the protein with different 5’ gene fragments whichare ubiquitously expressed and possess a dimerization domain. RET/PTC1 andRET/PTC3 are the most common combined forms <strong>of</strong> RET. RET/PTC1 is formed by aparacentric inversion <strong>of</strong> the long arm <strong>of</strong> chromosome 10 leading to fusion with a genenamed H4/D10S170 104 . RET/PTC3 is also a result <strong>of</strong> an intrachromosomal rearrangementand is formed by fusion with the RFG/ELE1 gene 106,107 . Many other variants have beenidentified, usually from children exposed to radiation after the Chernobylcatastrophe 105,108 . These rearrangements are likely to be predisposed by close positioning<strong>of</strong> the RET and its fusion partners within the nuclei <strong>of</strong> normal thyroid cells 109,110 . Thefusion results in constitutive activation <strong>of</strong> the truncated tyrosine kinase portion <strong>of</strong> RET byautophosphorylation thanks to the dimerization domain <strong>of</strong> the heterologous gene.RET/PTC activation is believed to be oncogenic for thyroid follicular cells, because ittransforms cells in vitro and results in formation <strong>of</strong> thyroid tumors in transgenic micewith microscopic features recapitulating those <strong>of</strong> human PTC 111-114 . The fact that a highproportion <strong>of</strong> occult microscopic foci <strong>of</strong> PTC, thought to be precursors <strong>of</strong> fully manifestforms <strong>of</strong> PTC, display the rearrangement gives also weight to this hypothesis 115 .RET/PTC rearrangements have been identified only in thyroid lesions, and particularly inPTC 116 . Their prevalence varies widely among studies but most <strong>of</strong> them report aprevalence <strong>of</strong> 20-40% in adult sporadic PTC. The wide variability is due to differentfactors such as geographic variation but also the different procedures to identify therearrangements 117,118 and the genetic heterogeneity <strong>of</strong> PTC. Indeed, the distribution <strong>of</strong>RET/PTC within each tumor can vary from involving almost all neoplastic cells (clonalrearrangement) to being detected only in a small fraction <strong>of</strong> tumor cells (nonclonalrearrangement) 117,119 . This raises the question <strong>of</strong> the initiating role <strong>of</strong> RET/PTC in tumorswith only a small subset <strong>of</strong> rearranged cells.The prevalence <strong>of</strong> RET/PTC is significantly higher in pediatric PTC 120,121 and in cancersfrom children exposed to radiation after the Chernobyl nuclear accident. For the last ones,RET/PTC was found in up to 80% <strong>of</strong> tumors removed 5-8 years after the accident and in50-60% <strong>of</strong> those removed 7-11 years after exposure 122 . The Chernobyl nuclear-powerplant accident provides a unique opportunity to correlate latency and tumor biology.34
Chapter I : IntroductionMany studies have shown that tumors <strong>of</strong> short latency are usually associated to the solidvariant, a very aggressive tumor with a higher prevalence <strong>of</strong> RET/PTC3 rearrangement.On the other hand, after a longer latency, tumors are generally less aggressive, associatedto the classical variant and the RET/PTC1 rearrangement 99,119 .IV.6.1.2 Rearrangements involving TRKThe proto-oncogene neurotrophin tyrosine kinase receptor (NTRK) 1 or trk is similar inmany ways to RET in that it encodes a transmembrane TK receptor for neuronal growthfactor, which is normally restricted to neuronal crest-derived cells 105 .Similarly to RET/PTC, the 3’ TK domain <strong>of</strong> trk is fused with the 5’ promoter region <strong>of</strong> anubiquitously expressed donor gene resulting in constitutively active tyrosine kinaseactivity. Three 5’ donor genes have been identified so far: tropomyosin 3 gene (TPM3),Translocated Promotor Region gene (TPR) and TRK Fused <strong>Gene</strong> (TFG) 105 .TRK rearrangements appear to be restricted to radio-induced PTC, but occur at a lowerprevalence than RET/PTC (less than 10%) 123 .IV.6.1.3 The AKAP9-BRAF fusionIn 2005, Ciampi et al 123 reported the identification <strong>of</strong> a novel oncogene, AKAP9-BRAF,in about 11% <strong>of</strong> post-Chernobyl PTC that developed in irradiated patients after a shortlatency period. However, in sporadic PTC, only 1% <strong>of</strong> tumors display this mutation.AKAP9-BRAF results from a paracentric inversion <strong>of</strong> the long arm <strong>of</strong> the chromosome 7and leads to the fusion <strong>of</strong> the first 8 exons <strong>of</strong> the A-kinase anchor protein 9 (AKAP9)gene with the C-terminal coding region <strong>of</strong> the BRAF protooncogene. This fusionpromotes the loss <strong>of</strong> the 2 BRAF regulatory domains and leads to the constitutive activity<strong>of</strong> the serine-threonine kinase. Ciampi et al. suggested that this fusion could be aninitiating event by showing that AKAP9-BRAF is able to induce transformation <strong>of</strong>NIH3T3 cells that become tumorigenic after injection into athymic mice 123 .35
Chapter I : IntroductionIV.6.1.4 PAX8-PPARγ rearrangementPAX8-PPARγ rearrangement is a chromosomal translocation t(2:3)(q13;p25) which hasbeen implicated in the development <strong>of</strong> thyroid cancers. PAX8 encodes a transcriptionalfactor required for the genesis <strong>of</strong> follicular cell lineages and regulation <strong>of</strong> thyroid-specificgene <strong>expression</strong>. PPARγ is a member <strong>of</strong> the nuclear hormone receptor superfamily thatincludes thyroid hormone, retinoic acid and androgen and estrogen receptors. Thesereceptors share common features, including a central DNA-binding domain and a C-terminal domain responsible for dimerization, ligand binding and transcriptionalactivation. Although the carcinogenic mechanism <strong>of</strong> this rearrangement remains unclear,it appears that PAX8-PPARγ chimeric protein may have a dominant negative effect onthe wild-type PPARγ, which has been described as a putative tumor suppressor 96 .PAX8-PPARγ rearrangement has been found initially almost exclusively in FTC whereit occurs with a prevalence <strong>of</strong> about 35% 96 . This rearrangement was thought to be apotential biomarker <strong>of</strong> malignancy in the differential diagnosis <strong>of</strong> follicular lesions.Nevertheless, several authors identified by PCR the presence <strong>of</strong> this rearrangement infollicular adenomas as well and in follicular variants <strong>of</strong> PTC 124,125 .IV.6.2 Point mutationsIV.6.2.1 The BRAF mutationsBRAF (v-Raf murine sarcoma viral oncogene homolog B1) is a member <strong>of</strong> the Raffamily. BRAF gene encodes a cytoplasmic serine/threonine kinase, which signals alongthe MAPK ERK1/2 signaling pathway. Activating point mutations in the kinase regioncan mimic phosphorylation <strong>of</strong> the protein, leading to elevated, Ras-independent kinaseactivity 126 . The most common <strong>of</strong> these mutations is a T1799A missense mutation thatresults in a valine to glutamic acid substitution at amino acid 600 (V600E, formerlycalled V599E). Mutations in the BRAF gene have been described in a variety <strong>of</strong> humanneoplasms, with its highest incidence in melanoma and nevi (about 70%) 126 .In differentiated thyroid tumors, BRAF mutations appear more exclusively in PTC, witha prevalence <strong>of</strong> about 40%, which constitutes the more common molecular defect in this36
Chapter I : Introductiontype <strong>of</strong> tumor 96 . Although the substitution V600E is the more frequent mutation, K601Esubstitution has also been detected in a small subset <strong>of</strong> PTC, i.e the follicular variant 127 .Among PTCs, BRAF mutations appear more frequently in the classical and tall cellvariants, where the prevalence <strong>of</strong> RET/PTC is usually low. BRAF mutations are alsoassociated to older patients and extrathyroidal extension 95 . Finally, several authorsreported a low prevalence <strong>of</strong> BRAF mutations (about 5%) in radiation-induced thyroidtumors in contrast to sporadic PTC 128,129 , probably related to a different average agebetween the two populations 130 . BRAF mutations in older patients could be due to alonger latency <strong>of</strong> the tumor or a later appearance <strong>of</strong> the mutation compared to RET/PTCrearrangement.BRAF mutation at nucleotide 1799 has also been found in about 15% <strong>of</strong> poorlydifferentiated and anaplastic carcinomas 95,131 . The prevalence was higher in a subset <strong>of</strong>tumors that contained areas <strong>of</strong> well-differentiated PTC 95 . After microdissecting separatelythe areas <strong>of</strong> papillary carcinomas and poorly differentiated or anaplastic carcinomas fromthe same tumor, BRAF mutations were found in both components, providing molecularevidence for the stepwise progression from PTC to ATC.IV.6.2.2 RAS mutationsThe Ras proteins, which consist <strong>of</strong> three subtypes (H-, K- and N-Ras), are a group <strong>of</strong> G-proteins that function in signal transduction pathways by hydrolyzing GTP to GDP. Theirfunction is to modulate extracellular signaling from tyrosine kinase receptors such asEGFR through activation <strong>of</strong> the MAPK cascade.Activating point mutations in the GTP-binding domain or in the GTPase domain <strong>of</strong> theRAS gene family have been shown to occur in various human cancers (detected in up to30% <strong>of</strong> all cancers). Contrary to the previously mentioned genetic alterations, RASmutations are not specific <strong>of</strong> a particular type <strong>of</strong> thyroid tumors. They are found in morethan 30% <strong>of</strong> follicular adenoma and FTC 96 , but are also identified with a less frequencyin PTC (15%), particularly in the follicular variant 132 . A subset <strong>of</strong> poorly differentiatedand anaplastic carcinomas also present RAS mutations (35 and 53%, respectively).37
Chapter I : IntroductionIV.6.2.3 p53 mutationsAll mutations discussed above are mainly found in differentiated thyroid cancers and arebelieved to be not sufficient by themselves to trigger the progression to poorly andanaplastic carcinomas. Additional alterations are required such as p53 mutations.p53 is a polyfunctional phosphoprotein which acts in the nucleus. Upon stressful stimuli,such as DNA damage, multiple post-translationally modifications <strong>of</strong> p53 protein occur,generating increased functional activity via a decrease in the degradation rate and achange <strong>of</strong> conformation. Once activated, p53 acts as a transcription factor for many genesthat contain the consensus p53-binding sites in their promoters such as p21 or bax. Thetarget gene products induced by wild-type p53 mediate its tumor-suppressor function byplaying a direct role in inducing cell cycle arrest, apoptosis, senescence, DNA repair andanti-angiogenesis 133,134 . Cancer cells with deficient p53 function are believed toaccumulate genetic damage and have a selective advantage for clonal expansion.Alterations in p53, usually in exons 5 to 8, are among the most common types <strong>of</strong> geneticdamage in human cancer, usually occurring as a late genetic event 133,134 .In thyroid tumors, p53 mutations occur in 24% and 59% <strong>of</strong> poorly differentiated andanaplastic cancers, respectively, and only in isolated cases <strong>of</strong> PTC and FTC 96 . Moreover,it has been shown that when differentiated and undifferentiated areas are present in thesame tumor, p53 mutation is strictly associated to the undifferentiated area. Finally,transgenic mice with thyroid specific <strong>expression</strong> <strong>of</strong> RET/PTC1 or RET/PTC3 specificallydeveloped PTC, but when they were crossed with p53-/- mice, the new strain <strong>of</strong> animalssuccumbed rapidly as a result <strong>of</strong> poorly differentiated or anaplastic carcinomas 135 . Thesedata give weight to the fact that p53 mutation is a late event in the stepwise progression<strong>of</strong> thyroid carcinogenesis.IV.6.2.4 β-catenin mutationsIn addition to its association with cadherins and the regulation <strong>of</strong> cell-adhesion, β-cateninis a component <strong>of</strong> the Wnt signaling pathway. Activation <strong>of</strong> the Wnt/Wingless pathway38
Chapter I : Introductioninhibits the degradation <strong>of</strong> β-catenin by the adenomatous polyposis coli (APC)multiprotein complex and triggers a dephosphorylation <strong>of</strong> β-catenin. Stabilized,hypophosphorylated β-catenin translocates to the nucleus, where it interacts withtranscription factors <strong>of</strong> the TCF/LEF-1 family, leading to the increased <strong>expression</strong> <strong>of</strong>genes, such as c-myc and cyclin D1. Point mutations in exon 3 <strong>of</strong> the gene stabilize theprotein by making it insensitive for APC-induced degradation. This results in theaccumulation <strong>of</strong> β-catenin in the nucleus and constitutive activation <strong>of</strong> target gene<strong>expression</strong>. β-catenin mutations have been found in various cancers and are believed tobe important in carcinogenesis 136 .In thyroid tumors, mutations in β-catenin have been reported in 16% <strong>of</strong> poorlydifferentiated cancers and in 66% <strong>of</strong> ATC but not in DTC. This occurrence suggests thatmutations in β-catenin play a direct role in the dedifferentiation <strong>of</strong> thyroid cancers,especially those that progress to ATC.IV.6.3 Constitutive activation <strong>of</strong> the MAPK in PTCsTaken together, the gene rearrangements RET/PTC, TRK and AKAP9/BRAF, and theBRAF and RAS point mutations can be detected in up to 70% <strong>of</strong> PTC and rarely overlapin the same tumor 114 . Interestingly, all these genetic alterations act along the samecascade: the MAPK signaling pathway, which is constitutively activated in these tumors.This strongly suggests that constitutive activation <strong>of</strong> this cascade is the initiating event <strong>of</strong>papillary carcinogenesis. This hypothesis is strengthened by the fact that any alteration <strong>of</strong>a single effector <strong>of</strong> this pathway is sufficient for in vitro cell transformation and in vivodevelopment <strong>of</strong> PTC in mice 112-114,123,137 . Moreover, recent findings suggest thatmitogenic effects <strong>of</strong> RET/PTC activation require the presence <strong>of</strong> the functional BRAFkinase 114,138 . Indeed, BRAF silencing in cultured thyroid cells reverses the RET/PTCinducedeffects such as ERK phosphorylation, inhibition <strong>of</strong> thyroid-specific gene<strong>expression</strong>, and increased cell proliferation 114 .To conclude, extensive reports suggest a constitutive activation <strong>of</strong> the MAPK pathway inPTC by genetic alterations <strong>of</strong> its components. Nevertheless, additional alterations arerequired to go further in the dedifferentiation process. ATCs arising from PTCs39
Chapter I : Introductioncommonly display BRAF mutations, but no RET/PTC rearrangements 96 . This could beexplained by the fact that BRAF mutations may facilitate the acquisition <strong>of</strong> secondarygenetic events (such as p53 and β-catenin) through induction <strong>of</strong> genomic instability 139 .IV.6.4 Mutations along the PI3K/Akt signaling pathway in thyroid tumorsThe phosphatidylinositol-3-kinase (PI3K)/Akt signaling pathway plays an important rolein the regulation <strong>of</strong> cell growth, proliferation and survival, and is involved in humantumorigenesis 140,141 . In thyroid cancers, different genetic alterations involving proteinsalong this pathway have been described, including genomic copy number gain andactivating mutations <strong>of</strong> PIK3CA, inactivating mutations and deletions <strong>of</strong> PTEN, and RASmutations 137,138,142,143 . Nevertheless, contrary to the MAPK signaling pathway,involvement <strong>of</strong> this pathway in thyroid carcinogenesis is not extensively described and itsprecise role is not yet known. Based on a single report 144 , occurrence <strong>of</strong> any <strong>of</strong> thegenetic alterations previously mentioned has been reported in 31%, 24%, 55% and 58%<strong>of</strong> benign thyroid adenoma, PTC, FTC and ATC, respectively. This suggests that thePI3K/Akt signaling pathway is more commonly activated in more aggressive anddedifferentiated thyroid cancers and can play a role in the progression <strong>of</strong> these tumors 145 .40
Figure 16. The cDNA microarray technology.
Chapter I : IntroductionV. The microarray technologyExpression genomics examines gene <strong>expression</strong> in a comprehensive and massivelyparallel fashion. Because cellular proteins are difficult to separate, identify and quantify,the core technology focuses on mRNA <strong>expression</strong>. The microarray allows thesimultaneous measure <strong>of</strong> the <strong>expression</strong> <strong>of</strong> thousand mRNA products, giving an accuratepicture <strong>of</strong> gene <strong>expression</strong>. It has made possible to relate physiological cell states to gene<strong>expression</strong> patterns for studying tumors, disease progression, cellular response to stimuli,pathogen detection and drug target identification 146 . Microarrays were initially developedto investigate differential gene <strong>expression</strong> using complex population <strong>of</strong> RNA. Extensions<strong>of</strong> this technology allows the genome-wide analysis <strong>of</strong> copy number imbalances and geneamplification <strong>of</strong> DNA, aberrations in methylation patterns, alternative splicing anddetection <strong>of</strong> single nucleotide polymorphisms (SNPs) 146 .In cancer research, the microarray technology has been widely used to investigate tumorclassification 147-149 , cancer progression 150-152 , as well as chemotherapy resistance andsensitivity 153,154 .V.1 PrincipleThere are mainly two variants <strong>of</strong> microarrays to measure mRNA <strong>expression</strong>: DNA andoligonucleotide microarrays. The first consists <strong>of</strong> numerous probes <strong>of</strong> PCR-amplifiedDNA fragments deposited in a matrix pattern <strong>of</strong> spots on a treated glass surface,crosslinked and dried. The target for these probes is a solution containing cDNA derivedfrom reverse-transcribed mRNA extracted from two cell populations and labeled withtwo fluorescent dyes <strong>of</strong> different colors (e.g. red for tumoral tissue and green for adjacenttissue). Hybridization <strong>of</strong> cDNA derived from two different sources on the samemicroarray is called competitive hybridization and such microarrays must be scanned attwo wavelengths (Figure 16). The other microarray technology uses small single-strandedoligonucleotides (~ 22 nt) synthesized in situ. The leading manufacturer <strong>of</strong> this41
Chapter I : Introductiontechnology is Affymetrix. Each target gene is represented by a number <strong>of</strong> distinctsequences (11-20) collectively termed a probe set. In theory, each probe consists <strong>of</strong>millions <strong>of</strong> single strands <strong>of</strong> DNA <strong>of</strong> exact length and sequence confined to a smallsquare area, that probe the same 25 bp segment <strong>of</strong> a target gene. Biotinylated cRNAderived from a biological sample is hybridized on the microrarray, stained and scanned ata single wavelength. This is not a competitive hybridization method and in order tocompare two samples, two separate microarrays are required. In both technologies, alaser excites the attached fluorescent dyes to produce light which is detected by a scanner.The scanner then generates a digital image which is further processed by specializeds<strong>of</strong>twares to transform the image <strong>of</strong> each spot into a numerical reading. In thecompetitive hybridization, the reading is transformed to a ratio equal to the relativeabundance <strong>of</strong> the target mRNA (labeled with one type <strong>of</strong> fluorophore) from a samplecompared to that <strong>of</strong> a reference sample (labeled with another type <strong>of</strong> fluorophore). Afterbackground substraction, the final step is the normalization which adjusts spot intensitiessuch that the normalized ratios provide an approximation <strong>of</strong> the ratio <strong>of</strong> gene <strong>expression</strong>between the two samples 146 .V.2 Analysis <strong>of</strong> microarray dataThe main objectives <strong>of</strong> microarray data studies can be broadly classified into one <strong>of</strong> thefollowing categories: class comparison, class discovery or class prediction. For the classcomparison aim, the interest is in establishing whether <strong>expression</strong> <strong>pr<strong>of</strong>iles</strong> differ betweenknown classes <strong>of</strong> samples, and if they do, what genes are differentially expressedbetween the classes (e.g. tumoral tissue compared to adjacent tissue). For class discovery,the goal is to elucidate new clusters or structure among specimens or among genes.Examples include discovery <strong>of</strong> previously unrecognized subtypes <strong>of</strong> leukemia andidentification <strong>of</strong> coregulated genes 149 . Finally, the goal <strong>of</strong> class prediction is to predict aphenotype using information from a gene <strong>expression</strong> pr<strong>of</strong>ile. Example includes predictingwhich breast cancer patients will relapse within five years <strong>of</strong> diagnosis versus who willremain disease free 155 .42
gene 2125347681 2 5 6 7 3 4 8gene 1DendogramFigure 17. Hierarchical clustering. Samples are displayed in a space <strong>of</strong> n dimensions where n is thenumber <strong>of</strong> genes. Here is shown an example with 2 genes and 8 samples. Each sample is thusrepresented as a point in the 2 genes dimensions space. Distances between all samples (or clusters)are calculated and the smallest distance between 2 clusters provides a new cluster (first new clustercomposed by samples 1 and 2, second cluster composed by samples 1,2,5 and so on). This procedureis completed until all clusters are merged. Similar clustering can be realized with genes where the ndimensions is the number <strong>of</strong> samples. The hierarchical clustering organizes samples or genes in adendogram.Dimension 2<strong>Gene</strong>1<strong>Gene</strong>2Sample1 Sample2 Sample3 … Sample812534<strong>Gene</strong>3…<strong>Gene</strong>N8 samples, N genesreduction in a 2-dimension space768Dimension 1Figure 18. Multidimensional scaling collapses the high dimensional genes space into two dimensionswhile preserving the distance relationships between all pairs <strong>of</strong> samples. Here, 8 samples are displayed on atwo-dimensional grid after reduction <strong>of</strong> the N dimensions (N= number <strong>of</strong> genes) to 2 dimensions. In thisMDS, samples 1 and 2 display a more similar gene <strong>expression</strong> pr<strong>of</strong>ile than samples 1 and 8, for instance.
Chapter I : IntroductionWhen class discovery is the goal, unsupervised analysis strategies such as clusteringmethods and multidimensional scaling (MDS) can be used. For class comparison or classprediction, supervised analysis methods that use known class information (such as tumorversus normal designations) are most effective.V.2.1 Unsupervised methodsUnsupervised clustering methods seek structure inherent in the data and assume no apriori classifications <strong>of</strong> the genes and samples. Their goal is to separate samples or genesinto subgroups <strong>of</strong> related <strong>expression</strong> patterns in an unbiased manner. One <strong>of</strong> the mostwidely used clustering approaches for microarray data is hierarchical clustering 156 . In thisprocedure, each individual (sample or gene) starts as its own cluster, and then pairs <strong>of</strong>clusters that are more similar are merged to form new clusters (Figure 17). There are alsoalternatives to hierarchical clustering such as multidimensional scaling, which displayssamples in two-dimensions trying to distort as less as possible the distance between them(Figure 18). In this diagram, two close samples have a more similar gene <strong>expression</strong>pr<strong>of</strong>ile than two samples far from each other.V.2.2 Supervised methodsFor class comparison, researchers usually identify genes that are differentially expressedbetween known classes <strong>of</strong> specimens using SAM (Statistical Significance <strong>of</strong>Microarray) 157 . This procedure avoids normality assumptions, and handles efficiently thefact that thousands statistical tests are conducted at once by estimating statisticalsignificance in term <strong>of</strong> q-values. In simple words, using SAM, a gene with atumoral/normal ratio <strong>of</strong> 2 and a q-value <strong>of</strong> 0.05 means that this gene is upregulated by 2-fold on average in the tumor compared to the normal tissue and its probability to be afalse positive is 5%.Sometimes, it is desired to develop a multivariate predictor <strong>of</strong> tumor classification. Forexample, there may be a number <strong>of</strong> gene markers whose collective behavior may predictwith substantial accuracy whether a tumor will respond to a particular chemotherapeutic43
Chapter I : Introductionagent. Here, the tissues are already divided into classes and the question is how to bestmathematically combine the gene <strong>expression</strong> measurements into a single function thatcan delineate those classes. Different linear classification procedures can be used to doclass prediction, such as linear kernel support vector machines (LKSVM), generalizedpartial least square (GPLS), prediction analysis <strong>of</strong> microarrays (PAM) and random forest(RF).In order to estimate the accuracy <strong>of</strong> the output class prediction rule, the leave-one-outcrossvalidation is commonly used: each <strong>of</strong> the samples is individually removed from thedata set, the remaining data is used to train class prediction rule, and the resulting rule isapplied to predict the class <strong>of</strong> the left-out sample. The accuracy <strong>of</strong> the class predictionrule is assessed by the number <strong>of</strong> true or false assignments in the samples that have beenleft.A frequent experimental question is whether statistically significant differences betweenthe <strong>expression</strong> <strong>pr<strong>of</strong>iles</strong> <strong>of</strong> samples from different classes exist. This can be assessed byestimating whether the accuracy achieved by a class prediction rule is better than wouldbe obtained by chance. For the analysis <strong>of</strong> numerous markers as are generated frommicroarray experiments, this is assessed by randomly permuting the class designationsand measuring whether this degrades the predictive accuracy. The confidence in theputative association between <strong>expression</strong> <strong>pr<strong>of</strong>iles</strong> and their class designations can beestimated by the frequency <strong>of</strong> false positives 158 .44
Chapter II : Aim <strong>of</strong> the work
Chapter II : Aim <strong>of</strong> the workChapter II. Aim <strong>of</strong> the workAlthough it substantially varies according to countries, cancer is presently responsible forabout 25% <strong>of</strong> all deaths and accounts for more deaths than heart disease in persons under85 years old 159 . Much progress has been made during the last decades in developing newdrugs, reducing mortality rates and improving survival. The key element for thissignificant advance is a better understanding <strong>of</strong> the molecular mechanisms responsiblefor these cancers. In this thesis, we have provided a molecular analysis <strong>of</strong> thyroidcarcinomas, particularly papillary and anaplastic thyroid carcinomas, in order to betterunderstand the physiopathology <strong>of</strong> these tumors.The microarray technology enables to study simultaneously the <strong>expression</strong> level <strong>of</strong>thousands <strong>of</strong> genes, contrary to other techniques that are limited to one gene. It providesthe molecular fingerprinting, or gene <strong>expression</strong> pr<strong>of</strong>ile, <strong>of</strong> a sample. Comparisonbetween molecular <strong>pr<strong>of</strong>iles</strong> <strong>of</strong> tumor and normal tissue enables to identify differencesexisting between both samples. In this thesis, we wanted to establish the gene <strong>expression</strong><strong>pr<strong>of</strong>iles</strong> <strong>of</strong> papillary thyroid carcinoma (PTC) and anaplastic thyroid carcinoma (ATC)using microarrays, to have more insights on their physiopathology. We first developedand optimized in our laboratory a technique to amplify RNA in order to have a sufficientamount <strong>of</strong> starting material to hybridize on microarray slides. We then hybridized 26PTCs on Agilent microarray slides covering 12000 ESTs, which constitutes the main part<strong>of</strong> this thesis. During the last year <strong>of</strong> the thesis, the molecular pr<strong>of</strong>ile <strong>of</strong> ATC wasassessed using the Affymetrix technology. To compare ATC with PTC on a sameplatform, part <strong>of</strong> our PTCs and normal tissues were also hybridized on Affymetrix slides.The aim <strong>of</strong> these experiments was double. Firstly, we wanted to investigate if molecularsignatures were able to distinguish different subtypes <strong>of</strong> tumors according to differentcriteria such as the etiology <strong>of</strong> the tumors, the identified genetic alterations, thehistological variants, the sex, … Secondly, we aimed to analyze in details the regulatedgenes between the pathological and adjacent tissues to give a general view <strong>of</strong> theregulation <strong>of</strong> different signaling pathways and processes in thyroid tumors. We alsocorrelated the molecular <strong>pr<strong>of</strong>iles</strong> <strong>of</strong> PTCs with their biological phenotype.45
Chapter II : Aim <strong>of</strong> the workAnother part <strong>of</strong> this thesis was dedicated to investigate the regulation <strong>of</strong> FAK at proteinlevel. FAK is a major protein involved in integrin signaling and microarray analysis <strong>of</strong>PTCs has revealed a potential activation <strong>of</strong> this cascade in these tumors. Theseexperiments were therefore performed to test this hypothesis.Finally, the last part <strong>of</strong> this thesis concerned the study <strong>of</strong> the RET/PTC rearrangement,which is considered as a leading event in PTC tumorigenesis. Nevertheless, it has beenshown that some tumors displayed this rearrangement only in a small subset <strong>of</strong> tumoralcells. Therefore, we investigated the potential role <strong>of</strong> cells displaying a RET/PTCrearrangement on the proliferation <strong>of</strong> non-rearranged cells in order to provide moreinsight into the development <strong>of</strong> these heterogeneous tumors.46
Chapter III : Results
mRNA5’ AAA…AA 3’1/3’Oligo-dTT7 Promoter5’mRNAFirst cDNAstrand5’ AAA…AA 3’3’Oligo-dT T7 Promoter5’2/First cDNAstrand5’3’AAA…AAOligo-dTT7 PromoterT7 Promoter3’5’Second cDNAstrandFirst cDNAstrand5’3’3/AAA…AAOligo-dTT7 PromoterT7 promoter3’5’4/antisens RNA3’UUU…UU5’Figure 19. in vitro RNA amplification and transcription. 1/ The first strand synthesis is performed usingSuperscript II and a primer consisting to an oligo-dT18 followed by the sequence <strong>of</strong> the T7 phage RNApolymerase. 2/ The second cDNA strand is synthesized using E.Coli DNA polymerase, RNase H andE.Coli DNA ligase. 3/ It generates double strand cDNA with a T7 promoter. 4/ Transcription step: RNApolymerase is added to synthesize antisens RNA from cDNA.LadderPTC6NPTC6PTC7NPTC7PTC8NPTC8PTC9NPTC96000 b3000 b200 bFigure 20. Antisens RNA from different tumors (PTC) and adjacent tissues (NPTC) obtained by invitro transcription and run on the Experion (Biorad). About 300 ng were loaded. The size distributionranges from 200 b to 3000 b.
Chapter III : ResultsChapter III. ResultsI. Development and optimization <strong>of</strong> a RNA amplification protocol by invitro transcription and its combination with microarray experimentsMicroarray experiments require a large amount <strong>of</strong> total RNA that we usually do notobtain from our tissues. Indeed, the papillary and anaplastic thyroid tissues receivedenabled us to extract only 5 to 10 µg <strong>of</strong> total RNA, sometimes less, which is not enoughfor a microarray experiment. Consequently, we decided to develop and optimize in ourlaboratory a protocol to amplify the starting mRNA: the RNA amplification technique byin vitro transcription. This technique was initially developed by the group <strong>of</strong> Eberwine 160and is more efficient than the TSA method (Tyramide Signal Amplification) which wasthe method used in the laboratory before 2002.I.1 Optimization <strong>of</strong> an RNA amplification protocolWe developed and optimized the protocol using RNA from 2 thyroid tumor cell lines:KAT 10, derived from a papillary thyroid carcinoma (PTC), and FTC 13342, derivedfrom a follicular thyroid carcinoma (FTC). The starting protocol was provided by PaulVan Hummelen (VIB, Microarray Facility Leuven) and needed enzymes from Invitrogen(Paisley, UK) for cDNA synthesis and a kit from Epicentre Biotechnologies (Madison,WI) for the amplification step. This protocol required initially 5 µg <strong>of</strong> total RNA and a 3hours transcription step time (Figure 19). The results we obtained with these conditionswere satisfactory: migration <strong>of</strong> antisens RNA on denaturing agarose gel electrophoresisand on the Experion (Bio-Rad) gave a size distribution ranging from 200 b to about 3000b (Figure 20); 15 µg <strong>of</strong> antisens RNA were produced, corresponding to a 150 foldamplification (considering 2% <strong>of</strong> mRNA among the total RNA). According to theliterature 161 , it was possible to get a larger amount <strong>of</strong> antisens RNA by increasing the47
28s18s1 2 3 4 5 6 7 8 9Figure 21. Antisens RNA produced after different incubation times during the transcription step.Approximately 1 µg <strong>of</strong> antisens RNA was loaded in each well from a 1% agarose gel. Lanes 1 to4 : antisens RNA from KAT 10 cell line after 3, 4, 5 and 6 hours <strong>of</strong> transcription, respectively.Lane 5 : Total RNA (used as reference). Lanes 6 to 9 : antisens RNA from FTC 13342 cell lineafter 3, 4, 5 and 6 hours <strong>of</strong> transcription, respectively.28s18s1 2 3 4 5 6 7 8 9Figure 22. Antisens RNA synthesized from different amount <strong>of</strong> total RNA. Approximately 1 µg<strong>of</strong> antisens RNA was loaded in each lane and run on a 1% agarose gel. Lanes 1 to 4 : KAT 10antisens RNA from 0.5, 1, 3 and 5 µg <strong>of</strong> total RNA, respectively. Lane 5 : Total RNA (used asreference). Lanes 6 to 9 : FTC 13342 antisens RNA from 0.5, 1, 3 and 5 µg <strong>of</strong> total RNA,respectively.
Chapter III : Resultsincubation time <strong>of</strong> the transcription step without alteration <strong>of</strong> the starting RNArepresentativity. We thus increased the incubation time <strong>of</strong> the transcription step (3, 4, 5, 6hours) and observed an increasing amount <strong>of</strong> antisens RNA synthesized with a plateauafter 4-5 hours without modification <strong>of</strong> the size distribution (Figure 21). A 5 hourstranscription step gave an amplification <strong>of</strong> 200 fold and we decided to choose this timefor the next experiments because it generated a satisfactory amount <strong>of</strong> antisens RNA forour microarray experiments.According to the literature 161 , an amplification from a smaller amount than 5 µg <strong>of</strong>starting RNA do not change its representativity. So different experiments with 500 ng, 1µg, 3 µg and 5 µg <strong>of</strong> starting RNA were performed to evaluate this. The results obtaineddid not show any differences across experiments in terms <strong>of</strong> size distribution (figure 22).This will thus allow us to perform experiments with tumors for which less than 5 µg <strong>of</strong>total RNA are available.I.2 Combination <strong>of</strong> an amplification protocol with a cDNA labelling protocolThe next step was to combine our amplification method with a labelling protocol tohybridize our samples on microarray slides. We were confronted with some difficultiesduring this procedure. The first protocol we tried was a direct labelling (protocol fromPerkin Elmer), with incorporation <strong>of</strong> Cyanine 3 and 5 during the cDNA synthesis. Thesuccess <strong>of</strong> the fluorophores incorporation during the reverse-transcription can be assessedby observation <strong>of</strong> a slight labelled cDNA smear on an agarose gel. This protocol wassuccessfully completed from total RNA and using an oligo-dT as primer. Nevertheless,no labelled cDNA smear was observed when we used antisens RNA and random primers(which were required because antisens RNA display an inverse orientation compared tomRNA). Different tests as well as the use <strong>of</strong> alternative labelling protocols (Invitrogenand Amersham) led us to conclude that the use <strong>of</strong> random primers was at the origin <strong>of</strong> ourfailure to synthesize correctly cDNA.48
28s18s1 2 3 4 5Figure 23. Antisens RNA synthesized from different protocols <strong>of</strong> RNA amplification. 1 µg <strong>of</strong>antisens RNA was loaded in each lane and run on a 1% agarose gel. Lanes 1 and 2 : antisens RNAfrom KAT 10 and FTC 13342 cell lines, respectively, with our protocol <strong>of</strong> RNA amplification.Lane 3 : Total RNA (used as reference). Lanes 4 and 5 : antisens RNA from KAT 10 and FTC13342 cell lines, respectively, with the protocol <strong>of</strong> RNA amplification from Eric Cabanne.antisens RNA3’UUU…UU5’+ Random primers+ dATP, dGTP, dTTP, dCTP+ amino-allyl dUTPNH 2antisens RNA3’UUU…UU5’5’ cDNANH 2NH 2NH 2NH 2NH 2NH 2cDNA+ Cydye NHSFigure 24. Indirect labelling with amino-allyl groups. From the antisens RNA, a reverse-transcription isrealized with random primers, non-modified nucleotides and amino-allyl dUTP. After cDNA synthesis,an ester (N-hydroxylsuccinimidyl ester) coupled with a fluorophore (Cy3 or Cy5) can react with theamino-allyl groups to create a covalent bond between the fluorophore and the amine while the NHS isreleased.
Chapter III : ResultsWe then decided to use an indirect labelling protocol received from Eric Cabanne(Institut Pasteur, Paris). This protocol also contained an in vitro transcription step in partsimilar to ours but with an additional amplification step : a linear PCR using a singleprimer 162 . This additional step enabled to increase the amount <strong>of</strong> antisens RNA produced(40 µg instead <strong>of</strong> 20 µg with our previous protocol, both with a starting amount <strong>of</strong> 5 µg<strong>of</strong> total RNA).When comparing “our” previous amplification with the amplification from the Cabanne’sprotocol, we observed a smaller average size <strong>of</strong> antisens RNA with the Cabanne’sprotocol (Figure 23). Moreover, this protocol generated a discontinuous smear withdiscrete bands, suggesting a preferential amplification <strong>of</strong> some RNA. Because this couldintroduce biases in the interpretation <strong>of</strong> the data, we decided to use our amplificationprotocol, even if it generated a lesser amount <strong>of</strong> antisens RNA.However, we used the indirect labelling procedure from the protocol <strong>of</strong> Eric Cabanne.This labelling consisted in incorporating modified nucleotides with an amino-allyl groupduring the reverse-transcription <strong>of</strong> the antisens RNA. This protocol also used randomprimers. Then, the amino-allyl groups could react with an ester (N-hydroxylsuccinimydyl-ester) coupled with a fluorophore (Cyanine 3 or 5) allowing to label cDNAwith Cy3 or Cy5 (Figure 24). This protocol was successfully completed from total RNAwith oligo-dT, and also from antisens RNA with random primers.In conclusion, this protocol, which used amino-allyl-dUTP during the reversetranscriptionenabled to label cDNA with fluorophores from antisens RNA, contrary toour previous protocol, which directly incorporated fluorophores (see above). Oneexplanation for this might be that amino-allyl-dUTP, a smaller molecule than Cy3/Cy5-dUTP, would be better incorporated during the reverse transcription step.I.3 Validation <strong>of</strong> our protocolTo definitely validate our amplification step combined with an indirect labelling, wewanted to see if this protocol was reproducible using microarray experiments. A first test49
A/Total RNA from KAT 10 cell lineRNA amplificationCyanine 3 probeRNA amplificationCyanine 5 probeHybridization on the same slide. Correlationbetween Cy3 and Cy5 intensities = 99.7%Figure 25. Validation <strong>of</strong> ouramplification protocol combined with anindirect labelling procedure. A/Correlation <strong>of</strong> intensities between a Cy3probe and a Cy5 probe from separatedRNA amplifications. B/ Correlationbetween intensity ratios KAT10/FTC13342 from separated RNAamplifications. C/ Comparison betweenratio KAT10/FTC13342 obtained fromamplified RNA and ratioKAT10/FTC13342 from non amplifiedRNA.B/KAT 10 cell lineFTC 13342 cell lineKAT 10 cell lineFTC 13342 cell lineRNA amplificationRNA amplificationRNA amplificationRNA amplificationRatio KAT10/FTC13342Ratio KAT10/FTC13342Correlation between intensity ratios = 93%C/KAT 10 cell lineFTC 13342 cell lineKAT 10 cell lineFTC 13342 cell lineRNA amplificationRNA amplificationNO amplificationNO amplificationRatio KAT10/FTC13342Ratio KAT10/FTC13342Correlation between intensity ratios = 88.7%
Chapter III : Resultsconsisted to amplify 2 times separately total RNA from the KAT 10 cell line and tohybridize the labelled cDNA on the same microarray slide. This is called a “yellow”experiment because if the protocol is fully reproducible, we should find only yellow spotson the slide (same amount <strong>of</strong> cyanine 3 and 5). The correlation between Cy3 and Cy5intensities on the same microarray slides was 99.7%, suggesting that this protocol wasindeed highly reproducible (Figure 25a). A second test consisted in comparing theintensity ratios <strong>of</strong> two microarray experiments consisting <strong>of</strong> the hybridization <strong>of</strong> thecDNA from the KAT10 and FTC 13342 cell lines. RNA amplification <strong>of</strong> these cell lineswas realized two times separately (Figure 25b) and a dye-swap for each experiment wasperformed. The correlation we obtained between the intensity ratios <strong>of</strong> the twoexperiments was 93%. A similar experiment was performed using a thyroid tumor vs itsnormal tissue counterpart. The correlation was 94.9%. These 3 experiments convinced usthat this protocol was reproducible. A fourth experiment was realized to assess if theamplification step modified the representativity <strong>of</strong> the starting RNA. We compared theintensity ratios <strong>of</strong> KAT 10 cell line vs. FTC 13342 cell line obtained from the protocolwith the amplification step and the protocol without the amplification step (in this case,the reverse-transcription with incorporation <strong>of</strong> amino-allyl was directly done from totalRNA using oligo-dT) (Figure 25c). The correlation was 88.7%, suggesting that theamplification step did not modify the representativity <strong>of</strong> the starting mRNA. Note that thesame experiment with the amplification step from Eric Cabanne’s protocol gave acorrelation <strong>of</strong> 70%. This lower correlation could be related to the observation <strong>of</strong> discretebands <strong>of</strong> antisens RNA on an agarose gel.I.4 ConclusionThese experiments enabled us to optimize a RNA amplification technique, to combine itwith an indirect labelling procedure, and to validate its reproductibility across differentexperiments. In addition, the method preserves the representativity <strong>of</strong> the initial RNApopulation. This protocol was further used to amplify all our tumoral/non tumoral PTCtissues and hybridize them on microarray slides as described in the §III.2 <strong>of</strong> the resultschapter.50
Figure 26. Map <strong>of</strong> Plasmid pSPORT1 (from Invitrogen).
Chapter III : ResultsII.Thyroid cDNA library constructionIn 2000, IRIBHM had the willingness to construct its own cDNA microarray slides.Frédérick Libert was in charge <strong>of</strong> this tremendous project and he deposited differentcDNA libraries on microarray slides (leucocytes, lymphocytes and human foetal braincDNA libraries). A main research area <strong>of</strong> IRIBHM has always been the thyroid but nospecific clones from thyroid were deposited so far on the slides. We thus decided toconstruct a thyroid cDNA library to complete the pre-existing ones and to allow to findspecific thyroid clones on home-made cDNA microarray slides.This library was constructed from different normal and pathological thyroid tissues: PTCfrom the region <strong>of</strong> Chernobyl and from France, follicular adenomas and carcinomas,autonomous adenomas, adjacent tissues <strong>of</strong> the tumors, hyperthyroidy, multinodulargoitres and primary cultures. 500 µg <strong>of</strong> total RNA were required to construct this libraryaccording to the Invitrogen kit used: “Superscript TM Plasmid System with Gateway TMTechnology for cDNA Synthesis and Cloning”.We first isolated intact mRNA and eliminated rRNA and tRNA using the Dynal kitfollowing the manufacturer’s protocol. From the reverse-transcription step until the end<strong>of</strong> the library construction, we followed the Invitrogen protocol. The reverse-transcriptionwas performed from an oligo-dT primer coupled with a NotI restriction site to obtain thefirst strand <strong>of</strong> cDNA, followed by second strand cDNA synthesis. Incorporation <strong>of</strong> α- 32 PdCTP during cDNA synthesis enabled to assess the efficiency <strong>of</strong> the reverse-transcriptionand the concentration <strong>of</strong> the cDNA. A ligation step <strong>of</strong> adaptators containing a SalIrestriction site was then performed, followed by a digestion with Not1 to generate cDNAwith two different extremities (NotI-SalI). A final chromatography step allowed toseparate cDNA according to their size.Height different fractions were obtained and directionally inserted in the pSPORT1vector (Figure 26), containing the ampicillin resistance gene. After electroporation inE.Coli, we selected on LB agar dishes bacteria resistant to ampicillin. Different cDNAlibraries were constructed with different cDNA average sizes, containing 30000 to120000 clones each.51
Chapter III : Results50 clones from 3 different fractions were selected to determine their cDNA average size.Primers were selected to amplify the cDNA insert (fw:TGCACGCGTACGTAAGCTTGG, rev: AGGTACCGGTCCGGAATTCCC) and PCRwere performed in a total volume <strong>of</strong> 15 µl with 0.6 µl <strong>of</strong> home-made Taq DNApolymerase, 1.5 µl <strong>of</strong> buffer 10× (New England Biolabs, Hitchin, UK), 0.6 µl <strong>of</strong> dNTP(Invitrogen, Paisley, UK) and 1µl <strong>of</strong> primers 10 µM. The following conditions wereapplied:1/ 4 min at 95°C2/ 1 min at 95°C3/ 1 min at 60°C4/ 2 min 30 sec at 72°C5/ 10 min at 72°CSteps 2/, 3/ and 4/ were repeated 30 times.The library containing the longer cDNA fragments had an average size <strong>of</strong> 1300 bp, thesmaller, 1000 bp. This small difference was probably due to the weak selectivity <strong>of</strong> thechromatography step.We used the library containing the higher cDNA average size (1300 bp) for themicroarray slides manufacturing. About 50000 clones from this library were spread onLB agar dishes containing ampicillin. As the pSPORT1 vector contained the LacOPZgene (Figure 26), we added 15 µl <strong>of</strong> IPTG (100 mM) and 40µl <strong>of</strong> XGAL (20 mg/ml <strong>of</strong>dimethyl-formamide) to the dishes to distinguish clones containing an insert (whitecolonies) from the others (blue colonies). A bio-piquor was then used to put each whitecolony in 96 wells PCR plates and the clones were incubated overnight in TB medium(Invitrogen, Paisley, UK) containing ampicillin (100 µg/ml). Glycerol 30% was thenadded to keep the colonies at -80°C. A PCR was finally done on each clone usinguniversal primers and the amplified products were deposited by Frédérick Libert on themicrorray slides.This thyroid cDNA library construction enabled the improvement <strong>of</strong> the microarrayplatform at the IRIBHM by increasing the diversity <strong>of</strong> the clones present on the52
Chapter III : Resultsmicroarray slides. However, only 3000 clones were sequenced on these home-madecDNA microarray slides when we finished this library, which was not enough to study indetails the molecular pr<strong>of</strong>ile <strong>of</strong> thyroid cancers. As it would have taken to much time tosequence the rest <strong>of</strong> the library, we next decided to hybridize our tumoral samples oncommercial Agilent cDNA microarray slides (see next §). Nervetheless, home-madecDNA slides are still produced and successfully used by other researchers in thelaboratory, for projects requiring a large amount <strong>of</strong> slide hybridizations 163-165 .53
SampleAge in Age at dominant Regional BRAFOrigin SexID1986 operation sub-type metastasis mutationRET/PTCPTC11 FR F 22 37 pap + - -PTC14 FR M 17 32 fol NA - -PTC18 FR F NA 59 pap NA + -PTC19 FR M 54 68 fol - - +PTC20 FR F 54 68 pap + + -PTC21 FR F 39 54 fol - - +PTC22 FR F 44 60 pap - - -PTC23 FR M 17 33 fol - - -PTC25 FR F 49 60 trab - - -PTC26 FR F 36 47 pap - + -PTC6 FR M 24 37 pap + - -PTC7 FR F 13 29 pap - + -PTC8 FR M 22 36 pap + - +PTC9 FR F 24 38 pap + + -S404 CTB F 1 16 pap + - -S405 CTB F 1 16 pap + - +S409 CTB F 11 28 pap - + -S414 CTB F 16 33 fol - - +S415 CTB M 12 28 pap + + -S418 CTB M 10 27 fol - + -S420 CTB F 12 28 sol - - -S422 CTB M 15 31 pap - + -S423 CTB F 5 22 pap - + -S425 CTB M 3 19 fol + - +V519 CTB F 2 18 pap + - +V608 CTB F 15 32 pap + - +Table 2. Clinical, histological and gene alterations data <strong>of</strong> the PTC hybridized on the Agilentmicroarray slides. Abbreviations: FR, PTC from France; CTB, PTC from the Chernobyl TissueBank; pap, papillary; fol, follicular; trab, trabecular; sol, solid; F, female; M, male; +, yes; -,no; NA, not available
Chapter III : ResultsIII.Identification <strong>of</strong> potential molecular signatures related to clinical data <strong>of</strong>PTCThe gene <strong>expression</strong> pr<strong>of</strong>ile <strong>of</strong> 26 PTC was assessed by microarray using Agilentmicroarray slides, containing 12000 cDNAs and covering 8000 genes (see method in§II.3.1 <strong>of</strong> chapter V). It enabled us to identify many genes differentially expressedbetween tumoral and adjacent thyroid tissues. Clinical data for these PTC were available(Table 2) and one <strong>of</strong> the aims <strong>of</strong> this thesis was to identify potential molecular signatureswhich could be related to these clinical data.To do that, the bio-informaticien <strong>of</strong> our group, Vincent Detours, used StatisticalSignificance <strong>of</strong> Microarray (SAM) to detect genes associated with binary categories. Hewas not able to identify a molecular signature separating the tumors on the basis <strong>of</strong>different clinical parameters, such as the sex <strong>of</strong> the patients, the absence vs presence <strong>of</strong>regional metastasis, their BRAF vs RET/PTC status, or separating sporadic and post-Chernobyl PTC, but found a molecular signature associated to the classical papillaryvariant. Although SAM did not work, different linear classification procedures used forclass prediction (LKSVM: linear kernel support vector machines, GPLS: generalizedpartial least square, PAM: prediction analysis <strong>of</strong> microarrays, RF: random forest) weresuccessfully used to separate the sporadic and the post-Chernobyl tumors.In this section, we describe the molecular signature allowing to discriminate the classicalpapillary variant <strong>of</strong> PTC from the other variants, and the signature separating sporadicPTC from post-Chernobyl PTC.III.1 Characterization <strong>of</strong> the molecular signature discriminating the classicalpapillary variant from the other forms <strong>of</strong> PTCDifferent pathological subtypes <strong>of</strong> PTC have been described, including the classical,follicular, solid and trabecular variants 74 . These different histological phenotypes suggest54
<strong>Gene</strong> symbol GenBank Acc. Num. Expression ratio pap/other q-valueUpregulated genes in the classical papillary variantAHNAK M80899 1.74 0.0312AHR AA844153 2.30 0.0137ANXA2 BF084103 2.14 0.0308ARHE AV652953 2.83 0.0144ARNTL U69202 2.46 0.0308ASNS BC014621 2.83 0.0137CCNA1 U66838 2.14 0.0155CDKN2B L36844 2.30 0.0137CSPG2 X15998 4.59 0.0367CYP1B1 U03688 4.92 0.0110DAF BC001288 2.46 0.0137DUSP5 U16996 2.83 0.0231FN1 BC005858 3.25 0.0137FXYD3 AA826766 4.59 0.0308GSN BG763361 1.87 0.0312IL1RAP AB006537 2.64 0.0137IL8 BG777366 5.66 0.0137KIAA1518 AK002094 1.52 0.0155MAP3K5 D84476 1.87 0.0414MMP16 AI192539 3.03 0.0340MMP7 BC003635 4.00 0.0393MRC1 X55635 3.73 0.0308NP BE266250 2.64 0.0393PLAU M15476 3.03 0.0308PLAUR U09937 2.64 0.0284ROR1 M97675 3.25 0.0137SEMA3C BG938585 3.03 0.0393SEPT8. D86957 1.74 0.0137SLIT2 AB017168 2.64 0.0110STK38 BC012085 1.74 0.0340TFAP2C AA513207 2.00 0.0286Downregulated genes in the classical papillary variantAQP4 AK026728 0.38 0.0250ARHN AI554560 0.38 0.0428ATP6V1G2 AW962223 0.62 0.0433COX4I2 AF257180 0.57 0.0253DUOX1 AF213465 0.38 0.0231EDN3 X52001 0.27 0.0308FLJ13868 AK000679 0.66 0.0433FLJ14957 AK027863 0.50 0.0308HIST1H1C X57129 0.47 0.0155HLF M95585 0.35 0.0308HSD17B1 AU138888 0.62 0.0231KHK X78678 0.62 0.0491KIAA0574 AB011146 0.41 0.0170KIAA0789 AB018332 0.33 0.0428MASS1 BG187161 0.44 0.0137OS-9 BF307256 0.66 0.0500PIB5PA BI254887 0.33 0.0475PLA2G3 AF220490 0.44 0.0433RAM2 BC009352 0.66 0.0308SALL2 X98834 0.57 0.0428SLC15A2 S78203 0.54 0.0231TIP120B AA971779 0.57 0.0346TMPRSS3 AB038157 0.41 0.0272Table 3. Upregulatd and downregulated genes in the classical papillary variantcompared to the other variants.
Chapter III : Resultsthat they might display, at least partially, different gene <strong>expression</strong> <strong>pr<strong>of</strong>iles</strong>. Consequently,we decided to investigate genes associated to these different variants using SAM.The most frequent histological variant is the classical PTC, displaying characteristicpapillary architecture which completely differs from the follicular architecture <strong>of</strong> thenormal thyroid and the follicular variant <strong>of</strong> PTC. To associate genes to the papillaryarchitecture, we compared tumors with a papillary dominant variant (> 50% <strong>of</strong> cells wereorganized in papillae according to the pathologist, n = 17) to the other tumors (n = 9)(Table 2). SAM revealed that 75 GenBank accession numbers, corresponding to 54known single genes, were differentially expressed between both types <strong>of</strong> tumors with a q-value < 0,05 (31 up, 23 down) (Table 3).To attempt to give a biological signification to this gene list, we assessed the mostrepresentative biological activities using the statistical methods from the DAVIDs<strong>of</strong>tware 166 , which finds the most represented modulated functions according to the <strong>Gene</strong>Ontology (GO) annotations. Among the 54 known genes, DAVID recognized 46 geneswhich were used for further analysis. Interestingly, among the 16 biological processescategories with a p-value < 0.05 identified by DAVID, 9 were directly related to themovement <strong>of</strong> cells (Table 4). Moreover, 3 out <strong>of</strong> 4 cellular component categories with ap-value < 0.05 were directly related to the external environment <strong>of</strong> the cell or its plasmamembrane (table 5). It included proteins <strong>of</strong> the extracellular matrix (FN1, CSPG2),proteases (MMP7, MMP16, PLAU), and receptor for proteases (PLAUR), which were alloverexpressed in the classical variant <strong>of</strong> PTC compared to the other variants (Table 3).These results strongly suggested that genes <strong>of</strong> this signature are related, at least partially,to the very important remodeling observed in the classical PTC compared to the othervariants. Indeed, this important remodeling requires an alteration <strong>of</strong> the extracellularmatrix, both by over<strong>expression</strong> <strong>of</strong> their components and degradation by proteases.Moreover, cells have to change their organization and to move in order to form thecharacteristic papillae observed in the classical variant. The fact that many genes <strong>of</strong> theGO categories related to cell movement are also present in the GO categories related toextracellular environment (SLIT2, PLAUR, PLAU, IL8, FN1, MMP7, MMP16) is inaccordance with these structural modifications.55
Biological processes categoriesGO identifier GO name Definition according GO P-valueGO:0042221GO:0009628GO:0042330GO:0006935GO:0007626GO:0009605GO:0050920GO:0050921GO:0007610GO:0009611response to chemicalstimulusresponse to abioticstimulustaxischemotaxislocomotory behaviorresponse to externalstimulusregulation <strong>of</strong>chemotaxispositive regulation <strong>of</strong>chemotaxisbehaviorresponse to woundingA change in state or activity <strong>of</strong> a cell or an organism (in terms <strong>of</strong>movement, secretion, enzyme production, gene <strong>expression</strong>, etc.) as a result<strong>of</strong> a chemical stimulus.A change in state or activity <strong>of</strong> a cell or an organism (in terms <strong>of</strong>movement, secretion, enzyme production, gene <strong>expression</strong>, etc.) as a result<strong>of</strong> an abiotic (non-living) stimulus.The directed movement <strong>of</strong> a motile cell or organism in response to anexternal stimulusThe directed movement <strong>of</strong> a motile cell or organism, or the directed growth<strong>of</strong> a cell guided by a specific chemical concentration gradient. Movementmay be towards a higher concentration (positive chemotaxis) or towards alower concentration (negative chemotaxis).The specific movement from place to place <strong>of</strong> an organism in response toexternal or internal stimuli. Locomotion <strong>of</strong> a whole organism in a mannerdependent upon some combination <strong>of</strong> that organism's internal state andexternal conditions.A change in state or activity <strong>of</strong> a cell or an organism (in terms <strong>of</strong>movement, secretion, enzyme production, gene <strong>expression</strong>, etc.) as a result<strong>of</strong> an external stimulus.Any process that modulates the frequency, rate or extent <strong>of</strong> the directedmovement <strong>of</strong> a motile cell or organism in response to a specific chemicalconcentration gradient.Any process that activates or increases the frequency, rate or extent <strong>of</strong> thedirected movement <strong>of</strong> a motile cell or organism in response to a specificchemical concentration gradient.The specific actions or reactions <strong>of</strong> an organism in response to external orinternal stimuli. Patterned activity <strong>of</strong> a whole organism in a mannerdependent upon some combination <strong>of</strong> that organism's internal state andexternal conditions.A change in state or activity <strong>of</strong> a cell or an organism (in terms <strong>of</strong>movement, secretion, enzyme production, gene <strong>expression</strong>, etc.) as a result<strong>of</strong> a stimulus indicating damage to the organism.0.000680.001410.004920.004920.005490.013600.013630.013630.017060.02359GO:0006928 cell motility Any process involved in the controlled movement <strong>of</strong> a cell. 0.02778GO:0040011 locomotionSelf-propelled movement <strong>of</strong> a cell or organism from one location toanother.0.02778GO:0051674 localization <strong>of</strong> cellThe processes by which a cell is transported to, and/or maintained in, aspecific location.0.02778GO:0006950 response to stressA change in state or activity <strong>of</strong> a cell or an organism (in terms <strong>of</strong>movement, secretion, enzyme production, gene <strong>expression</strong>, etc.) as a result<strong>of</strong> a stimulus indicating the organism is under stress. The stress is usually, 0.03013but not necessarily, exogenous (e.g. temperature, humidity, ionizingradiation).GO:0016477 cell migrationThe orderly movement <strong>of</strong> cells from one site to another, <strong>of</strong>ten during thedevelopment <strong>of</strong> a multicellular organism.0.03292GO:0008037 cell recognitionThe process by which a cell in a multicellular organism interprets itssurroundings.0.04560Table 4. Biological processes related to gene <strong>expression</strong> analysis in the classical variants <strong>of</strong> PTCidentified by the DAVID S<strong>of</strong>tware. In black, the gene ontologies we interpreted as related to theremodeling <strong>of</strong> PTC, in grey the others.
Chapter III : ResultsA process which seems to be particularly important for the remodeling <strong>of</strong> the classicalPTC is the uPA system. This system consists mainly <strong>of</strong> the serine protease uPA (alsocalled PLAU), its cell membrane-associated receptor uPAR (also called PLAUR) and itsphysiological inhibitors PAI-1 and PAI-2. uPA and uPAR were present in the signaturewhich separated the classical variant from the other variants <strong>of</strong> PTC, being upregulated inthe first one, while PAI-1 and PAI-2 were not present in the signature. uPA is producedand secreted as a single-chain polypeptide, a zymogen known as pro-uPA, that lacksplasminogen-activating activity. Upon binding to uPAR, pro-uPA is cleaved into anactive two-chain uPA protein by plasmin or other proteolytic enzymes, such as cathepsinand kallikrien 45 . This active uPA enzyme then converts the zymogen plasminogen to theactive serine protease plasmin, which is involved in the degradation <strong>of</strong> the ECM either bydirect proteolytic digestion or by activation <strong>of</strong> other zymogen proteases, such as prometalloproteasesand procollagenases. This process can promote tumor migration 167,168 .Because uPA and uPAR mRNAs are both overexpressed in the classical PTC comparedto the other PTC variants, it should be interesting to investigate the corresponding protein<strong>expression</strong>s by immunohistochemistry on different variants <strong>of</strong> PTC in order to supporttheir potential role in the remodeling occurring during PTC carcinogenesis.III.2 Sporadic and post-Chernobyl PTC are distinguishable on the basis <strong>of</strong> a subset<strong>of</strong> genesIn the following paper published in British Journal <strong>of</strong> Cancer in 2007, we identified amolecular signature enabling to distinguish radiation-induced PTC from Chernobyl andsporadic PTC from France, with no radiation history, but for which H 2 O 2 , a potent DNAdamaging agent, could have played a role as cancer-initiating factor. We also showed thatthis signature was, at least in part, due to different etiological factors (irradiation vs H 2 O 2 ),and not only confounding factors such as age or ethnicity. Supplementary informationand tables are available on the British Journal <strong>of</strong> Cancer website(http://www.nature.com/bjc/journal/v97/n6/abs/6603938a.html).56
Cellular component categoriesGO identifier GO name Definition according GO P-valueGO:0005576GO:0005625GO:0005615extracellular regionsoluble fractionextracellular spaceThe space external to the outermost structure <strong>of</strong> a cell. For cells withoutexternal protective or external encapsulating structures this refers to spaceoutside <strong>of</strong> the plasma membrane. This term covers the host cellenvironment outside an intracellular parasite.That fraction <strong>of</strong> cells, prepared by disruptive biochemical methods, that issoluble in water.That part <strong>of</strong> a multicellular organism outside the cells proper, usually takento be outside the plasma membranes, and occupied by fluid.0.004830.015100.02896GO:0005886plasma membraneThe membrane surrounding a cell that separates the cell from its externalenvironment. It consists <strong>of</strong> a phospholipid bilayer and associated proteins.0.03164Table 5. Cellular component categories related to gene <strong>expression</strong> analysis in the classical variants <strong>of</strong> PTC identifiedby the DAVID S<strong>of</strong>tware. In black, the gene ontologies we interpreted as related to the remodeling <strong>of</strong> PTC, in greythe others.
British Journal <strong>of</strong> Cancer (2007), 1–8& 2007 Cancer Research UK All rights reserved 0007 – 0920/07 $30.00www.bjcancer.comFull PaperGenome-wide gene <strong>expression</strong> pr<strong>of</strong>iling suggests distinct radiationsusceptibilities in sporadic and post-Chernobyl papillary thyroidcancersV Detours* ,1,5 , L Delys 1,5 , F Libert 1 , D Weiss Solís 1 , T Bogdanova 2 , JE Dumont 1 , B Franc 3 , G Thomas 4 ,C Maenhaut 11 Institute <strong>of</strong> Interdisciplinary Research, School <strong>of</strong> Medicine, Univertisté Libre de Bruxelles (ULB), Campus Erasme, CP602, route de Lennik 808, BrusselsB-1070, Belgium; 2 Institute <strong>of</strong> Endocrinology and Metabolism, Kiev 04114, Ukraine; 3 Service d’Anatomie et de Cytologie Pathologiques, APHP (HôpitalAmbroise Paré), Faculté de Médecine Paris Ile de France Ouest, Université Versailles Saint-Quentin en Yvelines, 9 Avenue Charles de Gaulle, Boulogne92100, France;4 South West Wales Cancer Institute/Swansea Clinical School, Singleton Hospital, Sketty Lane, Swansea SA2 8QA, UKPapillary thyroid cancers (PTCs) incidence dramatically increased in the vicinity <strong>of</strong> Chernobyl. The cancer-initiating role <strong>of</strong> radiationelsewhere is debated. Therefore, we searched for a signature distinguishing radio-induced from sporadic cancers. Using microarrays,we compared the <strong>expression</strong> <strong>pr<strong>of</strong>iles</strong> <strong>of</strong> PTCs from the Chernobyl Tissue Bank (CTB, n ¼ 12) and from French patients with nohistory <strong>of</strong> exposure to ionising radiations (n ¼ 14). We also compared the transcriptional responses <strong>of</strong> human lymphocytes to thepresumed aetiological agents initiating these tumours, g-radiation and H 2 O 2 . On a global scale, the transcriptomes <strong>of</strong> CTB and Frenchtumours are indistinguishable, and the transcriptional responses to g-radiation and H 2 O 2 are similar. On a finer scale, a 118 genessignature discriminated the g-radiation and H 2 O 2 responses. This signature could be used to classify the tumours as CTB or Frenchwith an error <strong>of</strong> 15–27%. Similar results were obtained with an independent signature <strong>of</strong> 13 genes involved in homologousrecombination. Although sporadic and radio-induced PTCs represent the same disease, they are distinguishable with molecularsignatures reflecting specific responses to g-radiation and H 2 O 2 . These signatures in PTCs could reflect the susceptibility <strong>pr<strong>of</strong>iles</strong> <strong>of</strong>the patients, suggesting the feasibility <strong>of</strong> a radiation susceptibility test.British Journal <strong>of</strong> Cancer advance online publication, 21 August 2007; doi:10.1038/sj.bjc.6603938 www.bjcancer.com& 2007 Cancer Research UKKeywords: thyroid cancers; Chernobyl; radiation susceptibility; microarrayAn increased incidence <strong>of</strong> thyroid carcinomas in children was firstnoticed in Belarus and Ukraine 4 years after the 1986 Chernobylaccident (Baverstock et al, 1992; Kazakov et al, 1992). Increasedincidence has been observed since then in people exposed t<strong>of</strong>allout during childhood in these regions (United NationsScientific Committee <strong>of</strong> the Effect <strong>of</strong> Atomic Radiation, 2000;Mahoney et al, 2004). The aggressiveness and morphology <strong>of</strong> thesetumours (over 95% classified on the basis <strong>of</strong> their pathology aspapillary thyroid carcinomas (PTCs)) appear to be related to theage <strong>of</strong> the patients at the time <strong>of</strong> the accident and to the lagbetween the accident and diagnosis, that is, the latency <strong>of</strong> thecancers (Williams et al, 2004).Radiation is the only proven cause <strong>of</strong> PTC so far. Although thecause <strong>of</strong> PTC in patients not exposed to radiation remainsuncertain, a growing body <strong>of</strong> evidence suggests that H 2 O 2 couldplay a role in the absence <strong>of</strong> radiation. Indeed, it is a potent DNAdamagingagent produced in large amounts during thyroidhormone synthesis (Corvilain et al, 2000). It causes DNA damage(guanine oxidation, single- and double-strand breaks) in humanlymphocytes (Turner et al, 2003), hamster ovarian cells (Dahm-*Correspondence: Dr V Detours; E-mail: vdetours@ulb.ac.be5 These authors contributed equally to this work.Received 8 May 2007; revised 24 July 2007; accepted 24 July 2007Daphi et al, 2000; Mondello et al, 2002), and in human, dog andsheep thyroid cells in primary culture (Chico Galdo et al, 2006).Hydrogen peroxide is believed to destroy follicular thyroid cells inmyxoedematous endemic cretinism (Kohrle et al, 2005) and tocause cancers in the thyroid <strong>of</strong> Tg-a 1B AR mice (Ledent et al, 1997).Lack <strong>of</strong> protective systems, peroxiredoxin or glutathione peroxidases,in knockout mice lead to cancer (Neumann et al, 2003; Leeet al, 2006). Transfection <strong>of</strong> an H 2 O 2 -generating system transformepithelial cells (Chu et al, 1996). The spontaneous somaticmutation rate in normal mice and rat thyroid cells is substantiallyhigher than in liver and lung cells (Corvilain et al, 1994). With aturnover <strong>of</strong> 8.5 years in adults (Coclet et al, 1989), thyrocytes havetime to accumulate H 2 O 2 -induced DNA damages. Hydrogenperoxide has been found to play a role in several human cancers(Quinn et al, 2006). Thus, a number <strong>of</strong> arguments support a role <strong>of</strong>H 2 O 2 in the initiation <strong>of</strong> PTC, and in particular in patients notexposed to radiation.The vast majority <strong>of</strong> PTCs harbour either a BRAF mutation(45%; Xing, 2005) or a RET/PTC rearrangement (35% in adults;Nikiforov, 2002), which are generally mutually exclusive (Soareset al, 2003). Both gene alterations result in the constitutiveactivation <strong>of</strong> the RAS–RAF–MAPK signalling pathway (Kimuraet al, 2003; Soares et al, 2003). <strong>Gene</strong>-<strong>expression</strong> signaturesseparating BRAF from RET/PTC tumours have been reported,
2Radiation susceptibility in post-Chernobyl cancersV Detours et albut the number <strong>of</strong> genes involved varies from a few dozens(Frattini et al, 2004) to several thousands (Giordano et al, 2005).Although early reports pointed at a lower BRAF mutationfrequency in Chernobyl patients, recent evidence suggests thatthe BRAF mutation is associated with age and is more prevalentamong older Chernobyl patients and/or among patients withlonger latency tumours (Kumagai et al, 2004; Lima et al, 2004;Powell et al, 2005; Rosenbaum et al, 2005). Several research teamshave reported higher frequencies <strong>of</strong> RET/PTC rearrangements inpost-Chernobyl patients (Nikiforov et al, 1997). These higherfrequencies could result from the fact that radiation inducesdouble-strand breaks, and thus rearrangements rather than pointmutations (Dahm-Daphi et al, 2000), or possibly to a differingmolecular pr<strong>of</strong>ile in childhood vs adult papillary carcinomas(Powell et al, 2005). The induction <strong>of</strong> RET/PTC rearrangementsafter in vitro irradiation <strong>of</strong> immortalised thyroid cells (Caudillet al, 2005) supports the former explanation. Whether the twobest-characterised genetic alterations found in PTC are involved ina radiation signature remains an open question. In addition,radiation induces other unknown alterations.In this paper, we have compared the gene-<strong>expression</strong> <strong>pr<strong>of</strong>iles</strong> <strong>of</strong>PTCs from adult French patients with no history <strong>of</strong> exposure toradiation and from adult Ukrainian patients exposed to Chernobylfallout during childhood, and asked whether there is a gene<strong>expression</strong>signature distinguishing radiation-induced from sporadiccancers. Our preliminary investigation suggested the absence<strong>of</strong> a large-scale radiation signature (Detours et al, 2005). Weextend it here by using a more recent microarray technology, bycovering more genes, by studying more patients and by establishingresults with a wider range <strong>of</strong> statistical methods. We confirmthat French and Chernobyl Tissue Bank (CTB) tumours have thesame overall <strong>expression</strong> <strong>pr<strong>of</strong>iles</strong> and have indistinguishable BRAFand RET/PTC frequencies.We also compared the transcriptional responses <strong>of</strong> human cellsto the two most likely aetiological agents <strong>of</strong> CTB and Frenchtumours; g-radiation and H 2 O 2 . The similarity <strong>of</strong> CTB and Frenchtumours is mirrored by the similarity <strong>of</strong> the transcriptionalresponses to g-radiation and H 2 O 2 . However, subtle <strong>expression</strong>differences are exploitable to accurately classify these tumoursaccording to their origin. Part <strong>of</strong> these <strong>expression</strong> differencesincludes genes involved in the differential response to H 2 O 2 andradiation, and genes involved in homologous recombination whichsuggests that different—and detectable—susceptibility <strong>pr<strong>of</strong>iles</strong>lead to sporadic and radiation—induced PTC.MATERIALS AND METHODSTranscriptional and genetic dataPaired samples <strong>of</strong> tumoral and adjacent non-tumoral thyroidtissues were obtained from the CTB (www.chernobyltissuebank.-com) and from patients undergoing surgery for thyroid disease atthe Ambroise Pare Hospital (Boulogne, France). French tissueswere immediately frozen in liquid nitrogen and stored at 801Cuntil use. Diagnoses were made by the Department <strong>of</strong> Pathology atthe Ambroise Pare Hospital or by the International PathologyPanel <strong>of</strong> the CTB. The protocol received approval from the EthicsCommittees <strong>of</strong> the institutions. The detail <strong>of</strong> BRAF-RET/PTCstatus determination, RNA processing and microarray datapreprocessing is available in Supplementary information file S3.Microarray data are available from the <strong>Gene</strong> Expression Omnibus(www.ncbi.nlm.nih.gov/geo), accession number GSE3950.Comparison <strong>of</strong> microarray platformsJarzab et al (2005) data were downloaded from www.genomika.pl/thyroidcancer/PTCCancerRes.html. We used the original MAS 5.0normalised <strong>expression</strong> levels, took the log 2 <strong>of</strong> <strong>expression</strong> ratios andaveraged over patients. The probes <strong>of</strong> the two platforms could bematched on the basis <strong>of</strong> their Entrez IDs for 4203 genes.Unsupervised classificationHierarchical clustering was computed with the R language functionhclust with Ward linkage. Multidimensional scaling was computedwith the R function isoMDS. Both methods were fed Pearsoncorrelation distances as input.Supervised classificationSupport vector machine classification was run with linear kerneland cost ¼ 1 using the rfe 0.2 and e1071 1.5.9 packages for R. Thegeneralised partial least-square (GPLS) implementation frompackage gpls 1.1.0 (Ding and Gentleman, 2004) for R was runwith default parameters. Prediction analysis <strong>of</strong> microarray(Tibshirani et al, 2002) was run with threshold values in {1.0,1.1, 1.2, y, 3.0} using pamr 1.25 for R. The random forestclassification used default parameters from R package random-Forest 4.5.12 (Zhang et al, 2003). <strong>Gene</strong>ralised partial least-squareand random forest (RF) were combined with an external genesselection procedure focusing on the n genes with the highestabsolute t-statistics, with n in {1, 2 1 ,2 2 , y, 2 13 }. We adopted theinner/outer cross-validation scheme described in details inRuschhaupt et al (2004) and implemented in the packageMCRestimate 1.3.0 to prevent parameter and gene selection biases(Ambroise and McLachlan, 2002). Note that a simpler split-samplevalidation, in which samples are not recycled as in the currentcross-validation protocol, would be suboptimal here because <strong>of</strong> thelimited availability <strong>of</strong> CTB samples (Simon et al, 2003). A 13-foldcross-validation protocol with each round including parameterand gene selection, and classification was run. At each one <strong>of</strong> the13 rounds, the best parameters (including signature size) wereestimated by running a nested (inner) 12-fold cross-validation foreach combination <strong>of</strong> parameters. Table 2 presents averages over 10repetitions <strong>of</strong> the entire inner/outer cross-validation, each basedon a different random 13-fold partitions <strong>of</strong> the data. The randomerror was computed by averaging the error <strong>of</strong> five runs <strong>of</strong> thecomplete classification procedure on data with CTB and Frenchlabels randomly assigned to samples. The same protocol was usedfor the classification on the basis <strong>of</strong> the 118 genes g-radiation vsH 2 O 2 signature, except that the number <strong>of</strong> genes, n, was chosen in{1, 5, 10, y, 118} and that the tested prediction analysis <strong>of</strong>microarray (PAM) thresholds were in {0.1, 0.2, y, 3.0}.Classifications on the basis <strong>of</strong> DNA repair signatures were runwithout gene selection, and therefore without inner crossvalidation.The PAM threshold was set to 0.5. All P-values werederived by running 1000 times the complete cross-validation withCTB and French labels assigned randomly to samples and countinghow many runs produced classification error below the errorobtained on the actual data.Derivation <strong>of</strong> the c-radiation vs H 2 O 2 signatureWe downloaded the Supplementary data set S2 <strong>of</strong> Amundson et al(2005) from the Oncogene web site (www.nature.com/onc/index.html). <strong>Gene</strong>s with <strong>expression</strong> values differing by 1.5-foldbetween the 2.5 Gy g-radiation- and H 2 O 2 (200 mM)-treated TK6cells were selected. To remove immune system-related genes, wedownloaded the gcrma-processed version <strong>of</strong> the GNF human geneatlas (Su et al, 2004; symatlas.gnf.org), which contains <strong>expression</strong><strong>pr<strong>of</strong>iles</strong> <strong>of</strong> normal tissues in most organs. We performed anunpaired two class Significance Analysis <strong>of</strong> Microarrays (SAM;Tusher et al, 2001) with class no. 1 including immune systemrelatedtissues and white blood cells and class no. 2 including allother tissues. We selected the 20% top-ranking genes, which wereBritish Journal <strong>of</strong> Cancer (2007), 1 – 8& 2007 Cancer Research UK
all significant at qo0.05, and removed them from the g-radiationand H 2 O 2 signature.RESULTSExpression <strong>pr<strong>of</strong>iles</strong> and gene alteration status <strong>of</strong> PTCsfrom France and from the Chernobyl Tissue BankExpression <strong>pr<strong>of</strong>iles</strong> were determined for the tumours <strong>of</strong> 14 patientsfrom France with no documented history <strong>of</strong> exposure to radiation,and 12 tumours from the Chernobyl Tissue Bank (see onlineMaterials and Methods). CTB tumours are papillary cancerscollected in young people who were exposed to the Chernobylaccident ((Thomas et al, 2000), see patient information, Table 1).There are 9 tumours <strong>of</strong> classical subtype, 4 <strong>of</strong> follicular subtypeand 1 <strong>of</strong> trabecular subtype among the 14 French PTC samples.There are 8 classical, 3 follicular and 1 solid subtypes among the 12CTB PTC samples. Three French and four CTB mRNA samples(PTC6, PTC7, PTC11 and S405, S420, S422, S423) were reused fromour earlier study (Detours et al, 2005).The mRNA <strong>expression</strong> <strong>pr<strong>of</strong>iles</strong> <strong>of</strong> all tumours were determinedwith 12 000 EST (8000 genes) cDNA microarrays using patientmatchednontumoural adjacent tissues as controls. To assess thequality <strong>of</strong> the data, we compared our <strong>expression</strong> ratios averaged oversamples with those <strong>of</strong> Jarzab et al (2005), who used the Affymetrix splatform. Pearson’s correlation measured on the B4000 genesavailable and expressed in both platforms was 0.72 (Figure 1).Tumours were screened for the presence <strong>of</strong> a RET/PTCrearrangement and for BRAF V600E mutation (Table 1). A RET/PTC rearrangement was found in 42% (5/12) <strong>of</strong> the CTB tumoursand in 21% (3/14) <strong>of</strong> the French tumours. The difference betweenthe two groups is not significant according to Fisher’s exact test.The BRAF mutation is found in comparable proportions in French(36%, 5/14) and CTB tumours (41%, 5/12). None <strong>of</strong> thesealterations was detected in 30% (8/26) <strong>of</strong> the tumours.Table 1Patient information and gene alterationsSampleID Origin SexAge in1986Age atoperationBRAFRET/PTCPTC11 FR F 22 37PTC14 FR M 17 32PTC18 FR F NA 59 +PTC19 FR M 54 68 +PTC20 FR F 54 68 +PTC21 FR F 39 54 +PTC22 FR F 44 60PTC23 FR M 17 33PTC25 FR F 49 60PTC26 FR F 36 47 +PTC6 FR M 24 37PTC7 FR F 13 29 +PTC8 FR M 22 36 +PTC9 FR F 24 38 +S404 CTB F 1 16S405 CTB F 1 16 +S409 CTB F 11 28 +S414 CTB F 16 33 +S415 CTB M 12 28 +S418 CTB M 10 27 +S420 CTB F 12 28S422 CTB M 15 31 +S423 CTB F 5 22 +S425 CTB M 3 19 +V519 CTB F 2 18 +V608 CTB F 15 32 +F ¼ female; FR ¼ France; CTB ¼ Chernobyl Tissue Bank; M ¼ male; NA ¼ notavailable; PTC ¼ papillary thyroid cancer.Radiation susceptibility in post-Chernobyl cancersV Detours et alChernobyl Tissue Bank and French PTCs have similaroverall <strong>expression</strong> <strong>pr<strong>of</strong>iles</strong>We first searched for global <strong>expression</strong> differences between CTBand French PTCs, that is, extensive differences detectable when allthe genes present on our arrays are considered. HierarchicalJarzabDistanceDimension no. 26420–2–40.80.40.00.50.0–0.5–1.0–1.5–4PTC8PTC11PTC20PTC6S420S425S422S405V608S414–1.5–2–1.0PTC9S404V519S415S423V608PTC14PTC19PTC25PTC23 S409PTC22PTC18 PTC26PTC70IRIBHMFigure 1 IRIBHM vs Jarzab et al. (2005) microarray data. Pearsoncorrelation between patient-averaged log 2 tumour/normal ratios <strong>of</strong> thetwo studies is 0.72.S418PTC23PTC14PTC19PTC25PTC22PTC26PTC7S420S425PTC9S415S423PTC21–0.5 0.0 0.5Dimension no. 1S405S418PTC18S409PTC21S414S422S404PTC6PTC20 PTC11V519PTC81.0 1.5Figure 2 Global <strong>expression</strong> <strong>pr<strong>of</strong>iles</strong>. Top panel: hierarchical clustering onthe basis <strong>of</strong> all genes. Bottom panel: multidimensional scaling on the basis <strong>of</strong>all genes. Distances in the two dimensions space were on average distortedby 11% compared to the actual 8000 dimensions gene space distances.Chernobyl Tissue Bank tumours are in bold font, French tumours in italics.23& 2007 Cancer Research UKBritish Journal <strong>of</strong> Cancer (2007), 1 – 8
4Radiation susceptibility in post-Chernobyl cancersV Detours et alclustering based on all genes did not reveal a clear separationbetween these two classes <strong>of</strong> PTCs (Figure 2, upper panel).Multidimensional scaling collapses the high-dimensional genesspace into two dimensions while preserving the distance relationshipsbetween all pairs <strong>of</strong> samples (Figure 2, lower panel). Figure 2confirms that French and CTB tumours have similar <strong>expression</strong><strong>pr<strong>of</strong>iles</strong> when compared on a global scale although CTB tumoursform a more compact group.Four supervised classification algorithms find multigenessignatures separating CTB from French PTCsThe absence <strong>of</strong> separation between CTB and French PTCs on thebasis <strong>of</strong> all genes or at the level <strong>of</strong> individual genes, does notexclude that these tumours are distinguishable on the basis <strong>of</strong> asubset <strong>of</strong> genes. We investigated this possibility with a supervisedclassification approach (details in Materials and Methods). Tostrengthen the reliability <strong>of</strong> our conclusions, all the results werereproduced with four linear classification procedures: linear kernelsupport vector machines (LKSVM), GPLS, PAMs and RF. Each oneincluded or was combined with a gene selection procedure, that is,a procedure to uncover multigenes signatures including as fewgenes as possible. All four approaches were tested using a rigorousinner/outer cross-validation procedure (Materials and Methods). Itguaranteed that classification testing was performed on independentsamples not used for classifier training. The cross-validationresults are presented in Table 2A.The best performer was GPLS. It misclassified 17% <strong>of</strong> CTBtumours as French PTC, 7% <strong>of</strong> French PTCs as CTB, resulting in anoverall error rate <strong>of</strong> 12%. Running the same classification on datain which the ‘CTB’ and ‘French’ labels were randomly assigned tothe 26 tumour samples led to high error rates <strong>of</strong> 45% (n ¼ 5,s.d. ¼ 12%, see Materials and Methods), as expected for randomclassification <strong>of</strong> slightly unbalanced classes (12 CTB and 14 Frenchsamples). Thus, the low error rates were unlikely to result fromartefacts, including data overfitting. Figure 3 shows the 256 mostclassifying genes found by GPLS/t-statistics trained on all 26samples (corresponding genes listed in Supplementary Table S1).The optimal signature size varied among the different crossvalidationruns from one gene to several thousands <strong>of</strong> genes, with amedian <strong>of</strong> 256 genes. Such limited stability is widespread,including in large studies (Ein-Dor et al, 2005; Michiels et al,2005). The three other classification procedures, LKSVM/RFE, RF/t-test and PAM produced a global error <strong>of</strong> 15, 23 and 27%,respectively. Thus, undirected selections <strong>of</strong> classifying genes leadto separation CTB and French tumours.Note that if the classification results were confined to a subtype,the accuracy would not be as low as 15%, it would be greater than35%—the classical subtype is the largest, representing 65% <strong>of</strong> ourtumours.Hydrogen peroxide and c-radiation elicit similartranscriptional responses in lymphocytesBecause hydrogen peroxide, H 2 O 2 , is produced at high levelsduring thyroid hormone synthesis (Corvilain et al, 2000) and is awell-known DNA-damaging agent, we investigated the possibilitythat in the absence <strong>of</strong> an obvious external risk factor, for exampleradiation, French cancers must have occurred as a result <strong>of</strong> H 2 O 2exposure.Amundson et al (2005) measured with microarrays thetranscriptional responses <strong>of</strong> a B-lymphocyte cell line, TK6, to 13stress agents. These included 10 DNA-damaging agents: H 2 O 2 ,radiation (neutron and g-rays at 2.5 and 8 Gy), adriamycin,arsenite, campothecin, CdCl 2 , cisplatin, methyl methanesulphonateand UVB (280 320 nm). We downloaded the <strong>expression</strong> datapublished with the paper and produced the hierarchical clusteringshown in Figure 4 (see online Materials and Methods). Theresponses to 200 mM H 2 O 2 and to 2.5 Gy g-radiation clusteredtogether, that is, among 12 stress agents, including 10 DNAdamagingagents, g-radiation at 2.5 Gy elicited the transcriptionalresponse that was the closest to that <strong>of</strong> H 2 O 2 . We concluded thatthese similar transcriptional responses reflect similar damages inthe cells.–3 1Table 2Error rates for supervised classificationFrench error CTB error Global error(a) Classification based on all genesGPLS 17 7 12PAM 25 29 27RF 33 14 23LKSVM 25 7 15(b) Classification based on H 2 O 2 vs g-radiation signatureGPLS 8 21 15PAM 25 29 27RF 42 7 23LKSVM 25 7 15French error CTB error Global error P(c) Classification based on homologous radiation signatureGPLS 17 21 19 0.0038PAM 25 21 23 o0.001RF 42 21 31 0.063LKSVM 8 21 15 0.0038CTB ¼ Chernobyl Tissue Bank; GPLS ¼ generalised partial least-square;LKSVM ¼ linear kernel support vector machines; PAM ¼ prediction analysis <strong>of</strong>microarray; RF ¼ random forest. Classification and validation procedures aredescribed in Materials and Methods.PTC14PTC25PTC23PTC21PTC22PTC7PTC19PTC18PTC11PTC20PTC6PTC9PTC26PTC8S414V608S418S409S423V519S420S415S422S425S405S404Figure 3 Top 256 most classifying genes according to GPLS/t-statistics.Chernobyl Tissue Bank samples are in red and French samples in black inthe top colour bar. Data are ordered with two-way hierarchical clusteringfor the sake <strong>of</strong> display clarity.British Journal <strong>of</strong> Cancer (2007), 1 – 8& 2007 Cancer Research UK
Distance0.80.40.0CisplatinNeutronCamptothecin2.5 Gy γ-irradiationH 2 O 2UVBMMS8 Gy γ-irradiationAdriamycinHeat shockOsmotic shockTPA Exp 1TPA Exp 2Arsenite Exp 1Arsenite Exp 2CdCl 2 Exp 1CdCl 2 Exp 2Figure 4 Hierarchical clustering <strong>of</strong> transcriptional responses <strong>of</strong> the B-lymphocyte TK6 cell line to various stress agents. Expression data are fromAmundson et al (2005). The responses to 200 mM <strong>of</strong>H 2 O 2 and 2.5 Gyg-radiation cluster together. Abbreviations: MMS, methyl methanesulphonate;TPA, 12-O-tetradecanoylphorbol 13-acetate; UVB, ultraviolet(280 320 nm). The suffixes ‘Exp1’ and ‘Exp2’ stand for replicatedexperiments.Chernobyl Tissue Bank and French tumours are accuratelyclassified on the basis <strong>of</strong> genes regulated differently inc-radiation and H 2 O 2 responsesThe transcriptional responses to g-radiation and H 2 O 2 are broadlysimilar; however, some genes are expressed differently between thetwo in vitro assays. We reasoned that these <strong>expression</strong> differencesmay mirror subtle underlying g-radiation and H 2 O 2 susceptibilitydifferences between CTB and French tumours that could be usedfor classification.We found 293 genes in the 1451 published by Amundson et al(2005) with a fold change greater than 1.5 between the g-radiation(2.5 Gy) and the H 2 O 2 responses (200 mM). These responses weremeasured in B lymphocytes, whereas our goal was to classifythyroid tumours. Thus, we removed immune system-specific genesfrom the set <strong>of</strong> 293 genes (see online Materials and Methods). Thisfiltering left 162 genes. Among them, 118 were spotted on ourmicroarrays. They are listed in Supplementary Table S2 and will bereferred to thereafter as the g-radiation vs H 2 O 2 signature. Notethat it was derived independently <strong>of</strong> our PTC data.Next, we applied the same four classification algorithms asabove except that only the independently selected 118 genes wereused. Error rates (Table 2B) were comparable to those obtained inTable 2A, where the classifying genes were selected from a list <strong>of</strong>8000. Again, all four algorithms classified the tumours with anerror rate p27%, GPLS/t-test and LKSVM/RFE being the mostaccurate with an error rate <strong>of</strong> 15%. This result shows a relationbetween the g-radiation vs H 2 O 2 signature and CTB and sporadiccarcinomas distinction, which could reflect the underlyingaetiology <strong>of</strong> CTB and French tumours.Chernobyl Tissue Bank and French tumours are accuratelyclassified on the basis <strong>of</strong> 13 genes involved in homologousrecombinationTo focus better on which elements <strong>of</strong> the DNA-damage responsemay differ between CTB and French tumours, we investigated ifgenes involved in the different DNA repair mechanisms led toaccurate classification. We collected from the Human DNA Repair<strong>Gene</strong>s database (Wood et al, 2001, 2005), all the genes known to beinvolved in base-excision repair, mismatch-excision repair,nucleotide-excision repair, homologous recombination and nonhomologousend joining. The signature from each one <strong>of</strong> these fiverepair mechanisms was then used to classify the CTB and FrenchRadiation susceptibility in post-Chernobyl cancersV Detours et alTable 3Symboltumours. These signatures contain few genes and were compiledfrom a source curated by DNA repair experts. Therefore, weskipped the gene selection step, which in turn alleviates the needfor time-consuming internal cross-validation. The resultingcomputational gain made it tractable to run an additionalstatistical control: all five classification tasks were rerun 1000times with the CTB and French labels randomly assigned to thetumours to estimate P-values, that is, the odds that theclassification error was as low as the one observed with the actualdata. Besides this, the classification proceeded exactly as above.The classification error rates were high for base-excision repair,mismatch-excision repair and nonhomologous end joining,regardless <strong>of</strong> the algorithm (not shown). The nucleotide-excisionrepair signature produced an error rate <strong>of</strong> 27% with RF, but B50%with GPLS, PAM and LKSVM. In contrast, the homologousrecombination signature (Table 3) led to a classification below 31%for all four procedures, below 20% for two and equal to 15% forLKSVM (Table 2C).The P-value for RF, 0.064, was slightly above the 0.05significance standard. All the other P-values were highly significantand remained below 0.02 after adjusting for the fact that fiveclassification tasks were being examined (using Bonferonnicorrection, i.e., multiplying the P-values by 5). This suggests thathomologous recombination, which repairs double-strand breaks,operates differently in CTB and French tumours or in theassociated normal tissues. None <strong>of</strong> the homologous recombinationsignature genes are part <strong>of</strong> the 118 genes <strong>of</strong> the g-radiation vs H 2 O 2signature. Thus, the homologous recombination and g-radiation vsH 2 O 2 signatures are nonoverlapping. They are thus two differentsignatures supporting a link between radiation and the CTB/French PTC <strong>expression</strong> differences.DISCUSSIONHomologous recombination gene signatureNameXRCC2X-ray repair complementing defective repair in Chinesehamster cells 2SHFM1 Split hand/foot malformation (ectrodactyly) type 1RAD51CRAD51 homologue C (Saccharomyces cerevisiae)MUS81MUS81 endonucleaseRAD51L1RAD51-like 1 (S. cerevisiae)RAD51RAD51 homologue (RecA homologue, Escherichia coli)(S. cerevisiae)RAD50RAD50 homologue (S. cerevisiae)RAD54BRAD54B homologueRAD54LRAD54-like (S. cerevisiae)NBS1Nijmegen breakage syndrome 1 (nibrin)RAD52RAD52 homologue (S. cerevisiae)XRCC3X-ray repair complementing defective repair in Chinesehamster cells 3BRCA1Breast cancer 1, early onsetOnly homologous recombination genes represented on our microarrays are listed(see main text).We compared French and CTB tumours at the level <strong>of</strong> their global<strong>expression</strong> <strong>pr<strong>of</strong>iles</strong>, that is, <strong>of</strong> their overall phenotype. Hierarchicalclustering and multidimensional scaling failed to uncover a largescaledifference between them. Note that, would such differenceexist, our preliminary study (Detours et al, 2005) would haverevealed it. Thus, the conclusion <strong>of</strong> pathologists that sporadic andradiation-induced PTCs are the same type <strong>of</strong> lesions is supportedby <strong>expression</strong> data.The similarity <strong>of</strong> <strong>expression</strong> <strong>pr<strong>of</strong>iles</strong> on a global scale, asobserved with hierarchical clustering performed on all genes, does5& 2007 Cancer Research UKBritish Journal <strong>of</strong> Cancer (2007), 1 – 8
6Radiation susceptibility in post-Chernobyl cancersV Detours et alnot preclude that small groups <strong>of</strong> genes differ between these<strong>pr<strong>of</strong>iles</strong>. Supervised classification is the tool <strong>of</strong> choice to evaluatewhether a group <strong>of</strong> genes can be exploited to discriminate differentclasses <strong>of</strong> tumours (Allison et al, 2006). Four linear classificationalgorithms assigned the tumours to the French or CTB groups withan error ranging from 12 to 27%, and p15% for two algorithms.These figures are typical <strong>of</strong> properly designed microarray studies(Ntzani and Ioannidis, 2003), and compare very favourably withhistopathological diagnosis accuracy in the field <strong>of</strong> thyroidtumours (Baloch et al, 2001; Hegedus, 2004; Clary et al, 2005).The stability <strong>of</strong> the gene lists uncovered through supervisedclassification is problematic, even in studies using hundreds <strong>of</strong>samples (Ein-Dor et al, 2005; Michiels et al, 2005). Clearly, muchlarger studies will be needed to list exactly and exhaustively thediscriminating genes, and validate them over a larger group.Nevertheless, our results strongly suggest that such genes exist:accurate classification <strong>of</strong> CTB and French tumours is possible onthe basis <strong>of</strong> their <strong>expression</strong> <strong>pr<strong>of</strong>iles</strong>.Initial reports <strong>of</strong> a low BRAF mutation frequencies in post-Chernobyl tumours (Nikiforova et al, 2004) and <strong>of</strong> a large impact<strong>of</strong> BRAF on gene <strong>expression</strong> (Giordano et al, 2005) raised thepossibility <strong>of</strong> a radiation damage signature based on themutational status <strong>of</strong> the tumours. The frequency <strong>of</strong> BRAF V600Emutation was similar, 38%, in our French and CTB tumours. Ouranalysis does not exclude the possibility <strong>of</strong> other damagesignatures yet to be identified.Radiation is a proven causing factor for PTC and a number <strong>of</strong>arguments support the view that H 2 O 2 -induced damage alsocontributes to initiate these tumours (see Introduction). Takingadvantage <strong>of</strong> published data on the transcriptional responses <strong>of</strong>human lymphocytes to 13 stress agents (Amundson et al, 2005), weinvestigated how similar the responses to H 2 O 2 and g-radiationare. We found that among 10 genotoxic agents, H 2 O 2 at 200 mMelicits the response most similar to that <strong>of</strong> radiation at 2.5 Gy. Thisstrengthens the argument for H 2 O 2 as a PTC-causing agent, as thissimilarity most probably mirrors a similarity <strong>of</strong> the damageinflicted by H 2 O 2 and radiation. This similarity is in line with thefinding that French and CTB tumours have similar global <strong>pr<strong>of</strong>iles</strong>.Interestingly, Xiong et al (2005) demonstrated that the number <strong>of</strong>chromatid breaks per cell following g-irradiation was significantlyhigher in the lymphocytes <strong>of</strong> 57 PTC patients with no documentedexposure to radiation than in the lymphocytes <strong>of</strong> healthy controls.This difference could be related to impaired homologousrecombination as the 18067T allele variant <strong>of</strong> XRCC3 was morefrequent in 134 thyroid cancer patients than in 166 healthy patientsin another study (Sturgis et al, 2005).Transcriptional responses to H 2 O 2 and g-radiation are similarrelatively to other responses to genotoxic agents. However, 118genes regulated differently in response to H 2 O 2 and radiation wereuncovered and could be used to classify CTB and French tumourswith an error as low as 15%. This is straightforward evidence thatat least some <strong>of</strong> the genes associated with these tumours are alsoassociated with the response to their presumed respectiveaetiological agent.Next, we investigated whether French and CTB tumours couldbe classified on the basis <strong>of</strong> five signatures covering the genesinvolved in the five major DNA repair mechanisms: base-excisionrepair, mismatch-excision repair, nucleotide-excision repair,homologous recombination and nonhomologous end joining(Wood et al, 2001, 2005). The homologous recombinationsignature, which shares no genes with the H 2 O 2 vs g-radiationsignature, led to classification errors ranging from 15 to 31%. None<strong>of</strong> the other four signatures led to accurate classification. Thespecificity for the homologous recombination effect, and the goodclassification <strong>of</strong> CTB and French tumours using the 118 genesregulated differently in response to H 2 O 2 and radiation, makeunlikely the confounding effect <strong>of</strong> age- or ethnicity-related factors.The fact that homologous recombination is involved in doublestrandbreak repair fits the notion that radiation causes moredouble-strand breaks than H 2 O 2 . Nevertheless, although potentialconfounders are controlled for by the use <strong>of</strong> patient-matchedadjacent tissues, they are not formally ruled out in our study. Thiswill become possible in the future as tumours from youngerUkrainian patients born after 1987 become available.Thus, several independent gene-<strong>expression</strong> signatures separateour CTB and sporadic PTCs. These subtle <strong>expression</strong> differencesbetween CTB and French tumours must be interpreted in light <strong>of</strong> thefact that the tumours investigated were removed 415 years after theChernobyl accident. Thus, any discriminating gene-<strong>expression</strong>signature had to be sustained over this time interval. DNA damageresulting from radiation, however, is typically mostly repairedwithin a time scale <strong>of</strong> hours. Consequently, either the reportedsignatures are ‘damage signatures’, that is, they are late results, fromradiation-induced DNA damage (e.g. non- or incorrectly repaireddamage), and/or they are ‘susceptibility signatures’, that is, theymirror radiation susceptibility factors pre-existing to the accident.The fact that one <strong>of</strong> the signature relies on the relative response tothe two postulated causing agents (g-rays and H 2 O 2 ), and that theother relies on double-strand break repair genes, suggests that thesesignatures are related to the tumour-initiating mechanisms. Thisand the longlasting presence <strong>of</strong> these signatures support thesusceptibility signature model. The recent finding that differentTP53 alleles are associated with radiation exposure in adult PTCfrom Russian-Ukrainian patients (Rogounovitch et al, 2006) alsosupports this view. The susceptibility model, and the corollary thatradiation susceptibility varies among individuals, may partly explainwhy only a minority <strong>of</strong> the population most exposed to radiation inUkraine and Belarus developed PTC.Thus, we interpret our findings as evidence for different anddetectable cancer susceptibility factors underlying CTB and Frenchtumours, which leads to several testable predictions. Expressionratios <strong>of</strong> tumours with respect to patient-matched adjacent tissueswere measured. Hence, we could uncover susceptibility signaturesonly to the extent that they manifest themselves differently in thecancers and their adjacent tissues. We anticipate that the directcomparison <strong>of</strong> <strong>expression</strong> levels instead <strong>of</strong> <strong>expression</strong> ratios couldlead to a stronger signature, possibly involving more genes. Inaddition, a radiation susceptibility signature could be present inhealthy cells <strong>of</strong> any type in post-Chernobyl cancer patients. This,then, suggests the possibility <strong>of</strong> developing an <strong>expression</strong>-based invitro test for radiation susceptibility. Finally, large-scale studiescould uncover the genetic or epigenetic variations underlying thephenotypic differences reported in this paper. These concepts andapproaches may apply to other types <strong>of</strong> cancers.ACKNOWLEDGEMENTSWe thank Chantal Degraef for excellent technical work. This workwas supported by the Ministère de la Politique Scientifique (PAI),Action Concertée de la Communauté Franc¸aise, Fond National dela Recherche Scientifique Médicale; Télévie, Fédération Belge Contrele Cancer, Fortis, and UCB-Région Wallone. VD was supported byEuropean Union’s Marie Curie Grant MEIF-CT-2003-501459.Supplementary Information accompanies the paper on BritishJournal <strong>of</strong> Cancer website (http://www.nature.com/bjc).REFERENCESAllison DB, Cui X, Page GP, Sabripour M (2006) Microarray data analysis:from disarray to consolidation and consensus. Nat Rev <strong>Gene</strong>t 7: 55 – 65Ambroise C, McLachlan GJ (2002) Selection bias in gene extraction on thebasis <strong>of</strong> microarray gene-<strong>expression</strong> data. Proc Natl Acad Sci USA 99:6562 – 6566British Journal <strong>of</strong> Cancer (2007), 1 – 8& 2007 Cancer Research UK
Amundson SA, Do KT, Vinikoor L, Koch-Paiz CA, Bittner ML, Trent JM,Meltzer P, Fornace Jr AJ (2005) Stress-specific signatures: <strong>expression</strong>pr<strong>of</strong>iling <strong>of</strong> p53 wild-type and -null human cells. Oncogene 24:4572 – 4579Baloch ZW, Hendreen S, Gupta PK, LiVolsi VA, Mandel SJ, Weber R,Fraker D (2001) Interinstitutional review <strong>of</strong> thyroid fine-needleaspirations: impact on clinical management <strong>of</strong> thyroid nodules. DiagnCytopathol 25: 231 – 234Baverstock K, Egl<strong>of</strong>f B, Pinchera A, Ruchti C, Williams D (1992) Thyroidcancer after Chernobyl. Nature 359: 21 – 22Caudill CM, Zhu Z, Ciampi R, Stringer JR, Nikiforov YE (2005) Dosedependentgeneration <strong>of</strong> RET/PTC in human thyroid cells after in vitroexposure to gamma-radiation: a model <strong>of</strong> carcinogenic chromosomalrearrangement induced by ionizing radiation. J Clin Endocrinol Metab90: 2364 – 2369Chico Galdo V, Massart C, Jin L, Vanvooren V, Caillet-Fauquet P, Andry G,Lothaire P, Dequanter D, Friedman M, Van Sande J (2006) Acrylamide,an in vivo thyroid carcinogenic agent, induces DNA damage in ratthyroid cell lines and primary cultures. Mol Cell Endocrinol257 – 258: 6–14Chu R, Lin Y, Reddy KC, Pan J, Rao MS, Reddy JK, Yeldandi AV (1996)Transformation <strong>of</strong> epithelial cells stably transfected with H 2 O 2 -generatingperoxisomal urate oxidase. Cancer Res 56: 4846 – 4852Clary KM, Condel JL, Liu Y, Johnson DR, Grzybicki DM, Raab SS (2005)Interobserver variability in the fine needle aspiration biopsy diagnosis <strong>of</strong>follicular lesions <strong>of</strong> the thyroid gland. Acta Cytol 49: 378 – 382Coclet J, Foureau F, Ketelbant P, Galand P, Dumont JE (1989) Cellpopulation kinetics in dog and human adult thyroid. Clin Endocrinol(Oxf) 31: 655 – 665Corvilain B, Collyn L, Van Sande J, Dumont JE (2000) Stimulation by iodide<strong>of</strong> H(2)O(2) generation in thyroid slices from several species. Am JPhysiol Endocrinol Metab 278: E692 – E699Corvilain B, Laurent E, Lecomte M, Van Sande J, Dumont JE (1994) Role <strong>of</strong>the cyclic adenosine 3 0 ,5 0 -monophosphate and the phosphatidylinositol-Ca 2+ cascades in mediating the effects <strong>of</strong> thyrotropin and iodide onhormone synthesis and secretion in human thyroid slices. J ClinEndocrinol Metab 79: 152 – 159Dahm-Daphi J, Sass C, Alberti W (2000) Comparison <strong>of</strong> biological effects <strong>of</strong>DNA damage induced by ionizing radiation and hydrogen peroxide inCHO cells. Int J Radiat Biol 76: 67 – 75Detours V, Wattel S, Venet D, Hutsebaut N, Bogdanova T, Tronko MD,Dumont JE, Franc B, Thomas G, Maenhaut C (2005) Absence <strong>of</strong> a specificradiation signature in post-Chernobyl thyroid cancers. Br J Cancer 92:1545 – 1552Ding B, Gentleman RC (2004) Classification using generalized partial leastsquares. J comput Graphical Stat 14: 280 – 298Ein-Dor L, Kela I, Getz G, Givol D, Domany E (2005) Outcome signaturegenes in breast cancer: is there a unique set? Bioinformatics 21: 171 – 178Frattini M, Ferrario C, Bressan P, Balestra D, De Cecco L, Mondellini P,Bongarzone I, Collini P, Gariboldi M, Pilotti S, Pierotti MA, Greco A(2004) Alternative mutations <strong>of</strong> BRAF, RET and NTRK1 are associatedwith similar but distinct gene <strong>expression</strong> patterns in papillary thyroidcancer. Oncogene 23: 7436 – 7440Giordano TJ, Kuick R, Thomas DG, Misek <strong>DE</strong>, Vinco M, Sanders D, Zhu Z,Ciampi R, Roh M, Shedden K, Gauger P, Doherty G, Thompson NW,Hanash S, Koenig RJ, Nikiforov YE (2005) Molecular classification <strong>of</strong>papillary thyroid carcinoma: distinct BRAF, RAS, and RET/PTCmutation-specific gene <strong>expression</strong> <strong>pr<strong>of</strong>iles</strong> discovered by DNA microarrayanalysis. Oncogene 24: 6646 – 6656Hegedus L (2004) Clinical practice. The thyroid nodule. N Engl J Med 351:1764 – 1771Jarzab B, Wiench M, Fujarewicz K, Simek K, Jarzab M, Oczko-Wojciechowska M, Wloch J, Czarniecka A, Chmielik E, Lange D,Pawlaczek A, Szpak S, Gubala E, Swierniak A (2005) <strong>Gene</strong> <strong>expression</strong>pr<strong>of</strong>ile <strong>of</strong> papillary thyroid cancer: sources <strong>of</strong> variability and diagnosticimplications. Cancer Res 65: 1587 – 1597Kazakov VS, Demidchik EP, Astakhova LN (1992) Thyroid cancer afterChernobyl. Nature 359: 21Kimura ET, Nikiforova MN, Zhu Z, Knauf JA, Nikiforov YE, Fagin JA(2003) High prevalence <strong>of</strong> BRAF mutations in thyroid cancer: geneticevidence for constitutive activation <strong>of</strong> the RET/PTC – RAS – BRAFsignaling pathway in papillary thyroid carcinoma. Cancer Res 63:1454 – 1457Kohrle J, Jakob F, Contempre B, Dumont JE (2005) Selenium, the thyroid,and the endocrine system. Endocr Rev 26: 944 – 984Radiation susceptibility in post-Chernobyl cancersV Detours et alKumagai A, Namba H, Saenko VA, Ashizawa K, Ohtsuru A, Ito M, IshikawaN, Sugino K, Ito K, Jeremiah S, Thomas GA, Bogdanova TI, Tronko MD,Nagayasu T, Shibata Y, Yamashita S (2004) Low frequency <strong>of</strong>BRAFT1796A mutations in childhood thyroid carcinomas. J ClinEndocrinol Metab 89: 4280 – 4284Ledent C, Denef JF, Cottecchia S, Lefkowitz R, Dumont J, Vassart G,Parmentier M (1997) Costimulation <strong>of</strong> adenylyl cyclase and phospholipaseC by a mutant alpha 1B-adrenergic receptor transgene promotesmalignant transformation <strong>of</strong> thyroid follicular cells. Endocrinology 138:369 – 378Lee DH, Esworthy RS, Chu C, Pfeifer GP, Chu FF (2006) Mutationaccumulation in the intestine and colon <strong>of</strong> mice deficient in twointracellular glutathione peroxidases. Cancer Res 66: 9845 – 9851Lima J, Trovisco V, Soares P, Maximo V, Magalhaes J, Salvatore G, SantoroM, Bogdanova T, Tronko M, Abrosimov A, Jeremiah S, Thomas G,Williams D, Sobrinho-Simoes M (2004) BRAF mutations are not a majorevent in post-Chernobyl childhood thyroid carcinomas. J Clin EndocrinolMetab 89: 4267 – 4271Mahoney MC, Lawvere S, Falkner KL, Averkin YI, Ostapenko VA, MichalekAM, Moysich KB, McCarthy PL (2004) Thyroid cancer incidencetrends in Belarus: examining the impact <strong>of</strong> Chernobyl. Int J Epidemiol33: 1025 – 1033Michiels S, Koscielny S, Hill C (2005) Prediction <strong>of</strong> cancer outcomewith microarrays: a multiple random validation strategy. Lancet 365:488 – 492Mondello C, Guasconi V, Giulotto E, Nuzzo F (2002) Gamma-ray andhydrogen peroxide induction <strong>of</strong> gene amplification in hamster cellsdeficient in DNA double strand break repair. DNA Repair (Amst) 1:483 – 493Neumann CA, Krause DS, Carman CV, Das S, Dubey DP, Abraham JL,Bronson RT, Fujiwara Y, Orkin SH, Van Etten RA (2003) Essential rolefor the peroxiredoxin Prdx1 in erythrocyte antioxidant defence andtumour suppression. Nature 424: 561 – 565Nikiforov YE (2002) RET/PTC rearrangement in thyroid tumors. EndocrPathol 13: 3–16Nikiforov YE, Rowland JM, Bove KE, Monforte-Munoz H, Fagin JA (1997)Distinct pattern <strong>of</strong> ret oncogene rearrangements in morphologicalvariants <strong>of</strong> radiation-induced and sporadic thyroid papillary carcinomasin children. Cancer Res 57: 1690 – 1694Nikiforova MN, Ciampi R, Salvatore G, Santoro M, Gandhi M, Knauf JA,Thomas GA, Jeremiah S, Bogdanova TI, Tronko MD, Fagin JA, NikiforovYE (2004) Low prevalence <strong>of</strong> BRAF mutations in radiation-inducedthyroid tumors in contrast to sporadic papillary carcinomas. Cancer Lett209: 1–6Ntzani EE, Ioannidis JP (2003) Predictive ability <strong>of</strong> DNA microarrays forcancer outcomes and correlates: an empirical assessment. Lancet 362:1439 – 1444Powell N, Jeremiah S, Morishita M, Dudley E, Bethel J, Bogdanova T,Tronko M, Thomas G (2005) Frequency <strong>of</strong> BRAF T1796A mutation inpapillary thyroid carcinoma relates to age <strong>of</strong> patient at diagnosis and notto radiation exposure. J Pathol 205: 558 – 564Quinn MT, Ammons MC, Deleo FR (2006) The expanding role <strong>of</strong> NADPHoxidases in health and disease: no longer just agents <strong>of</strong> death anddestruction. Clin Sci (Lond) 111: 1–20Rogounovitch TI, Saenko VA, Ashizawa K, Sedliarou IA, Namba H,Abrosimov AY, Lushnikov EF, Roumiantsev PO, Konova MV, PetoukhovaNS, Tchebotareva IV, Ivanov VK, Chekin SY, Bogdanova TI,Tronko MD, Tsyb AF, Thomas GA, Yamashita S (2006) TP53 codon 72polymorphism in radiation-associated human papillary thyroid cancer.Oncol Rep 15: 949 – 956Rosenbaum E, Hosler G, Zahurak M, Cohen Y, Sidransky D, Westra WH(2005) Mutational activation <strong>of</strong> BRAF is not a major event insporadic childhood papillary thyroid carcinoma. Mod Pathol 18:898 – 902Ruschhaupt M, Huber W, Poustka A, Mansmann U (2004) A compendiumto ensure computational reproducibility in high-dimensional classificationtasks. Stat Appl <strong>Gene</strong>t Mol Biol 3, article 37 www.bepress.com/sagmb/vol3/iss1/art37/Simon R, Radmacher MD, Dobbin K, McShane LM (2003) Pitfalls in the use<strong>of</strong> DNA microarray data for diagnostic and prognostic classification.J Natl Cancer Inst 95: 14 – 18Soares P, Trovisco V, Rocha AS, Lima J, Castro P, Preto A, Maximo V,Botelho T, Seruca R, Sobrinho-Simoes M (2003) BRAF mutations andRET/PTC rearrangements are alternative events in the etiopathogenesis<strong>of</strong> PTC. Oncogene 22: 4578 – 45807& 2007 Cancer Research UKBritish Journal <strong>of</strong> Cancer (2007), 1 – 8
8Radiation susceptibility in post-Chernobyl cancersV Detours et alSturgis EM, Zhao C, Zheng R, Wei Q (2005) Radiation response genotypeand risk <strong>of</strong> differentiated thyroid cancer: a case – control analysis.Laryngoscope 115: 938 – 945Su AI, Wiltshire T, Batalov S, Lapp H, Ching KA, Block D, Zhang J, SodenR, Hayakawa M, Kreiman G, Cooke MP, Walker JR, Hogenesch JB (2004)A gene atlas <strong>of</strong> the mouse and human protein-encoding transcriptomes.Proc Natl Acad Sci USA 101: 6062 – 6067Thomas GA, Williams ED, Becker DV, Bogdanova TI, Demidchik EP,Lushnikov E, Nagataki S, Ostapenko V, Pinchera A, Souchkevitch G,Tronko MD, Tsyb AF, Tuttle M, Yamashita S (2000) Chernobyl tumorbank. Thyroid 10: 1126 – 1127Tibshirani R, Hastie T, Narasimhan B, Chu G (2002) Diagnosis <strong>of</strong> multiplecancer types by shrunken centroids <strong>of</strong> gene <strong>expression</strong>. Proc Natl AcadSci USA 99: 6567 – 6572Turner DR, Dreimanis M, Holt D, Firgaira FA, Morley AA (2003) Mitoticrecombination is an important mutational event following oxidativedamage. Mutat Res 522: 21 – 26Tusher VG, Tibshirani R, Chu G (2001) Significance analysis <strong>of</strong> microarraysapplied to the ionizing radiation response. Proc Natl Acad Sci USA 98:5116 – 5121United Nations Scientific Committee <strong>of</strong> the Effect Of Atomic Radiation(2000) Sources, Effect and Risk <strong>of</strong> Ionizing Radiations. NewYork:UnitedNationsWilliams ED, Abrosimov A, Bogdanova T, Demidchik EP, Ito M,LiVolsi V, Lushnikov E, Rosai J, Sidorov Y, Tronko MD, Tsyb AF,Vowler SL, Thomas GA (2004) Thyroid carcinoma after Chernobyllatent period, morphology and aggressiveness. Br J Cancer 90:2219 – 2224Wood RD, Mitchell M, Lindahl T (2005) Human DNA repair genes. MutatRes 577: 275 – 283Wood RD, Mitchell M, Sgouros J, Lindahl T (2001) Human DNA repairgenes. Science 291: 1284 – 1289Xing M (2005) BRAF mutation in thyroid cancer. Endocr Relat Cancer 12:245 – 262Xiong P, Zheng R, Wang LE, Bondy ML, Shen H, Borer MM, Wei Q, SturgisEM (2005) A pilot case – control study <strong>of</strong> gamma-radiation sensitivityand risk <strong>of</strong> papillary thyroid cancer. Thyroid 15: 94 – 99Zhang H, Yu CY, Singer B (2003) Cell and tumor classification using gene<strong>expression</strong> data: construction <strong>of</strong> forests. Proc Natl Acad Sci USA 100:4168 – 4172British Journal <strong>of</strong> Cancer (2007), 1 – 8& 2007 Cancer Research UK
Chapter III : resultsIV.<strong>Gene</strong> <strong>expression</strong> and the biological phenotype <strong>of</strong> papillary thyroid cancerA main part <strong>of</strong> this thesis was to correlate the gene <strong>expression</strong> pr<strong>of</strong>ile <strong>of</strong> PTC with thebiology <strong>of</strong> these tumors. To do this, we used the Agilent microarray slides containing12000 cDNAs, covering 8000 genes, and hybridized 26 PTC, 14 coming from France(sporadic PTC) and 12 from the Chernobyl area (radio-induced PTC). As reported in theprevious section, we confirmed that sporadic and radio-induced PTC actuallycorresponded to the same disease with a similar global <strong>expression</strong> pr<strong>of</strong>ile, although subtlechanges have been identified. They can consequently be studied together to assess themolecular phenotype <strong>of</strong> PTC. As described in the following paper published in Oncogenein 2007, we attempted to study in details the gene <strong>expression</strong> pr<strong>of</strong>ile <strong>of</strong> PTCs withstatistical tools in order to have a better understanding <strong>of</strong> the molecular mechanisms thatregulate papillary thyroid carcinogenesis. We observed: (1) an increased <strong>expression</strong> <strong>of</strong>genes related to the immune response reflecting the lymphocyte infiltration in the tumorcompared to the normal tissue; (2) an activation <strong>of</strong> the JNK and EGF signaling pathwaysby overpexression <strong>of</strong> their components; (3) a downregulation <strong>of</strong> the immediate earlygenes; (4) a deregulation <strong>of</strong> many proteases, inhibitors <strong>of</strong> proteases and ECM proteins,which is consistent with the important remodeling <strong>of</strong> PTC; (5) an over<strong>expression</strong> <strong>of</strong> manygenes in favor <strong>of</strong> a collective migration mode <strong>of</strong> these tumor cells.Supplementary information, tables and figures are available on the Oncogene website(http://www.nature.com/onc/journal/vaop/ncurrent/abs/1210588a.html).65
Oncogene (2007), 1–10& 2007 Nature Publishing Group All rights reserved 0950-9232/07 $30.00www.nature.com/oncORIGINAL ARTICLE<strong>Gene</strong> <strong>expression</strong> and the biological phenotype <strong>of</strong> papillarythyroid carcinomasL Delys 1,5 , V Detours 1,5 , B Franc 2 , G Thomas 3 , T Bogdanova 4 , M Tronko 4 , F Libert 1 ,JE Dumont 1 , and C Maenhaut 11Institute <strong>of</strong> Interdisciplinary Research, School <strong>of</strong> Medicine, Université Libre de Bruxelles, Campus Erasme, Brussels, Belgium;2Service d’Anatomie et de Cytologie Pathologiques, Faculté de Médecine Paris Ile de France Ouest, Hôpital Ambroise Paré (APHP),Université Versailles Saint-Quentin en Yvelines, Boulogne, France; 3 South West Wales Cancer Institute/Swansea Clinical School,Singleton Hospital, Swansea, UK and 4 Institute <strong>of</strong> Endocrinology and Metabolism, Kiev, UkraineThe purpose <strong>of</strong> this paper is to correlate the molecularphenotype <strong>of</strong> papillary thyroid carcinoma (PTC) to theirbiological pathology. We hybridized 26 PTC on microarraysand showed that nearly 44% <strong>of</strong> the transcriptomewas regulated in these tumors. We then combined our dataset with two published PTC microarray studies to producea platform- and study-independent list <strong>of</strong> PTC-associatedgenes. We further confirmed the mRNA regulation <strong>of</strong> 15genes from this list by quantitative reverse transcription–PCR. Analysis <strong>of</strong> this list with statistical tools led toseveral conclusions: (1) there is a change in cell populationwith an increased <strong>expression</strong> <strong>of</strong> genes involved in theimmune response, reflecting lymphocyte infiltration in thetumor compared to the normal tissue. (2) The c-junN-terminal kinase pathway is activated by over<strong>expression</strong><strong>of</strong> its components. (3) The activation <strong>of</strong> ERKK1/2 bygenetic alterations is supplemented by activation <strong>of</strong> theepidermal growth factor but not <strong>of</strong> the insulin-like growthfactor signaling pathway. (4) There is a downregulation <strong>of</strong>immediate early genes. (5) We observed an over<strong>expression</strong><strong>of</strong> many proteases in accordance with tumor remodeling,and suggested a probable role <strong>of</strong> S100 proteins andannexin A2 in this process. (6) Numerous overexpressedgenes favor the hypothesis <strong>of</strong> a collective migration mode<strong>of</strong> tumor cells.Oncogene advance online publcation, 9 July 2007;doi:10.1038/sj.onc.1210588Keywords: cancer; thyroid; microarrays; molecularphenotypeIntroductionPapillary thyroid carcinoma (PTC) is the most frequentendocrine malignancy in human and represents up toCorrespondence: Dr L Delys and Dr C Maenhaut, Institute <strong>of</strong>Interdisciplinary Research, School <strong>of</strong> Medicine, Free University <strong>of</strong>Brussels, Campus Erasme, Route de Lennik 808, Brussels B-1070,Belgium.E-mails: laurent.delys@ulb.ac.be and cmaenhau@ulb.ac.be5These authors contributed equally to this work.Received 29 November 2006; revised 3 April 2007; accepted 11 May 200780% <strong>of</strong> all malignant thyroid tumors. PTC is usuallybiologically indolent and has an overall 5- to 10-yearsurvival rate <strong>of</strong> 80–95%. Lymph node metastasis iscommonly found in patients with PTC contrasting witha low rate <strong>of</strong> distant metastases (Gimm, 2001). Theirdiagnosis is based on the presence <strong>of</strong> a number <strong>of</strong>different features, not all <strong>of</strong> which need to be present inthe same lesion, such as papillary architecture, thepresence <strong>of</strong> psammoma bodies and characteristicnuclear features. PTC also <strong>of</strong>ten displays lymphocyticinfiltration and fibrosis. Different pathological subtypes<strong>of</strong> PTC have been described, including the classical,follicular, solid and tall-cell variants (Gimm, 2001;Livolsi et al., 2004).After the Chernobyl power plant explosion, anunusual number <strong>of</strong> childhood thyroid cancers wereobserved in Belarus and Ukraine, with an incidence 10-to 100-fold higher than in the rest <strong>of</strong> Europe. Thesecancers have been described mostly as PTC and we haveshown previously that they belong to the same entity assporadic PTC (Detours et al., 2005).Several lines <strong>of</strong> evidence point to the causative role<strong>of</strong> chromosomal rearrangements and point mutationsin the pathogenesis <strong>of</strong> PTC leading to constitutivelyactivated effectors along the RAS/RAF/MEK/ERKsignaling pathway. Two membrane tyrosine kinasereceptors, RET and less frequently NTRK1, are commonlyfound rearranged in PTC (Alberti et al., 2003).AKAP9-BRAF rearrangement has also been reportedin some post-Chernobyl PTC <strong>of</strong> short latency (Ciampiand Nikiforov, 2005). These rearranged proteins leadto the constitutive kinase activity <strong>of</strong> the oncogene.Besides chromosomal rearrangements, BRAF pointmutations have been described in PTC and in otherhuman cancers (Ciampi and Nikiforov, 2005). Thesepoint mutations produce a protein with constitutiveserine–threonine kinase activity. Activating mutations<strong>of</strong> RAS have been also found in the follicular variant <strong>of</strong>PTC leading to constitutive activation <strong>of</strong> the ERKsignaling pathway.Current microarray studies on tumors are mostly usedto define diagnostic and prognostic signatures. PTCgene <strong>expression</strong> analyses have for example providedtumor type signatures and views on tumor cell
2metabolism (Baris et al., 2005; Giordano et al., 2005).However, most <strong>of</strong> these studies rarely analyse in detailsthe biological function <strong>of</strong> the regulated genes and theirpotential implication in tumor initiation and progression.On the other hand, most <strong>of</strong> the proteomic studiesare focalized on only one or two particular proteins,without taking into account the other proteins involvedin the same cascade or the same process. In this paper,we performed microarray experiments on sporadic andpost-Chernobyl PTC and combined our data with twoother independent microarray data sets (Huang et al.,2001; Jarzab et al., 2005) to obtain for the first time forPTC a cross-validated regulated gene list. As thetranscription level <strong>of</strong> an mRNA usually reflects thelevel <strong>of</strong> the corresponding protein, we used this gene listto attempt to give a general view <strong>of</strong> the regulation <strong>of</strong>different signaling pathways and processes and correlatedthese results to the physiopathology <strong>of</strong> the PTC.Results<strong>Gene</strong> <strong>expression</strong> and biological phenotype <strong>of</strong> PTCL Delys et alThe <strong>expression</strong> <strong>of</strong> thousands <strong>of</strong> genes is altered in PTCwith a high level <strong>of</strong> statistical evidenceRNA samples were collected from PTC tumors andnon-tumor tissue counterparts from 26 patients. Tumorand patient-matched non-tumor RNA samples werecohybridized on Agilent Human 1a cDNA microarrays(see Materials and methods). The 12 000 clones spottedon the Agilent slides were then interrogated forconsistent up- or downregulation across patients. Thelevel <strong>of</strong> statistical evidence for regulation was estimatedwith the Significance Analysis <strong>of</strong> Microarray (SAM)procedure. This procedure avoids normality assumptions,and handles efficiently the fact that thousandsstatistical tests are conducted at once by estimatingstatistical significance in term <strong>of</strong> q-values. SAM reportsthat 44.5% <strong>of</strong> the genes shows statistical evidence(qo0.05) for differential <strong>expression</strong>. Running SAM onthe <strong>expression</strong> <strong>pr<strong>of</strong>iles</strong> <strong>of</strong> 16 PTC from Jarzab et al.(2005) gives 40.3% with qo0.05. Most <strong>of</strong> the significantlyregulated genes are regulated at levels well belowtwo fold in both studies. Only 6.7% <strong>of</strong> the genes arebelow the 0.05 confidence threshold in the data set <strong>of</strong>Huang et al. (2001). A reanalysis <strong>of</strong> this later study(Pavlidis et al., 2003) suggests that its small size (eightpatients), hence low statistical power, could in partexplain the discrepancy with our and Jarzab et al. (2005)studies. Thus, we concluded that a very large fraction <strong>of</strong>the transcriptome is significantly regulated in PTC withrespect to healthy tissue counterparts, which would be inkeeping with the greatly altered morphology <strong>of</strong> thetumor relative to normal thyroid.A reliable list <strong>of</strong> genes regulated in PTCTo produce a reliable list <strong>of</strong> regulated genes in PTC, wecombined our data set with two independent PTCmicroarray data sets, from Jarzab et al. (2005) andHuang et al. (2001). They contain 16 and 8 pairs <strong>of</strong> PTCtumors and patient-matched normal tissues, respectively.Thus, our global analysis was based on 50 tumorsderived from patients <strong>of</strong> different ages presentingvarious histological variants and genetic alterations.Moreover, the three data sets were produced independentlyon different microarray platforms (cDNA andoligonucleotide chips) with different protocols. Wecompiled all these data to create a reference list <strong>of</strong>genes modulated in PTC. We chose to include a gene inour gene list only when it was modulated in two <strong>of</strong> thedata sets at least, with a minimum ratio <strong>of</strong> 1.5 and amaximum q-value <strong>of</strong> 0.05. This q-value enabled us toselect only genes regulated in most <strong>of</strong> the PTC,regardless <strong>of</strong> the histological variant or the age <strong>of</strong> thepatients. The resulting list is composed <strong>of</strong> 451 up- and233 downregulated genes representing the generalmolecular phenotype <strong>of</strong> PTC (Supplementary Table 1).The probability <strong>of</strong> obtaining this large extent <strong>of</strong> overlapbetween the three data sets was computed using aresampling approach (see Supplementary Information):it is very low, Po10 5 . This high significance followsobviously from the excellent agreement between the datasets: correlation between our data and Jarzab’s is 0.77,0.65 with Huang and 0.70 between Huang and Jarzabdata sets. Note that this gene list comes from threepublicly available data sets and is therefore open toindependent recalculation.Confirmation <strong>of</strong> the modulation <strong>of</strong> selected genes by realtime reverse transcription–PCR using two non-modulatedgenes confirmed in PTCTo select adequate normalization genes for PTC, we firstinvestigated different candidates and identified NEDD8(neuronal precursor cell expressed, developmentallydownregulated 8) and TTC1 (tetratricopeptide repeatdomain 1) as a stable combination <strong>of</strong> non-regulated genesto normalize real-time reverse transcription (RT)–PCRmeasurements in PTC (see Materials and methods).Using NEDD8 and TTC1 for normalization, 11upregulated genes (ANXA1, CDH3, CLDN1, DUSP5,GPX1, HMGA2, NELL2, NRCAM, SLIT1, THBS2,TNC) and four downregulated genes (BCL2, EGR1,EGR2, FLRT2) identified by microarray were confirmedby real-time RT–PCR (Figure 2). This also included twogenes for which the ratio tumor/normal was smallerthan two for upregulated genes (GPX1, THBS2) in ourmicroarray data. In addition, two downregulated genesfrom the Jarzab’s data set (MAFB and DGKI) but notpresent in our or in the Huang’s data set were alsoconfirmed (not shown). A Pearson correlation <strong>of</strong> 89%was obtained between microarrays and real-timeRT–PCR results.In addition, representativity <strong>of</strong> our list is supported byseveral agreements:(1) Hybridization <strong>of</strong> the same pair <strong>of</strong> samples on twoAgilent microarray slides gave a correlation <strong>of</strong> 95%(not shown).(2) Previously reported data on RNA regulation <strong>of</strong>many genes have been confirmed. For example, <strong>of</strong>the 26 genes regulated in PTC and tabulated fromthe literature in a review article, 20 are in our list(Kondo et al., 2006). Confirmation at protein levelOncogene
<strong>Gene</strong> <strong>expression</strong> and biological phenotype <strong>of</strong> PTCL Delys et al3Figure 1<strong>Gene</strong> function distribution (in %) altered in PTC according to the <strong>Gene</strong> Ontology. PTC, papillary thyroid carcinoma.Table 1 GO categories and statistical significance following theanalysis <strong>of</strong> the PTC-regulated gene list with DAVID s<strong>of</strong>twareGO identifier GO name P-valueGO:0006955 Immune response 0.0000066GO:0005125 Cytokine activity 0.000012GO:0008009 Chemokine activity 0.0002GO:0006590 Thyroid hormone generation 0.014GO:0007173 EGFR signaling pathway 0.046GO:0007257 Activation <strong>of</strong> JNK activity 0.019GO:0017017 MAP kinase phosphatase activity 0.042GO:0031012 Extracellular matrix 4.9E-11GO:0008233 Peptidase activity 0.0049GO:0030414 Protease inhibitor activity 0.021GO:0043256 Laminin complex 0.047GO:0005581 Collagen 0.00076GO:0016337 Cell–cell adhesion 0.0034GO:0008305 Integrin complex 0.063Abbreviations: DAVID, database for annotation, visualization andintegrated discovery; EGFR, epidermal growth factor receptor; GO,<strong>Gene</strong> Ontology; JNK, c-jun N-terminal kinase; MAP kinase, mitogenactivatedprotein kinase; PTC, papillary thyroid carcinoma.<strong>of</strong> numerous genes present in our gene list are als<strong>of</strong>ound in the literature (for example SPP1, TGFA,ERBB3, HRG, PLAU, MMP1, TIMP1, S100A4,ICAM1, y). Moreover, the modulation <strong>of</strong> threeproteins (CDH2, CDH3 and ANXA1) was confirmedby our group (data not shown).Classification <strong>of</strong> our gene list in <strong>Gene</strong> Ontology categoriesusing the DAVID s<strong>of</strong>twareTo assess the most representative biological activitiespresent in our gene list, we used the statistical methodsfrom the DAVID (database for annotation, visualizationand integrated discovery) s<strong>of</strong>tware (Dennis et al.,2003; Hosack et al., 2003), which finds the mostrepresented functions according to the <strong>Gene</strong> Ontology(GO) annotations. As shown in Figure 1, the mainglobal biological processes (GO level 2) altered in PTCswere cell communication, organismal physiological process,localization, cell adhesion and diverse responses tostimulus and stress.We then analysed in details the GO categoriesdetected by DAVID with a P-value o0.05 to relate someaspects <strong>of</strong> the PTC phenotype with its gene <strong>expression</strong>pr<strong>of</strong>ile (Table 1).DiscussionIn this study, we performed cDNA microarrays on 26PTC and showed that more than 40% <strong>of</strong> the transcriptomewas regulated in PTC. Several factors maycontribute to this, including alteration <strong>of</strong> thyrocytemetabolism and intracellular signaling, changes inrelative cell populations, for example, lymphocyteinfiltration (Jarzab et al., 2005) and adaptation <strong>of</strong>adjacent tissues to the neighboring tumors. Then, wecombined our data set with two other data sets togenerate a cross-validated list <strong>of</strong> regulated genes in PTC.We used this gene list to describe the common molecularphenotype <strong>of</strong> PTC and to relate it to the biology <strong>of</strong> thetumor.Change in relative cell populations has a major impact onthe difference in gene <strong>expression</strong> between normal andtumor tissuesOur global analyses revealed many genes involved in theresponse to diverse stimulus and to stress in PTC. Thisresulted in many highly significant GO categories relatedto the immune response, including the immune responsecategory (Table 1). Most <strong>of</strong> the genes present inthese categories were overexpressed (see SupplementaryTable 2). This suggested heavy infiltrations <strong>of</strong> theOncogene
4<strong>Gene</strong> <strong>expression</strong> and biological phenotype <strong>of</strong> PTCL Delys et alFigure 2 Comparison <strong>of</strong> differential gene <strong>expression</strong> data obtained by microarrays and real-time RT–PCR. The upper and lowerlimits <strong>of</strong> each box stand for the upper and the lower quartiles, respectively; bold lines represent medians; whiskers represent extrememeasurements. Regulation <strong>of</strong> CDH3, CLDN1, HMGA2, NRCAM, SLIT1 were confirmed on 20 tumor/non-tumor pairs <strong>of</strong> PTCwhereas 11 pairs <strong>of</strong> PTC were used to confirm ANXA1, BCL2, DUSP5, EGR1, EGR2, FLRT2, GPX1, NELL2, THBS2 and TNC.PTC, papillary thyroid carcinoma; RT–PCR, reverse transcription–PCR.tumors by immune cells. To support this hypothesis, weran the <strong>Gene</strong> Set Enrichment Analysis (Subramanianet al., 2005) to verify that genes present in the ‘immuneresponse’ GO category were significantly overrepresentedin lymphocytes-infiltrated versus non or lowinfiltrated tumors. The result was statistically significantwith Po1/2000 (data not shown). This adds weight tothe conclusions <strong>of</strong> Jarzab et al. (2005).PTC is <strong>of</strong>ten associated with striking chronic inflammatoryreaction (Livolsi et al., 2004). It is consistentwith the experimental observation that <strong>expression</strong> <strong>of</strong> theRET/PTC-rearranged human gene in mice thyroid leadsto a tumor with a strong immune response andinflammation (Powell et al., 2003). This suggests thatthe tumor cells themselves induce the inflammationrather than the reverse, like in hepatitis generatedhepatocarcinomas. The induction in the tumor <strong>of</strong> manyinflammatory cytokines could account for the inflammation.Indeed, RET/PTC induces such cytokines inPCCl3 cells and in human thyrocytes (Borrello et al.,2005). Our gene list revealed that different cytokines andchemokines were significantly altered in PTC (Table 1)with a trend in upregulation (Supplementary Table 3).The role <strong>of</strong> this inflammation on tumor progressionremains to be determined. One would expect anantitumoral role, but inflammation may favor tumorprogression (de Visser et al., 2006) and macrophagesmay be partners for tumor cell migration, invasion andmetastasis. This raises the question <strong>of</strong> whether antiinflammatorytreatment would be beneficial for thesetumors.Other changes may reflect gene regulation in thecancer cells themselves. However, the possibility thatsome upregulation <strong>of</strong> gene <strong>expression</strong> may at least inpart reflect the increased proportion <strong>of</strong> inflammatory oreven endothelial cells (data not shown) should berecognized. However, demonstration <strong>of</strong> similar regulationsbetween long-term epidermal growth factor (EGF)stimulation in pure human thyrocytes in culture andPTC supports the first interpretation (He´ brant et al., inrevision).Change in gene <strong>expression</strong> confirms previously identifiedtumor markers and is in accordance with thededifferentiation status <strong>of</strong> theses tumorsNot surprisingly, a great number <strong>of</strong> known protein tumormarkers were upregulated such as KRT19, CITED1,LGALS3, FN1 (Prasad et al., 2005), SPP1, TIMP1(Hawthorn et al., 2004), ECM1, MUC1, S100A4 (Zouet al., 2005). Furthermore, a decrease in CRABP1 <strong>expression</strong>level has been proposed as a biomarker in PTC(Hawthorn et al., 2004).As expected, genes involved in thyroid hormonesynthesis were statistically downregulated (Table 1), inagreement with the conclusions <strong>of</strong> Huang et al. (2001).Such results are consistent with the dedifferentiation <strong>of</strong>carcinoma cells.<strong>Gene</strong>s involved in the growth factors signaling cascadesare regulatedActivation <strong>of</strong> the EGF-, insulin-like growth factor(IGF)-, fibroblast growth factor (FGF)- and hepatocytegrowth factor-mitogen-activated protein kinase (HGF-MAPK) signaling pathways are known to induceproliferation and could, consequently, participate intumorigenesis. Regulation <strong>of</strong> genes involved in thesepathways was therefore analysed separately.While constitutive activation <strong>of</strong> the RAS/RAF/MEK/ERK signaling pathway is considered as the primaryevent in papillary thyroid carcinogenesis, no geneencoding for proteins involved in this pathway wasOncogene
<strong>Gene</strong> <strong>expression</strong> and biological phenotype <strong>of</strong> PTCL Delys et al5Figure 3 Simplified view <strong>of</strong> the EGF and IGF, and <strong>of</strong> the three main MAP kinase signaling pathways in PTC. See main text forexplanations. Colors signification: dark red, over<strong>expression</strong> in tumors in our data; bright red, over<strong>expression</strong> in tumors from otherstudies; yellow, no regulation; green, under<strong>expression</strong> in tumors. EGF, epidermal growth factor; IGF, insulin-like growth factor; MAPkinase, mitogen-activated protein kinase; PTC, papillary thyroid carcinoma.dysregulated (Figure 3). However, rearranged RET oractivating mutation <strong>of</strong> BRAF is sufficient to explainconstitutive activation <strong>of</strong> this signaling pathway withoutover<strong>expression</strong> <strong>of</strong> its components.We also investigated different growth factor cascadesthat lead to the activation <strong>of</strong> this signaling pathway.EGF signaling has a central role in the pathogenesis andprogression <strong>of</strong> different cancers (Normanno et al.,2006). However, the importance <strong>of</strong> this signaling pathwayin PTC is controversial (Hoelting et al., 1994;Mitsiades et al., 2006). Our gene list shows a statisticallysignificant alteration <strong>of</strong> the EGF signaling pathway(Table 1) and many genes involved in this cascade areoverexpressed in our data (Figure 3): the EGF-likepeptides (TGFA, AREG, EREG and NELL2), theERBB3 receptor and GRB7, a specific target <strong>of</strong> ERBB3and ERBB4 (Fiddes et al., 1998). Moreover, heregulins,other EGF-related growth factors and ERBB4 wereclearly upregulated in other PTC studies (Haugen et al.,1996; Fluge et al., 2000). On the other hand, SNX1 (up)is involved in EGF receptor (EGFR) degradation(Kurten et al., 1996). However, EPS8 (up) is shown toinhibit internalization <strong>of</strong> EGFR, and consequently, itsdegradation (Lanzetti et al., 2000). Thus, at least ninegenes coding for proteins involved in EGF signalingcascade activation were upregulated for only onenegative regulator, suggesting a positive balance infavor <strong>of</strong> activation <strong>of</strong> this pathway in PTC. As all ErbBligands and receptors induce activation <strong>of</strong> the RAS/RAF/MEK/MAPK pathway (Normanno et al., 2006),this MAPK pathway is probably also activated in thisway as well as by the constitutive activation <strong>of</strong>rearranged RET/PTC or mutated BRAF.The IGF, FGF and HGF signaling pathways werealso investigated in our gene list but no statistical resultswere found by DAVID. However, several inhibitors <strong>of</strong>the IGF signaling pathway were found upregulated andthe IGF-II ligand was downregulated in our data,suggesting that this pathway is inhibited in PTC byregulation <strong>of</strong> its components (Figure 3).Oncogene
6<strong>Gene</strong> <strong>expression</strong> and biological phenotype <strong>of</strong> PTCL Delys et alDifferential <strong>expression</strong> <strong>of</strong> genes involved in the c-junN-terminal kinase (JNK) and p38 pathway was theninvestigated (Figure 3) and the activation <strong>of</strong> the JNKactivity was found statistically significant by DAVID(Table 1). Four genes (MAP4K1, MAP4K4, MAP3K5and MAP3K6) encoding specific activators <strong>of</strong> the JNKbut not <strong>of</strong> the ERK or p38 kinase pathways wereupregulated in our gene list. This suggests that, besideERK, the JNK pathway would be more activated inPTC compared to the adjacent tissue, as alreadysuggested by an immunohistochemistry study (Shinet al., 2004). The upregulation <strong>of</strong> several cytokines inPTC (see above) could explain the activation <strong>of</strong> thiscascade. On the other hand, three inhibitors <strong>of</strong> theMAPK pathways were highly overexpressed in PTC:DUSP4, DUSP5 and DUSP6 (Table 1). Interestingly,theses DUSP seem to show marked preference for ERK(Figure 3): DUSP5 and DUSP6 are highly specific forERK, whereas DUSP4 inactivates ERK, p38 and JNKindifferently (Farooq and Zhou, 2004; Mandl et al.,2005). Thus, DUSP proteins could mitigate to someextent the activation <strong>of</strong> the ERK pathway, which couldexplain the positive but slow growth rate <strong>of</strong> the PTC.Immediate early genes are downregulatedUpregulation <strong>of</strong> immediate early genes is an early step inthe initiation <strong>of</strong> the cell cycle and some <strong>of</strong> them, whenoverexpressed in different models, induce cell proliferation(Milde-Langosch, 2005). ‘Immediate early genes’ isnot a GO category; thus, we could not ascertain itsstatus with DAVID. However, our results showed ageneral uncompensated repression <strong>of</strong> immediate earlygenes (0 up, 9 down; see Supplementary Table 4). Thisfinding seems counterintuitive. Considering the lowproliferation rate and proportion <strong>of</strong> cells in the cellcycle (for example, KI67 positive) in the tumor and thetransient over<strong>expression</strong> <strong>of</strong> these genes in the G 1 phase,an absence <strong>of</strong> upregulation would have been expected.However, the observed downregulation is more difficultto explain. A similar observation has been made inautonomous adenomas (Wattel et al., 2005).Over<strong>expression</strong> <strong>of</strong> many proteases and adhesion matrixproteins is consistent with the important remodelingin PTCAside from proliferation, other processes have to bealtered to support tumor progression. Proteolyticdegradation <strong>of</strong> the extracellular matrix (ECM) is anessential process for its remodeling, for migration andfor metastasis (Skrzydlewska et al., 2005). In PCCL3cells, the induction <strong>of</strong> genes coding for proteins withinvasion properties is part <strong>of</strong> the gene response commonto BRAF constitutive activation and RET/PTC3rearrangement, and can thus be related to the constitutiveactivation <strong>of</strong> the RAS-MAPK pathway (Melilloet al., 2005). In contrast with follicular carcinoma, PTC,whatever the variant, has a strong stromal component.This connective tissue component present in papillaeand fibrotic bands is part <strong>of</strong> the tumor and accompaniesthe tumor progression. This specific morphology clearlyindicates a remodeling <strong>of</strong> the ECM, reflected in our databy a highly significant alteration <strong>of</strong> the ECM, a strikingover<strong>expression</strong> <strong>of</strong> proteases and protease inhibitors, andan alteration <strong>of</strong> adhesion matrix proteins, includingfibronectin, collagens, laminins and elastins (Table 1 andFigure 4). The predominance <strong>of</strong> collagen over<strong>expression</strong>(7 up, 1 down) is consistent with fibrosis <strong>of</strong> the tumors.Different groups <strong>of</strong> proteases leading to destruction <strong>of</strong>the ECM were upregulated in our data, includingaspartyl proteases cathepsin D (CTSD), cysteine proteases(for example, cathepsin B (CTSB)), serineproteases (for example, PLAU) and metalloproteinases(MMP1, MMP7 and MMP11) (Figure 4). A majorprocess involved in carcinogenesis is the activation <strong>of</strong>several proteases by CTSD (Skrzydlewska et al., 2005).CTSD can be autoactivated in an acidic environment,which is usually the case in the extracellular environment<strong>of</strong> tumors. It is able to degrade many ECMproteins, to inactivate cysteine protease inhibitors and toactivate CTSB (Skrzydlewska et al., 2005) (Figure 4).Once activated, CTSB degrades the protein components<strong>of</strong> basement membranes and the interstitial connectivematrix, including laminins, fibronectin and differenttypes <strong>of</strong> collagens. It also activates metalloproteasesand inactivates some MMP inhibitors (for example,TIMP1), facilitating progression <strong>of</strong> the tumor in theECM (Skrzydlewska et al., 2005). Finally, CTSB is anactivator <strong>of</strong> uPA (also called PLAU), whose <strong>expression</strong>was also induced in PTC, and which promotesinvasiveness in follicular carcinoma cell lines (Sidet al., 2006). This protein is one <strong>of</strong> the two plasminogenactivators that convert the zymogen plasminogen to theactive serine protease plasmin. Plasmin is known to playa major role in the activation <strong>of</strong> several MMPs andinduces ECM remodeling, facilitating cancer invasionand metastasis (Dano et al., 2005; Semov et al., 2005).Taken together, these results show that the mRNA <strong>of</strong>the main proteins (CTSD, CTSB and uPA) responsiblefor ECM remodeling, which can act directlyby degrading ECM or indirectly by activating otherproteases, are upregulated. This suggests that ECMremodeling occurs in PTC at least in part by theseprocesses. The role <strong>of</strong> plasminogen activation seems tobe particularly relevant in PTC because no inhibitors <strong>of</strong>this group <strong>of</strong> proteases are present in our gene list butalso because it seems to be activated by another process:the activation <strong>of</strong> the second plasminogen activator (tPA)by upregulation <strong>of</strong> some S100 proteins and <strong>of</strong> annexinA2. Indeed, S100A4/ANXA2, S100A10/ANXA2 andprobably S100A13/ANXA2 complexes increase thetPA-mediated plasmin production from plasminogen(Semov et al., 2005). These results thus suggest oneadditional mechanism for the extensive ECM remodelingoccurring in PTC (Figure 4).Our gene list is consistent with the tumor invasion mode<strong>of</strong> PTCDifferent invasion mechanisms, separated in individualandcollective-cell migration modes, have been describedin the literature (Friedl, 2004). These different strategiesOncogene
<strong>Gene</strong> <strong>expression</strong> and biological phenotype <strong>of</strong> PTCL Delys et al7Figure 4 Simplified view <strong>of</strong> the ECM proteins degradation in PTC. See main text for explanations. Colors signification: red,over<strong>expression</strong> in tumors; yellow, no regulation; green, under<strong>expression</strong> in tumors. ECM, extracellular matrix; PTC, papillary thyroidcarcinoma.are determined by different molecular programmes witha higher <strong>expression</strong> <strong>of</strong> cell–cell adhesion proteins,proteases and integrins in collective- than in single-cellmigration modes. Our gene list reveals a high proportion<strong>of</strong> upregulated genes coding for cell–cell adhesionproteins (17 up and 2 down), which was statisticallysignificant according to DAVID (Table 1). They includedifferent cadherins and claudins, which largely compensatethe two downregulated genes, CDH16 and CLDN5(see Supplementary Table 5). Moreover, five genescoding for integrin subunits were upregulated (seeSupplementary Table 5) with a DAVID P-value slightlyabove 0.05 (Table 1) and over<strong>expression</strong> <strong>of</strong> manyproteases was observed (see above). These results areconsistent with a predominant collective-cell migrationmode <strong>of</strong> tumor cells, in clusters and sheets, observed bythe pathologists (Figure 5; Friedl, 2004).On the other hand, the epithelial to mesenchymaltransition is usually considered as an important processleading to dissemination and metastasis spread innumerous cancers. The epithelial to mesenchymaltransition markers (downregulation <strong>of</strong> CDH1 andcytokeratins and over<strong>expression</strong> <strong>of</strong> vimentin) were notor inversely regulated in our gene list, suggesting thatthis process does not occur globally in the tumor,although it might happen locally, in highly invasiveregion, as recently proposed by Vasko et al. (2007).These results suggest an inverse relation betweenintercellular adhesion and distant metastasis ability.The fact that claudins are no longer overexpressed in themuch more invasive dedifferentiated forms supports thishypothesis (Fluge et al., 2006).<strong>Gene</strong>ral conclusionIn conclusion, we compiled a reliable list <strong>of</strong> genesregulated in the majority <strong>of</strong> PTC from three large-scaleindependent microarray studies. This enabled us tobetter understand papillary thyroid carcinogenesis andOncogene
8<strong>Gene</strong> <strong>expression</strong> and biological phenotype <strong>of</strong> PTCL Delys et al<strong>Gene</strong>pix 4000B scanner. All details <strong>of</strong> microarray data preprocessing,normalization and detection <strong>of</strong> differentiallyexpressed genes are described in Supplementary Information.Figure 5 Hematoxylin eosin staining ( 200 magnification). Thefibrous inflammatory interface between the tumor and the adjacenttissue is penetrated by tumor cells organized in sheets (showed byarrows), illustrating the collective-migration mode <strong>of</strong> tumor cellshypothesis applied to PTC progression. PTC, papillary thyroidcarcinomato correlate many <strong>of</strong> these data to the biology and thehistology <strong>of</strong> the tumor. Interestingly, alterations in theregulation <strong>of</strong> some signaling cascades described in thispaper, such as activation <strong>of</strong> the EGF signaling pathway,are also found in mice models <strong>of</strong> PTC. In the future,these mice will enable us to confirm in vivo the biologicalrole <strong>of</strong> candidate genes in papillary thyroidcarcinogenesis.Materials and methodsTissue samplesPaired samples <strong>of</strong> tumoral and non-tumoral thyroid tissuecounterparts were obtained from the Institute <strong>of</strong> Endocrinologyand metabolism in Kiev, Ukraine via the ChernobylTissue Bank (n ¼ 12, www.chernobyltissuebank.com) and frompatients undergoing surgery for PTC at the A. Pare Hospital(n ¼ 14; Boulogne, France). Clinical and histological information<strong>of</strong> these tissues are provided in Supplementary Table 6.Tumoral and tissue counterparts were immediately frozen inliquid nitrogen and stored at 801C until use. Diagnoses weremade by the Department <strong>of</strong> Pathology at the A. Pare Hospitalin Boulogne or by the International Pathology Panel <strong>of</strong> theChernobyl Tissue Bank samples. The protocol receivedapproval from the Institutional ethics committees.Microarray experimentsRNA purification, amplification, cDNA synthesis and labelingwere performed as described in Supplementary Information.All the tumor/non-tumor tissue pairs (n ¼ 26) were hybridizedaccording to the manufacturer’s protocol on Human 1 cDNAmicroarray (Agilent Technologies, Palo Alto, CA, USA)covering 8000 genes. The microarrays were scanned with aReal-time RT–PCRConfirmation <strong>of</strong> the reliability <strong>of</strong> the gene list was performedby real-time RT–PCR (Eurogentec, Liege, Belgium) on 11–20tumor/non-tumoral samples for 15 selected genes. The primerswere designed with the Primer Express s<strong>of</strong>tware (AppliedBiosystems, Foster City, CA, USA) and are listed inSupplementary Table 7. All PCR efficiencies, obtained withfour serial dilutions points (ranging from 20 ng to 200 pg), wereabove 90% and real-time RT–PCR was performed in duplicatefor each gene. More details <strong>of</strong> the procedure are provided inSupplementary Information.Normalization <strong>of</strong> real-time RT–PCR dataTo identify the most stably expressed control genes fornormalization in our thyroid cancer samples, several potentialnon-regulated genes were amplified by real-time RT–PCR in20 tumor/non-tumor pairs <strong>of</strong> samples. PBGD (porphobilinogendeaminase) and 36B4 (ribosomal phosphoprotein acidicP0), two commonly used housekeeping genes, were tested andcompared to NEDD8 and TTC1, two <strong>of</strong> the most stable genesfound in our microarray data set. Using the GeNorm s<strong>of</strong>tware(Vandesompele et al., 2002), we identified the best combination<strong>of</strong> non-modulated genes to normalize our data. PBGD and36B4 came out in first and second rank, respectively, while thebest stability score was obtained by the combination <strong>of</strong>NEDD8 and TTC1 (M-value in GeNorm ¼ 0.192). Becausethe association <strong>of</strong> these two genes gave a good stability scoreaccording to GeNorm, we used them as normalizationgenes for RT–PCR. The tumor/non-tumor <strong>expression</strong> ratio<strong>of</strong> a target gene was obtained by dividing their respectivenormalized quantities obtained by GeNorm (Vandesompeleet al., 2002).AcknowledgementsWe thank Chantal Degraef for her excellent technicalassistance. We acknowledge the confirmation <strong>of</strong> diagnosisprovided by the International Pathology Panel <strong>of</strong> theChernobyl Tissue Bank: Dr Alexandr Abrosimov, Pr<strong>of</strong>essorMasahiro Ito, Pr<strong>of</strong>essor Virginia LiVolsi, Pr<strong>of</strong>essor JuanRosai and Pr<strong>of</strong>essor Sir Dillwyn Williams. This work wassupported by Ministère de la Politique Scientifique (PAI),Action Concertée de la Communaute´ Franc¸aise, FondsNational de la Recherche Scientifique, Fonds de la RechercheScientifique Me´ dicale, Te´ le´ vie and Fondation Van Buuren.Laurent Delys is supported by Te´ le´ vie, Vincent Detours byEuropean Union’s Marie Curie grant MEIF-CT-2003-501459,Fre´ de´ rick Libert by the Fonds National de la RechercheScientifique. The works <strong>of</strong> all authors were not cited in thispaper due to a limitation <strong>of</strong> space. We apologize for it.Microarray data accession number: GSE3950 (GEO database,NCBI).ReferencesAlberti L, Carniti C, Miranda C, Roccato E, Pierotti MA.(2003). RET and NTRK1 proto-oncogenes in humandiseases. J Cell Physiol 195: 168–186.Baris O, Mirebeau-Prunier D, Savagner F, Rodien P,Ballester B, Loriod B et al. (2005). <strong>Gene</strong> pr<strong>of</strong>iling revealsspecific oncogenic mechanisms and signaling pathways inoncocytic and papillary thyroid carcinoma. Oncogene 24:4155–4161.Borrello MG, Alberti L, Fischer A, Degl’innocenti D, FerrarioC, Gariboldi M et al. (2005). Induction <strong>of</strong> a proinflammatoryOncogene
program in normal human thyrocytes by the RET/PTC1oncogene. Proc Natl Acad Sci USA 102: 14825–14830.Ciampi R, Nikiforov YE. (2005). Alterations <strong>of</strong> the BRAFgene in thyroid tumors. Endocr Pathol 16: 163–172.Dano K, Behrendt N, Hoyer-Hansen G, Johnsen M, LundLR, Ploug M et al. (2005). Plasminogen activation andcancer. Thromb Haemost 93: 676–681.de Visser KE, Eichten A, Coussens LM. (2006). Paradoxicalroles <strong>of</strong> the immune system during cancer development. NatRev Cancer 6: 24–37.Dennis Jr G, Sherman BT, Hosack DA, Yang J, Gao W, LaneHC et al. (2003). DAVID: database for annotation,visualization, and integrated discovery. Genome Biol 4: 3.Detours V, Wattel S, Venet D, Hutsebaut N, Bogdanova T,Tronko MD et al. (2005). Absence <strong>of</strong> a specific radiationsignature in post-Chernobyl thyroid cancers. Br J Cancer 92:1545–1552.Farooq A, Zhou MM. (2004). Structure and regulation <strong>of</strong>MAPK phosphatases. Cell Signal 16: 769–779.Fiddes RJ, Campbell DH, Janes PW, Sivertsen SP, Sasaki H,Wallasch C et al. (1998). Analysis <strong>of</strong> Grb7 recruitment byheregulin-activated erbB receptors reveals a novel targetselectivity for erbB3. J Biol Chem 273: 7717–7724.Fluge O, Akslen LA, Haugen DR, Varhaug JE, Lillehaug JR.(2000). Expression <strong>of</strong> heregulins and associations with theErbB family <strong>of</strong> tyrosine kinase receptors in papillary thyroidcarcinomas. Int J Cancer 87: 763–770.Fluge O, Bruland O, Akslen LA, Lillehaug JR, Varhaug JE.(2006). <strong>Gene</strong> <strong>expression</strong> in poorly differentiated papillarythyroid carcinomas. Thyroid 16: 161–175.Friedl P. (2004). Prespecification and plasticity: shiftingmechanisms <strong>of</strong> cell migration. Curr Opin Cell Biol 16:QJ;14–23.Gimm O. (2001). Thyroid cancer. Cancer Lett 163: 143–156.Giordano TJ, Kuick R, Thomas DG, Misek <strong>DE</strong>, Vinco M,Sanders D et al. (2005). Molecular classification <strong>of</strong> papillarythyroid carcinoma: distinct BRAF, RAS, and RET/PTCmutation-specific gene <strong>expression</strong> <strong>pr<strong>of</strong>iles</strong> discovered byDNA microarray analysis. Oncogene 24: 6646–6656.Haugen DR, Akslen LA, Varhaug JE, Lillehaug JR. (1996).Expression <strong>of</strong> c-erbB-3 and c-erbB-4 proteins in papillarythyroid carcinomas. Cancer Res 56: 1184–1188.Hawthorn L, Stein L, Varma R, Wiseman S, Loree T, Tan D.(2004). TIMP1 and SERPIN-A over<strong>expression</strong> and TFF3and CRABP1 under<strong>expression</strong> as biomarkers for papillarythyroid carcinoma. Head Neck 26: 1069–1083.Hoelting T, Siperstein AE, Clark OH, Duh QY. (1994).Epidermal growth factor enhances proliferation, migration,and invasion <strong>of</strong> follicular and papillary thyroid cancerin vitro and in vivo. J Clin Endocrinol Metab 79: 401–408.Hosack DA, Dennis Jr G, Sherman BT, Lane HC, LempickiRA. (2003). Identifying biological themes within lists <strong>of</strong>genes with EASE. Genome Biol 4: R70.1–R70.8.Huang Y, Prasad M, Lemon WJ, Hampel H, Wright FA,Kornacker K et al. (2001). <strong>Gene</strong> <strong>expression</strong> in papillarythyroid carcinoma reveals highly consistent <strong>pr<strong>of</strong>iles</strong>. ProcNatl Acad Sci USA 98: 15044–15049.Jarzab B, Wiench M, Fujarewicz K, Simek K, Jarzab M,Oczko-Wojciechowska M et al. (2005). <strong>Gene</strong> <strong>expression</strong>pr<strong>of</strong>ile <strong>of</strong> papillary thyroid cancer: sources <strong>of</strong> variability anddiagnostic implications. Cancer Res 65: 1587–1597.Kondo T, Ezzat S, Asa SL. (2006). Pathogenetic mechanismsin thyroid follicular-cell neoplasia. Nat Rev Cancer 6:292–306.Kurten RC, Cadena DL, Gill GN. (1996). Enhanceddegradation <strong>of</strong> EGF receptors by a sorting nexin, SNX1.Science 272: 1008–1010.<strong>Gene</strong> <strong>expression</strong> and biological phenotype <strong>of</strong> PTCL Delys et alLanzetti L, Rybin V, Malabarba MG, Christ<strong>of</strong>oridis S, ScitaG, Zerial M et al. (2000). The Eps8 protein coordinates EGFreceptor signalling through Rac and trafficking throughRab5. Nature 408: 374–377.Livolsi VA, Albores-Saavedra J, Asa Sl, Baloch ZW, BalochZW, Baloch ZW et al. (2004). Pathology and <strong>Gene</strong>tics <strong>of</strong>Tumours <strong>of</strong> Endocrine Organs. In: DeLellis RA, LLoyd RV,Heitz PU, Eng Ch (eds). Oxford University press: Oxford,pp 57–66.Mandl M, Slack DN, Keyse SM. (2005). Specific inactivationand nuclear anchoring <strong>of</strong> extracellular signalregulatedkinase 2 by the inducible dual-specificityprotein phosphatase DUSP5. Mol Cell Biol 25:1830–1845.Melillo RM, Castellone MD, Guarino V, De Falco V, CiraficiAM, Salvatore G et al. (2005). The RET/PTC-RAS-BRAFlinear signaling cascade mediates the motile and mitogenicphenotype <strong>of</strong> thyroid cancer cells. J Clin Invest 115:1068–1081.Milde-Langosch K. (2005). The Fos family <strong>of</strong> transcriptionfactors and their role in tumourigenesis. Eur J Cancer 41:2449–2461.Mitsiades CS, Kotoula V, Poulaki V, Sozopoulos E, Negri J,Charalambous E et al. (2006). Epidermal growth factorreceptor as a therapeutic target in human thyroid carcinoma:mutational and functional analysis. J Clin Endocrinol Metab91: 3662–3666.Normanno N, De Luca A, Bianco C, Strizzi L, Mancino M,Maiello MR et al. (2006). Epidermal growth factor receptor(EGFR) signaling in cancer. <strong>Gene</strong> 366: 2–16.Pavlidis P, Li Q, Noble WS. (2003). The effect <strong>of</strong> replicationon gene <strong>expression</strong> microarray experiments. Bioinformatics19: 1620–1627.Powell Jr DJ, Eisenlohr LC, Rothstein JL. (2003). A thyroidtumor-specific antigen formed by the fusion <strong>of</strong> two selfproteins. J Immunol 170: 861–869.Prasad ML, Pellegata NS, Huang Y, Nagaraja HN, de la CA,Kloos RT. (2005). Galectin-3, fibronectin-1, CITED-1,HBME1 and cytokeratin-19 immunohistochemistry is usefulfor the differential diagnosis <strong>of</strong> thyroid tumors. Mod Pathol18: 48–57.Semov A, Moreno MJ, Onichtchenko A, Abulrob A, Ball M,Ekiel I et al. (2005). Metastasis-associated protein S100A4induces angiogenesis through interaction with annexin IIand accelerated plasmin formation. J Biol Chem 280:20833–20841.Shin E, Hong SW, Kim SH, Yang WI. (2004). Expression <strong>of</strong>down stream molecules <strong>of</strong> RET (p-ERK, p-p38 MAPK,p-JNK and p-AKT) in papillary thyroid carcinomas. YonseiMed J 45: 306–313.Sid B, Dedieu S, Delorme N, Sartelet H, Rath GM,Bellon G et al. (2006). Human thyroid carcinoma cellinvasion is controlled by the low density lipoproteinreceptor-related protein-mediated clearance <strong>of</strong> urokinaseplasminogen activator. Int J Biochem Cell Biol 38:1729–1740.Skrzydlewska E, Sulkowska M, Koda M, SulkowskiS.(2005). Proteolytic–antiproteolytic balance and its regulationin carcinogenesis. World J Gastroenterol 11:1251–1266.Subramanian A, Tamayo P, Mootha VK, Mukherjee S, EbertBL, Gillette MA et al. (2005). <strong>Gene</strong> set enrichment analysis:a knowledge-based approach for interpreting genomewide<strong>expression</strong> <strong>pr<strong>of</strong>iles</strong>. Proc Natl Acad Sci USA 102:15545–15550.Vandesompele J, De Preter K, Pattyn F, Poppe B, Van Roy N,De Paepe A et al. (2002). Accurate normalization <strong>of</strong>9Oncogene
10<strong>Gene</strong> <strong>expression</strong> and biological phenotype <strong>of</strong> PTCL Delys et alreal-time quantitative RT-PCR data by geometric averaging<strong>of</strong> multiple internal control genes. Genome Biol 3:RESEARCH0034.01–0034.112.Vasko V, Espinosa AV, Scouten W, He H, Auer H,Liyanarachchi S et al. (2007). <strong>Gene</strong> <strong>expression</strong> and functionalevidence <strong>of</strong> epithelial-to-mesenchymal transition inpapillary thyroid carcinoma invasion. Proc Natl Acad SciUSA 104: 2803–2808.Wattel S, Mircescu H, Venet D, Burniat A, Franc B, Frank Set al. (2005). <strong>Gene</strong> <strong>expression</strong> in thyroid autonomousadenomas provides insight into their physiopathology.Oncogene 24: 6902–6916.Zou M, Al Baradie RS, Al Hindi H, Farid NR, Shi Y. (2005).S100A4 (Mts1) gene over<strong>expression</strong> is associated withinvasion and metastasis <strong>of</strong> papillary thyroid carcinoma.Br J Cancer 93: 1277–1284.Supplementary Information accompanies the paper on the Oncogene website (http://www.nature.com/onc).Oncogene
<strong>Gene</strong> symbol<strong>Gene</strong> nameMean ratio inDelys'sdatasetMean ratio inJarzab'sdatasetMean ratio inHuang'sdatasetIntegrin subunitsITGA2 Integrin, alpha 2 (CD49B, alpha 2 subunit <strong>of</strong> VLA-2 receptor) 2.3 4.6 1.4ITGA3Integrin, alpha 3 (antigen CD49C, alpha 3 subunit <strong>of</strong> VLA-3receptor)2.1 3.2 4.9ITGA9 Integrin, alpha 9 NA 1.7 2.5ITGB5 Integrin, beta 5 NA 1.7 2.1ITGB7 Integrin, beta 7 1.6 2.5 0.9Integrin-associated proteinsADAM12 ADAM metallopeptidase domain 12 (meltrin alpha) 1.6 4.6 1.0CD151 CD151 antigen 1.7 2.3 2.8MET Met proto-oncogene (hepatocyte growth factor receptor) NA 4.0 2.8SDC4 Syndecan 4 (amphiglycan, ryudocan) 4.3 6.1 12.1TM4SF2 transmembrane 4 superfamily member 2 0.50 NA 0.38ECM proteinsCOL1A1 Collagen, type I, alpha 1 2.1 2.6 1.5FN1 Fibronectin 1 2.3 8.6 26.0LAMB3 Laminin, beta 3 3.5 24.3 6.5LAMC2 Laminin, gamma 2 1.9 2.0 1.4THBS1 Thrombospondin 1 2.1 1.7 1.0TNC Tenascin C (hexabrachion) 2.5 3.2 3.0CYR61 cysteine-rich, angiogenic inducer, 61 0.38 0.66 0.57FBLN5 fibulin 5 0.35 0.54 0.47LAMA2 laminin, alpha 2 (merosin, congenital muscular dystrophy) 0.44 0.57 1.32OthersACTN4 Actinin, alpha 4 1.1 1.5 1.7FYN FYN oncogene related to SRC, FGR, YES 1.6 1.6 1.5TIAM1 T-cell lymphoma invasion and metastasis 1 3.0 6.5 3.7RRAS Related RAS viral (r-ras) oncogene homolog 1.5 2.3 2.3Table 6. Proteins involved in integrin signaling. The last three columns represent the mean <strong>of</strong> <strong>expression</strong> ratio inour, Jarzab's and Huang's datasets. NA: not available
Chapter III : resultsV. Study <strong>of</strong> the integrin signaling pathway in PTCV.1 <strong>Gene</strong> <strong>expression</strong> <strong>pr<strong>of</strong>iles</strong> revealed a high proportion <strong>of</strong> genes involved inintegrin signalling cascadeIn the previous section, we obtained a list <strong>of</strong> genes differentially regulated betweenpapillary thyroid carcinomas and their adjacent tissues. This list revealed a highproportion <strong>of</strong> genes differentially expressed that are involved, directly or indirectly, in theintegrin signaling pathway. Integrins are a large family <strong>of</strong> heterodimeric transmembranereceptors that mediate adhesion to extracellular matrix components (ECM), organize thecytoskeleton and activate intracellular signaling pathways 43 . Overall, 23 genes playing arole in integrin signaling at different levels were altered in PTCs, suggesting theirpotential implication in papillary thyroid carcinogenesis (table 6). Tumors cells usuallyshow a switch in their integrin <strong>expression</strong>: they overexpress integrins favoring theirproliferation and progression, and tend to lose the integrins that secure their adhesion tothe basement membrane. Three α-subunits (ITGA2, ITGA3, ITGA9) and 2 β-subunits(ITGB5 and ITGB7) that form integrins were overexpressed in PTCs. At the plasmamembrane level, several integrin-associated proteins which are stably coupled withintegrins and modulate integrin responses were also deregulated: ADAM12, CD151,MET, SDC4 were upregulated and TM4SF2 was downregulated in PTCs. As mentionedin the previous section, many ECM or ECM-associated proteins were altered in PTCs:COL1A1, FN1, LAMB3, LAMC2, THBS1, TNC were overexpressed whereas CYR61,FBLN5 and LAMA2 were downregulated. Ligand binding to the clustered integrins leadsto the recruitment <strong>of</strong> cytoskeletal components such as α-actinin and accordingly, ACTN4was upregulated. Furthermore, ligand binding induces phosphorylation events at focaladhesion sites by members <strong>of</strong> the Src protein kinase family including FYN (up), whichleads to the recruitment and activation <strong>of</strong> downstream signaling molecules. TIAM1,upregulated in PTCs, regulates the activity <strong>of</strong> Rho GTPases that mediate many <strong>of</strong> theintegrin-dependent modifications <strong>of</strong> the actin cytoskeleton and are necessary for cell76
FAK total FAK pY 397250 kD150 kD100 kD75 kD1 2 1 2Figure 27. Western blotting using anti-FAK antibody and anti-FAK pY 397 antibody revealed a band at125 kD corresponding to the FAK protein. 10 µg <strong>of</strong> proteins were loaded in each well. Lane 1: KAT10cell line; lane 2: BCPAP cell line.NPTC29PTC29NPTC30PTC30NPTC31PTC31NPTC33PTC33PAPTC5PTC12PTC28PTC32FAK total9 16 5 26 3 21 9 12 9 20 21 4 46α-tubulin10 17 5 24 4 15 8 18 11 25 10 8 46β-actin5 17 4 30 4 13 7 20 10 9 4 31 46Figure 28. Western blotting <strong>of</strong> FAK, α-tubulin and β-actin on papillary thyroid cancers and adjacenttissues. 10 µg <strong>of</strong> proteins were loaded in each well. Numbers below each band represent the relativecontribution for the considered protein for each blot using the Quantity One s<strong>of</strong>tware. PTC: papillarythyroid carcinoma; NPTC: adjacent tissue to PTC; PA: pool <strong>of</strong> 23 adjacent tissues to different thyroidpathologies.
Chapter III : resultsmigration 43 . Finally, RRAS, another small GTPase, was also overexpressed in PTCs andenhances integrin ligand-binding activity 169 .Despite the important regulation <strong>of</strong> numerous integrins and proteins associated to theintegrin signaling pathway, the DAVID s<strong>of</strong>tware did not show a statistically alteration <strong>of</strong>this pathway, although the integrin GO category was over-represented with a p-value <strong>of</strong>0,063. This could be explained by the fact that many genes are known to be involveddirectly or indirectly in this pathway. Consequently, the regulation <strong>of</strong> this pathway isuncertain.V.2 Expression <strong>of</strong> focal adhesion kinase in PTCWe then decided to go further in our investigations because this cascade plays a majorrole in the carcinogenesis <strong>of</strong> numerous tumors and is not yet well described in PTC 43 .Focal adhesion kinase (FAK), a non-receptor protein tyrosine kinase, is a key element <strong>of</strong>integrin signaling 43 . FAK mRNA was not regulated in PTC compared to their adjacenttissues but regulation <strong>of</strong> this protein also involves post-transcriptional regulations andphosphorylation at multiple tyrosine and serine residues. We therefore decided toinvestigate its regulation at protein level.Tyrosine 397 is the autophosphorylation site <strong>of</strong> FAK which is involved in its initialactivation 43 . In order to have more insights on the possible activation <strong>of</strong> the integrinsignaling in PTC, we determined FAK protein regulation in PTC using anti-FAKantibody and anti-FAK [pY 397 ] phosphospecific antibody. To assess the quality <strong>of</strong> ourantibodies, we first used KAT10 and BCPAP thyroid tumor-derived cell lines andobserved a good specificity (figure 27). Eight PTC compared to control tissues were thenused to assess the regulation <strong>of</strong> FAK. The controls were the adjacent tissue <strong>of</strong> theconsidered PTC when it was available. When no adjacent tissue was available, FAK<strong>expression</strong> in PTC was compared to a pool <strong>of</strong> 23 adjacent tissues to different thyroidpathologies. As shown in figure 28, we observed an upregulation <strong>of</strong> FAK in 7/8 PTC.However, surprisingly, a similar trend <strong>of</strong> regulation was observed with α-tubulin and β-77
Ratio Tumor /NormalFAK withoutnormalizationFAK nomalized with α-tubulinFAK normalized with β-actinPTC29 / NPTC291.780.990.51PTC30 / NPTC305.621.160.68PTC31 / NPTC316.751.812.13PTC33 / NPTC331.320.600.47PTC5 / PA2.171.002.38PTC12 / PA2.382.646.72PTC28 / PA0.440.600.15PTC32 / PA5.151.271.15Table 7. Ratio tumoral vs control <strong>of</strong> FAK protein <strong>expression</strong> without normalization ornormalized with α-tubulin or β-actin. FAK was considered as overexpressed when its ratiotumoral vs control was > 1,5 (in bold). PTC: papillary thyroid carcinoma; NPTC: adjacenttissue to PTC; PA: pool <strong>of</strong> adjacent tissues to different thyroid pathologies.
Chapter III : resultsactin used as normalization proteins (figure 28). We thus decided to quantify the intensity<strong>of</strong> each band using the Quantity One s<strong>of</strong>tware 4.2.1 from Bio-Rad in order to determinethe ratio between the tumoral and the adjacent tissue taking into account the <strong>expression</strong> <strong>of</strong>the normalization proteins (figure 28). Whereas without normalization, FAK wasupregulated in 6/8 PTC compared to adjacent tissues (Table 7), after normalization withα-tubulin and β-actin, only 2 and 3 PTC still overexpressed FAK, respectively (Table 7),suggesting that the integrin signaling was not consistently overactivated byover<strong>expression</strong> <strong>of</strong> the FAK protein in PTC.We then decided to investigate if the integrin signaling pathway might be overactivatedin PTC by a different phosphorylation level between tumor and control tissues. Weassessed the phosphorylation level <strong>of</strong> tyrosine 397 <strong>of</strong> FAK, which is necessary for itsinitial activation. Unfortunately, we were not able to detect any signal on thyroid tissueswhen we immunodetected with an anti-FAK [pY 397 ] phosphospecific antibody, althougha positive result has been obtained on cell lines (figure 27). A possible explanation forthis absence <strong>of</strong> phosphorylation in tissues could be the long term storage <strong>of</strong> these tissuescompared to cell lines, leading to a loss <strong>of</strong> phosphorylation. Another possibility might bethat FAK is not phosphorylated on tyrosine 397 in thyroid tissues. Given the smallamount <strong>of</strong> available proteins and these negative results, we decided not to continue theseexperiments. Consequently, we were not able to conclude to an overactivation <strong>of</strong> theintegrin signaling pathway in PTC.However, in order to understand why proteins commonly used to normalize proteins <strong>of</strong>interest were found upregulated in our tumors compared to control (figure 28), wecolored our gel with Silver Nitrate to control for equal protein amount loaded in eachwell. We clearly observed a higher proportion <strong>of</strong> proteins with a high molecular weight inadjacent tissues (> 200 kDa) and a higher proportion <strong>of</strong> low molecular weight proteins (
Chapter III : resultsrepresented in PTC compared to adjacent tissues, which explains why the normalizedproteins were detected as upregulated in our tumors.V.3 ConclusionWe were not able to find a differential activation <strong>of</strong> the integrin signaling pathwaybetween PTC and adjacent tissues, both by statistical tools at RNA levels and by thestudy <strong>of</strong> FAK, one <strong>of</strong> the central proteins <strong>of</strong> this pathway. Note that a paper 171 describedan over<strong>expression</strong> <strong>of</strong> FAK in PTC by an immunohistochemical study, but they did notconfirm the specificity <strong>of</strong> their antibody using western blotting and were not inaccordance with our and another study 172 . In conclusion, these results suggest that theintegrin signaling pathway does not play a major role in papillary thyroid carcinogenesis.In addition, these experiments showed the importance <strong>of</strong> the quantification and thenormalization procedures to assess protein regulation, especially in models where aspecific protein predominates by its presence in high proportion in one conditioncompared to the other.79
Chapter III : resultsVI.Investigation <strong>of</strong> the existence <strong>of</strong> potential paracrine factors secreted byTPC1 cells and stimulating the proliferation <strong>of</strong> PCCL3 cellsRET/PTC gene rearrangement is considered as a primary event leading to papillarythyroid carcinogenesis 105,122 . Unger et al. 119 showed by FISH a heterogeneity <strong>of</strong> tumorcells displaying the RET rearrangement. This led to the important notion that at leastsome PTC could have a polyclonal origin. To explain the idea that RET/PTC would be aprimary event but would not be present in all the tumor cells, we could imagine thepresence <strong>of</strong> paracrine factors secreted by RET/PTC rearranged cells and acting on nonrearrangedcells, leading to their proliferation. We decided to test this hypothesis by usingthe human thyroid cancer cell line TPC1, which displays the RET/PTC1 rearrangement,and the non-tumoral thyroid differentiated rat cell line PCCL3.VI.1 Principle <strong>of</strong> the experimentsAfter having brought PCCL3 cells in a quiescent state, the idea was to replace theirmedium by the incubation medium <strong>of</strong> proliferating TPC1 cells. If these cells indeedsecreted paracrine factors, their medium could influence the proliferation <strong>of</strong> quiescentPCCL3 cells. The proliferation was measured by cellular counting <strong>of</strong> PCCL3 cellspotentially stimulated by the “TPC1 medium” compared to a control medium. Anothermethod to estimate cell proliferation was BrdU staining <strong>of</strong> nuclei which were entered inthe DNA synthesis phase.VI.2 Preparation <strong>of</strong> mediumsThis experience required quiescent PCCL3 cells ready to be “stimulated” and 2 differentmediums: a 2H medium containing the potential paracrines factors secreted by the TPC1cells and a control 2H medium.80
Chapter III : resultsTo obtain the PCCL3 cells and the two mediums at the same time (day 14), 3 differentmanipulations were performed in parallel. Below, we describe the different steps andaddressed the chronology <strong>of</strong> the manipulations. For each experiment, two “stimulated”and two “control” dishes were treated.VI.2.1 Preparation <strong>of</strong> control 2H medium1 2 3 4 5 6 7 8 9 10 11 12 13 14 15 16Day 1: PCCL3 cells were seeded in 60 cm 2 dishes with 3H medium, rich in growthhormones and thus enabling cell proliferation.Day 5: PCCL3 cells were trypsinized and seeded in 60 cm 2 dishes with 3H medium.Day 8: 3H medium was changed by quiescent medium, which stops proliferation.Day 11: Quiescent medium was replaced by 2H medium, which only induced a weakproliferation.Day 14: PCCL3 cells were confluent. The 2H medium was removed and kept to beused as “control” medium.VI.2.2 Preparation <strong>of</strong> 2H medium containing the potential paracrine factors1 2 3 4 5 6 7 8 9 10 11 12 13 14 15 1681
Chapter III : resultsDay 8: TPC1 cells were seeded in 60 cm 2 dishes with 2H medium. TPC1 cellsproliferate in 2H medium because they do not need TSH to growth.Day 14: TPC1 cells were confluent. The 2H medium containing the potentialparacrine factors was removed in order to “stimulate” PCCL3 cells. It was called the“stimulating” medium.VI.2.3 Experiment allowing to obtain quiescent PCCL3 cells ready to be stimulated1 2 3 4 5 6 7 8 9 10 11 12 13 14 15 16Day 8: PCCL3 cells were trypsinized and were seeded in 6 or 60 cm 2 dishes with a3H medium. 6 cm 2 dishes were used to count cells which had incorporated BrdUduring the DNA synthesis phase; 60 cm 2 dishes were used to count the number <strong>of</strong>PCCL3 cells.Day 11: The 3H medium was removed and replaced by a quiescent medium. Notethat these cells never reached confluence.Day 14: The quiescent medium was replaced by a medium composed <strong>of</strong> 60% <strong>of</strong>control or stimulating medium (as prepared in VI.2.1 and VI.2.2) and 40% <strong>of</strong> fresh2H medium. The dilution <strong>of</strong> our mediums <strong>of</strong> interest (control and stimulating) wasrealized because nutrients <strong>of</strong> these mediums were already partially used.Day 15 in the morning: BrdU (10 -4 M) and FdU (2×10 -6 M) were added in 6 cm 2dishes.Day 16 in the morning: 60 cm 2 dishes were used to count the number <strong>of</strong> cells usinga hemocytometer and 6 cm 2 dishes were used to measure the incorporation <strong>of</strong> BrdU.82
Chapter III : resultsV.3 Cell proliferation measurementsThe BrdU incorporation experiments were performed 4 times. Results are shown below.Experiment number1234Number <strong>of</strong> nucleus having incorporated BrdUStimulated cellsControl cells16.6% 35.6%1.1% 0.8%1.9% 2.3%11.1% 9.9%11.3% 11.0%12.5% 5.2%45.8% 30.0%25.5% 48.1%We observed a large variability in the BrdU incorporation rate between our experiments.Nevertheless, our results did not support our hypothesis <strong>of</strong> paracrine factors secreted byRET/PTC cells and acting on non-rearranged cells.Cell proliferation was also assessed by counting cells after trypsinization, using ahemocytometer, and by comparing the number <strong>of</strong> stimulated and non-stimulated cells.Results are shown below.83
Chapter III : resultsExperiment number12Number <strong>of</strong> cells per dishesStimulated cells non stimulated cells684 10 4 633 10 4727 10 4 707 10 4508 10 4 963 10 4741 10 4 786 10 4Like our results concerning BrdU incorporation, these data did not support our startinghypothesis.VI.4 ConclusionIn these experiments, we investigated the hypothesis <strong>of</strong> the existence <strong>of</strong> potentialparacrine factors secreted by RET/PTC rearranged cells which could induce proliferation<strong>of</strong> neighboring non-rearranged cells. Our results did not confirm our hypothesis andshowed a large variability between experiments, especially for the BrdU incorporationexperiments. This variability could not be explained by a different genetic background <strong>of</strong>the PCCL3 cells between each experiment because they originate from the same bulb andcells used in successive experiments only differed by a few generations. We think thatthis large variability could partially be explained by the fact that 3 different experimentshad to be realized and ready at the same time. Consequently, the confluence <strong>of</strong> the cellsand the concentration <strong>of</strong> the potential paracrine factors were probably slightly differentfor each experiment.84
Chapter III : resultsThe fact that stimulated cells did not proliferate more than control cells did not mean thatparacrine factors were not present in the medium <strong>of</strong> RET/PTC rearranged cells. Indeed,different hypotheses could explain this negative result. First <strong>of</strong> all, no non-neoplastichuman thyroid cell line was available and we used a rat thyroid cell line. It is thuspossible that human paracrine factors from TPC1 could not bind their receptors onPCCL3 rat cells or that these receptors were not present on the surface <strong>of</strong> these cells, oreven that they did not activate the same signaling pathways. Another explanation for thisnegative result was the important dilution <strong>of</strong> the potential paracrine factors in themediums. In vivo, potential non-rearranged cells are very close to RET/PTC rearrangedcells and paracrine stimulations could act more efficiently. An experiment probablycloser to in vivo conditions would be to mix TPC1 and PCCL3 cells and to evaluate theproportion <strong>of</strong> PCCL3 cells entering in the DNA synthesis phase. The control would bedishes containing 100% <strong>of</strong> PCCL3 cells. The distinction between PCCL3 and TPC1 cellscould be performed by FISH using a RET/PTC1 probe.85