

Dynamic Structure of Lipid Bilayers Studied by ... - glia.cu-tokyo.ac.jp
Dynamic Structure of Lipid Bilayers Studied by ... - glia.cu-tokyo.ac.jp
Dynamic Structure of Lipid Bilayers Studied by ... - glia.cu-tokyo.ac.jp

You also want an ePaper? Increase the reach of your titles
YUMPU automatically turns print PDFs into web optimized ePapers that Google loves.
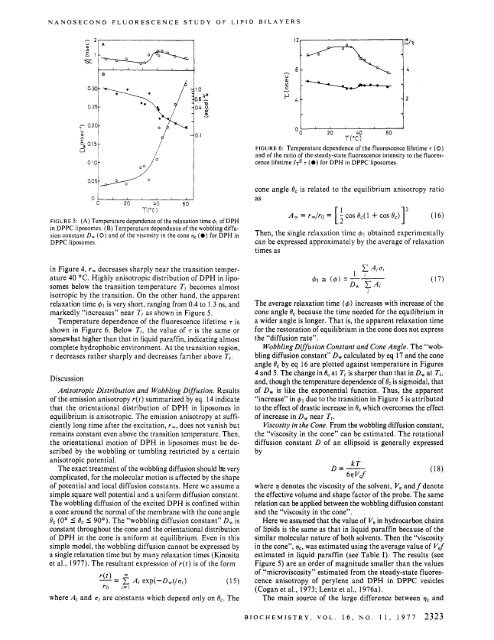
NANOSECOND FLUORESCENCE STUDY OF LIPID BILAYERS”In 04 0.1 50-II-0 1uOO 20 40 60T(T)FIGURE 6: Temperature dependence <strong>of</strong> the fluorescence lifetime T (0)and <strong>of</strong> the ratio <strong>of</strong> the steady-state fluorescence intensity to the fluorescencelifetime 1~~ T (0) for DPH in DPPC liposomes.O‘OIJ 005G L0 20 40 60T(T)FIGURE 5: (A) Temperature dependence <strong>of</strong> the relaxation time 61 <strong>of</strong> DPHin DPPC liposomes. (B) Temperature dependence <strong>of</strong> the wobbling diffusionconstant D, (0) and <strong>of</strong> the viscosity in the cone qc (0) for DPH inDPPC liposomes.in Figure 4, rm decreases sharply near the transition temperature40 ‘C. Highly anisotropic distribution <strong>of</strong> DPH in liposomesbelow the transition temperature Tt becomes almostisotropic <strong>by</strong> the transition. On the other hand, the apparentrelaxation time 41 is very short, ranging from 0.4 to 1.3 ns, andmarkedly “increases” near T, as shown in Figure 5.Temperature dependence <strong>of</strong> the fluorescence lifetime 7 isshown in Figure 6. Below T,, the value <strong>of</strong> 7 is the same orsomewhat higher than that in liquid paraffin, indicating almostcomplete hydrophobic environment. At the transition region,7 decreases rather sharply and decreases farther above T,.Dis<strong>cu</strong>ssionAnisotropic Distribution and Wobbling Diffusion. Results<strong>of</strong> the emission anisotropy r(t) summarized <strong>by</strong> eq. 14 indicatethat the orientational distribution <strong>of</strong> DPH in liposomes inequilibrium is anisotropic. The emission anisotropy at sufficientlylong time after the excitation, rm, does not vanish butremains constant even above the transition temperature. Then,the orientational motion <strong>of</strong> DPH in liposomes must be described<strong>by</strong> the wobbling or tumbling restricted <strong>by</strong> a certainanisotropic potential.The ex<strong>ac</strong>t treatment <strong>of</strong> the wobbling diffusion should bk verycomplicated, for the mole<strong>cu</strong>lar motion is affected <strong>by</strong> the shape<strong>of</strong> potential and local diffusion constants. Here we assume asimple square well potential and a uniform diffusion constant.The wobbling diffusion <strong>of</strong> the excited DPH is confined withina cone around the normal <strong>of</strong> the membrane with the cone angle8, (0’ I 8, I 90’). The “wobbling diffusion constant” D, isconstant throughout the cone and the orientational distribution<strong>of</strong> DPH in the cone is uniform at equilibrium. Even in thissimple model, the wobbling diffusion cannot be expressed <strong>by</strong>a single relaxation time but <strong>by</strong> many relaxation times (Kinositaet al., 1977). The resultant expression <strong>of</strong> r(t) is <strong>of</strong> the formwhere Ai and ui are constants which depend only on 8,. Thecone angle 0, is related to the equilibrium anisotropy ratioasThen, the single relaxation time $1 obtained experimentallycan be expressed approximately <strong>by</strong> the average <strong>of</strong> relaxationtimes asThe average relaxation time (4) increases with increase <strong>of</strong> thecone angle 8, because the time needed for the equilibrium ina wider angle is longer. That is, the apparent relaxation timefor the restoration <strong>of</strong> equilibrium in the cone does not expressthe “diffusion rate”.Wobbling Diffusion Constant and Cone Angle. The “wobblingdiffusion constant” D, cal<strong>cu</strong>lated <strong>by</strong> eq 17 and the coneangle 8, <strong>by</strong> eq 16 are plotted against temperature in Figures4 and 5. The change in 8, at T1 is sharper than that in D, at Tt,and, though the temperature dependence <strong>of</strong> BC is sigmoidal, that<strong>of</strong> D, is like the exponential function. Thus, the apparent“increase” in 41 due to the transition in Figure 5 is attributedto the effect <strong>of</strong> drastic increase in 8, which overcomes the effect<strong>of</strong> increase in D, near Tt.Viscosity in the Cone. From the wobbling diffusion constant,the “viscosity in the cone” can be estimated. The rotationaldiffusion constant D <strong>of</strong> an ellipsoid is generally expressed<strong>by</strong>D=- kT6.11 Vdwhere 7 denotes the viscosity <strong>of</strong> the solvent, V, and f denotethe effective volume and shape f<strong>ac</strong>tor <strong>of</strong> the probe. The samerelation can be applied between the wobbling diffusion constantand the “viscosity in the cone”.Here we assumed that the value <strong>of</strong> V, in hydrocarbon chains<strong>of</strong> lipids is the same as that in liquid paraffin because <strong>of</strong> thesimilar mole<strong>cu</strong>lar nature <strong>of</strong> both solvents. Then the “viscosityin the cone”, v,, was estimated using the average value <strong>of</strong> V$estimated in liquid paraffin (see Table I). The results (seeFigure 5) are an order <strong>of</strong> magnitude smaller than the values<strong>of</strong> “microviscosity” estimated from the steady-state fluorescenceanisotropy <strong>of</strong> perylene and DPH in DPPC vesicles(Cogan et al., 1973; Lentz et al., 1976a).The main source <strong>of</strong> the large difference between vC andiBIOCHEMISTRY, VOL. 16, NO. 11, 1977 2323