MASSACHUSETTS 1999 TABLES - SAMHSA Store
MASSACHUSETTS 1999 TABLES - SAMHSA Store
MASSACHUSETTS 1999 TABLES - SAMHSA Store

Create successful ePaper yourself
Turn your PDF publications into a flip-book with our unique Google optimized e-Paper software.
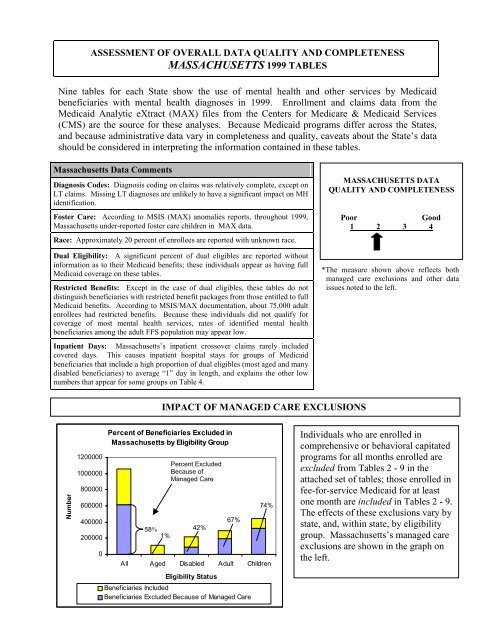
TABLE 4PSYCHIATRIC AND GENERAL INPATIENT HOSPITAL USE AND AVERAGE ANNUAL HOSPITAL DAYS PER USERFOR MEDICAID FFS MENTAL HEALTH POPULATION, BY SEX AND AGE GROUP<strong>MASSACHUSETTS</strong>, CALENDAR YEAR <strong>1999</strong>Psychiatric HospitalGeneral InpatientHospitalMental Health TreatmentTotal Inpatient HospitalMental Health TreatmentGeneral Inpatient Hospital Use by FFSMH Population for Non-Mental HealthDiagnosesSexAge GroupNumber ofUsersAverageAnnualDays PerUserNumber ofUsersAverageAnnualDays PerUserNumber ofUsersPercent ofTotal FFSMentalHealthBeneficiariesAverageAnnualDays PerUserNumber ofUsersPercent ofTotal FFSMentalHealthBeneficiariesAverageAnnualDays PerUserFemale 0-3 0 0 0 0 0 0% 0 14 21% 84-5 0 0 0 0 0 0% 0 1 1% 26-12 4 102 2 25 6 1% 77 5 1% 613-18 41 100 20 13 58 6% 75 21 2% 519-21 14 21 23 6 34 7% 13 30 6% 222-44 639 4 820 3 1,357 12% 4 1,328 12% 145-64 324 4 521 3 793 9% 4 1,669 18% 165+ 152 19 408 1 545 4% 6 3,938 28% 0All Ages 1,174 10 1,794 3 2,793 8% 6 7,006 19% 1Male 0-3 0 0 0 0 0 0% 0 12 12% 34-5 0 0 0 0 0 0% 0 2 1% 76-12 18 115 8 11 25 2% 86 2 0% 413-18 36 94 22 18 53 4% 71 7 1% 719-21 16 35 27 13 39 12% 24 15 5% 1022-44 845 4 944 2 1,670 15% 3 1,225 11% 145-64 419 5 462 3 813 11% 4 1,437 19% 265+ 112 40 134 2 240 5% 20 1,529 31% 1All Ages 1,446 11 1,597 3 2,840 11% 7 4,229 16% 1Total 0-3 0 0 0 0 0 0% 0 26 16% 64-5 0 0 0 0 0 0% 0 3 1% 56-12 22 113 10 14 31 1% 85 7 0% 513-18 77 97 42 16 111 5% 73 28 1% 619-21 30 29 50 10 73 9% 19 45 6% 522-44 1,484 4 1,764 3 3,027 14% 4 2,553 12% 145-64 743 5 983 3 1,606 10% 4 3,106 19% 165+ 264 28 542 1 785 4% 10 5,467 28% 1All Ages 2,620 11 3,391 3 5,633 9% 7 11,235 18% 1Notes: All beneficiaries in this table had a mental health diagnosis as the primary diagnosis on a FFS Medicaid claim during <strong>1999</strong>, or received a clearly identifiablemental health service (inpatient psychiatric service for age 65+ or under age 22, or nursing facility mental health service for age 65+).Those who received inpatient hospital services for which the primary diagnosis on the hospital claim was a mental health diagnosis are shown in the “GeneralInpatient Hospital – Mental Health Treatment” column. Those who received inpatient hospital services for which the primary diagnosis on the claim was not a mentalhealth diagnosis are shown in the “General Inpatient Hospital Use by FFS MH Population for Non-Mental Health Diagnoses” column.When a dually eligible beneficiary’s inpatient stay is primarily covered by Medicare, Medicaid often pays a deductible. Some states interpret their payment of thedeductible as Medicaid coverage for one day of the stay. Other states interpret “Medicaid covered days” as including only days covered in full by Medicaid, and thusreport zero covered days on a crossover stay. Another group of states reports the number of days covered by Medicare as covered days. Finally, many states donot retain any details about lengths of stay on crossover claims. For any one or combination of these reasons, average lengths of stay for beneficiaries who aredually eligible (most aged and some adults) are inaccurately reduced because of the presence of individual claims with "1" or "0" covered days. In somecircumstances this even causes inpatient hospital stays to average “0” days in length, and it explains more generally the low numbers that appear for some groups onTable 4.Individuals may appear in more than one column on this table.Table4
TABLE 5EMERGENCY ROOM USE FOR MEDICAID FFS MENTAL HEALTH AND NON-MENTALHEALTH BENEFICIARIES, BY SEX AND AGE GROUP<strong>MASSACHUSETTS</strong>, CALENDAR YEAR <strong>1999</strong>SexAge GroupMental Health Beneficiaries With Any Emergency Room UseNumberPercent ofTotal FFSMental HealthBeneficiariesAverage Number of Emergency RoomVisits for Users of Any ER VisitsFor MentalHealthTreatmentFor Non-MentalHealthTreatmentAll ER VisitsNon- Mental Health Beneficiaries WithAny Emergency Room UseNumberPercent ofTotal FFSNon-MentalHealthBeneficiariesAverageNumber ofEmergencyRoom Visitsfor Users ofAny ERVisitsFemale 0-3 13 19% 0.15 1.85 2.00 616 4% 1.274-5 15 14% 0.13 0.93 1.07 218 4% 1.226-12 70 9% 0.20 1.07 1.27 578 3% 1.2413-18 203 20% 0.44 1.50 1.94 608 4% 1.3619-21 130 28% 0.38 1.42 1.81 719 8% 1.3722-44 2,915 27% 0.37 1.77 2.14 3,761 7% 1.4145-64 2,280 24% 0.23 1.63 1.86 2,355 10% 1.5565+ 2,968 21% 0.12 1.49 1.62 7,876 10% 1.38All Ages 8,594 23% 0.25 1.62 1.86 16,731 7% 1.40Male 0-3 15 15% 0.07 1.33 1.40 758 5% 1.344-5 19 9% 0.05 1.26 1.32 250 4% 1.246-12 149 10% 0.32 1.20 1.52 625 3% 1.2313-18 194 16% 0.43 1.31 1.74 547 4% 1.2819-21 85 26% 0.67 1.45 2.12 189 4% 1.5822-44 2,796 25% 0.40 1.62 2.02 2,694 7% 1.5745-64 1,879 25% 0.28 1.75 2.04 2,522 11% 1.6265+ 1,163 23% 0.13 1.64 1.77 3,235 11% 1.47All Ages 6,300 24% 0.32 1.64 1.95 10,820 7% 1.49Total 0-3 28 17% 0.11 1.57 1.68 1,374 4% 1.314-5 34 10% 0.09 1.12 1.21 468 4% 1.236-12 219 10% 0.28 1.16 1.44 1,203 3% 1.2313-18 397 18% 0.43 1.41 1.84 1,155 4% 1.3219-21 215 27% 0.50 1.43 1.93 908 7% 1.4122-44 5,711 26% 0.38 1.69 2.08 6,455 7% 1.4845-64 4,159 25% 0.25 1.68 1.94 4,877 10% 1.5965+ 4,131 22% 0.13 1.54 1.66 11,111 10% 1.41All Ages 14,894 23% 0.28 1.63 1.90 27,551 7% 1.44Notes: An emergency room visit is classified as "for mental health treatment" if one of the mental health diagnoses in Table 3 is shown as the primarydiagnosis on the emergency room claim. If any other diagnosis is shown as the primary diagnosis on the claim, the emergency room visit is classifiedas being for non-mental health treatment. Visits are defined by unique dates of service.FFS mental health beneficiaries include all FFS beneficiaries who had one or more of the mental health diagnoses shown in Table 3 as a primarydiagnosis on at least one Medicaid claim during <strong>1999</strong>, or who received a clearly identifiable mental health service during the year (inpatient psychiatricservice for age 65+ or under age 22, or nursing facility mental health service for age 65+).Table5
Diagnostic CategoryPERCENT OF MEDICAID FFS MENTAL HEALTH BENEFICIARIES AGE 21 AND UNDER WHOUSED PRESCRIPTION PSYCHOTROPIC DRUGS,BY DIAGNOSTIC CATEGORY AND DRUG TYPE<strong>MASSACHUSETTS</strong>, CALENDAR YEAR <strong>1999</strong>Number ofFFS MHBeneficiariesby DiagnosticCategoryTABLE 7AntidepressantsAntipsychoticsAnti-AnxietyAgentsMoodStabilizingAgentsStimulantsMore thanOnePsychotropicDrugTypeSchizophrenia 82 46% 83% 21% 15% 4% 59% 1%Major depression and affective psychoses 643 59% 36% 23% 15% 11% 45% 15%Other psychoses 50 46% 56% 32% 12% 6% 46% 14%Childhood psychoses 172 20% 20% 19% 2% 13% 21% 34%Neurotic & other depressive disorders 948 43% 11% 16% 3% 9% 22% 30%Personality disorders 12 50% 17% 25% 17% 17% 42% 25%Other mental disorders 50 18% 6% 14% 0% 2% 10% 56%Special symptoms or syndromes 210 19% 7% 11% 2% 6% 9% 54%Stress & adjustment reactions 1,319 23% 8% 8% 2% 12% 15% 41%Conduct disorders 379 22% 11% 6% 3% 18% 16% 40%Emotional disturbances 550 27% 9% 8% 3% 17% 18% 34%Hyperkinetic syndrome 1,253 25% 8% 9% 2% 72% 26% 11%No Diagnosis 2 50% 50% 0% 0% 0% 50% 50%Total 5,670 31% 14% 12% 4% 25% 23% 46%Notes: The percentages shown do not add to 100 percent because service users with a specific diagnosis may use more than one type of drug. Psychotropicdrugs are defined and grouped according to Multum prescription drug grouping software.The diagnostic category for each user was the beneficiary’s most frequent diagnosis category in the year.Type of Psychotropic DrugNoPsychotropicDrugUseFFS mental health beneficiaries include all FFS beneficiaries who had one or more of the mental health diagnoses shown in this table as a primary diagnosis on atleast one Medicaid claim during <strong>1999</strong>, or who received a clearly identifiable mental health service during the year (inpatient psychiatric service for age 65+ or underage 22, or nursing facility mental health service for age 65+).Table7
TABLE 8PERCENT OF MEDICAID FFS MENTAL HEALTH BENEFICIARIES AGE 22 TO 64 WHOUSED PRESCRIPTION PSYCHOTROPIC DRUGS,BY DIAGNOSTIC CATEGORY AND DRUG TYPE<strong>MASSACHUSETTS</strong>, CALENDAR YEAR <strong>1999</strong>Type of Psychotropic DrugDiagnostic CategoryNumber ofFFS MHBeneficiariesby DiagnosticCategoryAntidepressantsAntipsychoticsAnti-AnxietyAgentsMoodStabilizingAgentsStimulantsMore thanOnePsychotropicDrugTypeNoPsychotropicDrugUseSchizophrenia 7,977 50% 93% 44% 13% 1% 69% 1%Major depression and affective psychoses 13,306 78% 49% 59% 14% 2% 72% 5%Other psychoses 1,090 51% 68% 43% 5% 1% 58% 7%Childhood psychoses 181 43% 45% 47% 4% 1% 44% 15%Neurotic & other depressive disorders 9,765 70% 24% 56% 3% 1% 53% 13%Personality disorders 453 62% 45% 52% 8% 2% 58% 13%Other mental disorders 536 45% 24% 40% 4% 1% 34% 24%Special symptoms or syndromes 595 58% 23% 49% 2% 1% 44% 24%Stress & adjustment reactions 3,692 62% 29% 50% 3% 2% 50% 20%Conduct disorders 723 48% 40% 46% 7% 1% 47% 18%Emotional disturbances 84 49% 32% 45% 2% 1% 42% 25%Hyperkinetic syndrome 184 53% 18% 36% 4% 30% 45% 16%No Diagnosis 107 60% 24% 41% 5% 2% 40% 22%Total 38,693 66% 49% 53% 9% 1% 62% 13%Notes: The percentages shown do not add to 100 percent because service users with a specific diagnosis may use more than one type of drug. Psychotropicdrugs are defined and grouped according to Multum prescription drug grouping software.The diagnostic category for each user was the beneficiary’s most frequent diagnosis category in the year.FFS mental health beneficiaries include all FFS beneficiaries who had one or more of the mental health diagnoses shown in this table as a primary diagnosis on atleast one Medicaid claim during <strong>1999</strong>, or who received a clearly identifiable mental health service during the year (inpatient psychiatric service for age 65+ or underage 22, or nursing facility mental health service for age 65+).Table8
TABLE 9PERCENT OF MEDICAID FFS MENTAL HEALTH BENEFICIARIES AGE 65 AND OLDER WHOUSED PRESCRIPTION PSYCHOTROPIC DRUGS,BY DIAGNOSTIC CATEGORY AND DRUG TYPE<strong>MASSACHUSETTS</strong>, CALENDAR YEAR <strong>1999</strong>Type of Psychotropic DrugDiagnostic CategoryNumber ofFFS MHBeneficiariesby DiagnosticCategoryAntidepressantsAntipsychoticsAnti-AnxietyAgentsMoodStabilizingAgentsStimulantsMore thanOnePsychotropicDrugTypeNoPsychotropicDrugUseSchizophrenia 2,403 44% 87% 42% 8% 0% 62% 4%Major depression and affective psychoses 6,138 76% 45% 54% 7% 1% 65% 6%Other psychoses 1,788 47% 51% 43% 1% 0% 47% 20%Childhood psychoses 9 33% 44% 44% 0% 0% 44% 33%Neurotic & other depressive disorders 5,805 66% 26% 58% 1% 0% 51% 12%Personality disorders 120 54% 42% 56% 3% 0% 56% 17%Other mental disorders 508 40% 41% 42% 2% 0% 40% 25%Special symptoms or syndromes 392 55% 34% 54% 1% 0% 49% 19%Stress & adjustment reactions 1,800 60% 29% 46% 1% 0% 45% 18%Conduct disorders 203 57% 50% 54% 0% 0% 55% 12%Emotional disturbances 3 33% 33% 33% 0% 0% 33% 33%Hyperkinetic syndrome 2 50% 0% 50% 0% 0% 50% 50%No Diagnosis 27 48% 44% 37% 0% 0% 44% 19%Total 19,198 63% 43% 52% 4% 0% 56% 14%Notes: The percentages shown do not add to 100 percent because service users with a specific diagnosis may use more than one type of drug. Psychotropicdrugs are defined and grouped according to Multum prescription drug grouping software.The diagnostic category for each user was the beneficiary’s most frequent diagnosis category in the year.FFS mental health beneficiaries include all FFS beneficiaries who had one or more of the mental health diagnoses shown in this table as a primary diagnosis on atleast one Medicaid claim during <strong>1999</strong>, or who received a clearly identifiable mental health service during the year (inpatient psychiatric service for age 65+ or underage 22, or nursing facility mental health service for age 65+).Table9