introduction to statistical methods in public health
introduction to statistical methods in public health introduction to statistical methods in public health
TITLEAUTHORADDRESS FORCORRESPONDENCE(incl. fax and email)KEYWORDSLEARNING OBJECTIVES(expected outcomes)MARK DIntroduction to Statistical Methods in PublicHealthLijana Zaletel-Kragelj, MD PhDInstitute of Public Health, Faculty of Medicine LjubljanaZaloška 4, 1000 Ljubljana, SLOVENIAe-mail: lijana.kragelj@mf.uni-lj.siStatistical methods, learning with comprehension, data materialand teaching toolsFor the series of modulesStatistical methods represent very important tool in public healthwork. As it is used more or less periodically, users frequentlymeet problems, especially those with less mathematicalbackground. Lack of general acquaintance with statisticalmethods most often results in a public health worker not able totranslate the results of an analysis into public health technicallanguage, which is usually followed by a complicatedexplanation which can be very hard to understand even for otherpublic health workers. Those for whoom the results are usuallymeant – decision makers or politicians - are generally even lessfamiliar with statistical methods. For the conclusions from publichealth studies and reports to be primarely understandable tothem, it is essential for public health worker to understand thetool he or she is using by himself. Therefore it is very importantto enable public health students the learning approach based oncomprehension of statistical methods.At the end of series of modules following the present one, thestudents should:- understand all principal statistical concepts starting from basicones,- understand and be able to use methods of descriptive statisticsin a proper way independently and self-reliantly,- understand the principles of statistical inference in details,- understand and be able to use majority of methods ofunivariate relationship analysis in a proper way independentlyand self-reliantly,- understand and be able to use principal methods ofmultivariate relationship analysis independently or with helpof a statistician.For the introductory moduleThe purpose of introductory module is to represent to teacher ofstatistical methods for use in public health the apparentlysuccessful way of teaching these methods in Slovenia which isbased on non-conventional distribution of teaching matter andlearning witx experience by usung precisely worked outexample.It is expected that teacher would study this module and decide touse the following modules or not regarding to abilities in his orher country.1
- Page 2 and 3: SYNOPSISTEACHING METHODSFor the ser
- Page 4 and 5: SPECIFICRECOMMENDATIONSASSESSMENTST
- Page 6 and 7: ROLE AND POSITION OF STATISTICAL ME
- Page 8 and 9: for more decades. However, for the
- Page 10 and 11: The main purpose of teaching public
- Page 12 and 13: 6. Step six - transfer of all previ
- Page 14 and 15: 2 BWEIGHT birth weight of a child (
- Page 16 and 17: STRUCTURE OF CONTENTS OF TEACHING M
TITLEAUTHORADDRESS FORCORRESPONDENCE(<strong>in</strong>cl. fax and email)KEYWORDSLEARNING OBJECTIVES(expected outcomes)MARK DIntroduction <strong>to</strong> Statistical Methods <strong>in</strong> PublicHealthLijana Zaletel-Kragelj, MD PhDInstitute of Public Health, Faculty of Medic<strong>in</strong>e LjubljanaZaloška 4, 1000 Ljubljana, SLOVENIAe-mail: lijana.kragelj@mf.uni-lj.siStatistical <strong>methods</strong>, learn<strong>in</strong>g with comprehension, data materialand teach<strong>in</strong>g <strong>to</strong>olsFor the series of modulesStatistical <strong>methods</strong> represent very important <strong>to</strong>ol <strong>in</strong> <strong>public</strong> <strong>health</strong>work. As it is used more or less periodically, users frequentlymeet problems, especially those with less mathematicalbackground. Lack of general acqua<strong>in</strong>tance with <strong>statistical</strong><strong>methods</strong> most often results <strong>in</strong> a <strong>public</strong> <strong>health</strong> worker not able <strong>to</strong>translate the results of an analysis <strong>in</strong><strong>to</strong> <strong>public</strong> <strong>health</strong> technicallanguage, which is usually followed by a complicatedexplanation which can be very hard <strong>to</strong> understand even for other<strong>public</strong> <strong>health</strong> workers. Those for whoom the results are usuallymeant – decision makers or politicians - are generally even lessfamiliar with <strong>statistical</strong> <strong>methods</strong>. For the conclusions from <strong>public</strong><strong>health</strong> studies and reports <strong>to</strong> be primarely understandable <strong>to</strong>them, it is essential for <strong>public</strong> <strong>health</strong> worker <strong>to</strong> understand the<strong>to</strong>ol he or she is us<strong>in</strong>g by himself. Therefore it is very important<strong>to</strong> enable <strong>public</strong> <strong>health</strong> students the learn<strong>in</strong>g approach based oncomprehension of <strong>statistical</strong> <strong>methods</strong>.At the end of series of modules follow<strong>in</strong>g the present one, thestudents should:- understand all pr<strong>in</strong>cipal <strong>statistical</strong> concepts start<strong>in</strong>g from basicones,- understand and be able <strong>to</strong> use <strong>methods</strong> of descriptive statistics<strong>in</strong> a proper way <strong>in</strong>dependently and self-reliantly,- understand the pr<strong>in</strong>ciples of <strong>statistical</strong> <strong>in</strong>ference <strong>in</strong> details,- understand and be able <strong>to</strong> use majority of <strong>methods</strong> ofunivariate relationship analysis <strong>in</strong> a proper way <strong>in</strong>dependentlyand self-reliantly,- understand and be able <strong>to</strong> use pr<strong>in</strong>cipal <strong>methods</strong> ofmultivariate relationship analysis <strong>in</strong>dependently or with helpof a statistician.For the <strong>in</strong>troduc<strong>to</strong>ry moduleThe purpose of <strong>in</strong>troduc<strong>to</strong>ry module is <strong>to</strong> represent <strong>to</strong> teacher of<strong>statistical</strong> <strong>methods</strong> for use <strong>in</strong> <strong>public</strong> <strong>health</strong> the apparentlysuccessful way of teach<strong>in</strong>g these <strong>methods</strong> <strong>in</strong> Slovenia which isbased on non-conventional distribution of teach<strong>in</strong>g matter andlearn<strong>in</strong>g witx experience by usung precisely worked outexample.It is expected that teacher would study this module and decide <strong>to</strong>use the follow<strong>in</strong>g modules or not regard<strong>in</strong>g <strong>to</strong> abilities <strong>in</strong> his orher country.1
SYNOPSISTEACHING METHODSFor the series of modulesThe series of modules covers follow<strong>in</strong>g subjects:1. Pr<strong>in</strong>ciples of <strong>statistical</strong> <strong>methods</strong>: <strong>statistical</strong> concepts, <strong>statistical</strong>describ<strong>in</strong>g of data, and <strong>statistical</strong> <strong>in</strong>ference2. Us<strong>in</strong>g <strong>statistical</strong> <strong>methods</strong>: pr<strong>in</strong>ciples of relationship analysis –univariate analysis, multivariate analysis, repeatedmeasurements, and non-parametric <strong>methods</strong>For the <strong>in</strong>troduc<strong>to</strong>ry moduleThe <strong>in</strong>troduc<strong>to</strong>ry module covers the pr<strong>in</strong>ciples of teach<strong>in</strong>g withcomprehension and description of <strong>methods</strong> used <strong>in</strong> Slovenia forteach<strong>in</strong>g the <strong>public</strong> <strong>health</strong> students <strong>statistical</strong> <strong>methods</strong>.CONTENTSFor the series of modulesMODULE 1: Introduction <strong>to</strong> <strong>statistical</strong> <strong>methods</strong> <strong>in</strong> <strong>public</strong> <strong>health</strong>SUBTOPIC 1: Pr<strong>in</strong>ciples of <strong>statistical</strong> <strong>methods</strong>MODULE 2: Statistical concepts and <strong>statistical</strong> describ<strong>in</strong>g of dataMODULE 3: Statistical <strong>in</strong>ferenceSUBTOPIC 2: Us<strong>in</strong>g <strong>statistical</strong> <strong>methods</strong>MODULE 4: Pr<strong>in</strong>ciples of relationship analysis – univariate analysisMODULE 5: Multivariate analysisMODULE 6: Repeated measurementsMODULE 7: Non-parametric <strong>methods</strong>For the <strong>in</strong>troduc<strong>to</strong>ry moduleROLE AND POSITION OF STATISTICAL METHODS IN PUBLICHEALTHPublic <strong>health</strong>, epidemiology and statisticsSTATISTICAL METHODS AS A TOOL IN DESCRIPTIVE AND ANALYTICEPIDEMIOLOGYAnalys<strong>in</strong>g the relationshipOBSERVED HEALTH-RELATED PHENOMENA AND RISK FACTORSDEPENDENCY AND CAUSALITYDependencyCausalitySIMPLE AND COMPLEX ANALYSIS OF THE RELATIONSHIPLEARNING STATISTICAL METHODS WITH EMPHASIS ONCOMPREHENSIONPROPOSAL FOR TEACHING STATISTICAL METHODS FOR USE INPUBLIC HEALTHTeach<strong>in</strong>g <strong>statistical</strong> <strong>methods</strong> <strong>in</strong> <strong>public</strong> <strong>health</strong> <strong>in</strong> SloveniaSEQUENCE OF TEACHING MATTERTEACHING METHODSDATA MATERIAL AND TEACHING TOOLSData materialTeach<strong>in</strong>g <strong>to</strong>olsSTUDYING MATERIALEVALUATION OF METHODS BY STUDENTSStructure of contents of teach<strong>in</strong>g modulesFor the series of modulesLECTURESActive discussion with students is recommended wheneverpossible, us<strong>in</strong>g simple blackboard or blank overheads is preferred<strong>in</strong> expla<strong>in</strong><strong>in</strong>g pr<strong>in</strong>ciples of <strong>methods</strong>, a huge amount of overheadsshould be avoided.PRACTICAL WORK2
Teach<strong>in</strong>g <strong>to</strong>ols - us<strong>in</strong>g a computer is essential. Recommendationsfor hardware equipment:- optimal number of computers for a teacher not assisted by anassist<strong>in</strong>g person is no more than 6,- maximal number of computers (teacher obliga<strong>to</strong>ry assisted byan assistant) is 10 – 12,- LCD projec<strong>to</strong>r is obliga<strong>to</strong>ry for demonstrat<strong>in</strong>g the <strong>methods</strong>,Recommendations for software equipment:- us<strong>in</strong>g an <strong>in</strong>ternationaly recognized <strong>statistical</strong> programme isoptimal (SPSS is recommended as it is very user friendly),- if not available the teacher shall use software at his or herdisposal but it should be a <strong>statistical</strong> programme of suitablequality,Teach<strong>in</strong>g approach - learn<strong>in</strong>g <strong>in</strong> small groups is recommendedRecommendations for compos<strong>in</strong>g a group:- optimal number recommended is two students chang<strong>in</strong>g at thecomputer,- maximal number is three,- one student per computer is not recommended as he or shecould be less familiar with work<strong>in</strong>g with a computer,Recommendations for us<strong>in</strong>g advantages of work<strong>in</strong>g <strong>in</strong> smallgroups:- the discussion <strong>in</strong>side groups is stimulated as well as discussionbetween groups,- also the comparison of results between students from differentwork<strong>in</strong>g units is stimulated, whenever possible,Data material - learn<strong>in</strong>g on clear and evident examples is alsoessentialRecommendations for choos<strong>in</strong>g data material:choos<strong>in</strong>g the data material from the students’ work<strong>in</strong>g practice isrecommended (data from national or regional surveys etc..),if no data material is available at the beg<strong>in</strong>n<strong>in</strong>g, the data materialused <strong>in</strong> modules follow<strong>in</strong>g the present one is at disposal,Supplementary material for studentsIt is recommended <strong>to</strong> prepare:short manual for work<strong>in</strong>g with the computer program <strong>to</strong> enablestudents work<strong>in</strong>g <strong>in</strong>dependently as much as possible,exercises for practical work based on data material used,study<strong>in</strong>g material necessary for the tasks which are <strong>to</strong> becalculated manually.3
SPECIFICRECOMMENDATIONSASSESSMENTSTUDENTS(type of exam<strong>in</strong>ation)OFFor the series of modules1. The whole teach<strong>in</strong>g materia could be taught <strong>in</strong> about 45 hours(based on the assumption that postgraduate students arefamiliar with most basic concepts of <strong>statistical</strong> <strong>methods</strong>) butmore is recommended (60 – 75 hours),2. The time for classical lectures is proposed <strong>to</strong> be shortened asmuch as possible and the time for active use of <strong>methods</strong>prolonged as much as possible,3. The theoretical background of every s<strong>in</strong>gle <strong>statistical</strong> methodis proposed <strong>to</strong> be placed just before us<strong>in</strong>g it <strong>in</strong> practice <strong>to</strong>enhance the effect of practical work,4. It is also recommended <strong>to</strong> put the lectures <strong>in</strong> a computer roomand <strong>to</strong> comb<strong>in</strong>e them with practical work.For the series of modules1. It is possible <strong>to</strong> assess the knowledge of practical use of<strong>methods</strong> dur<strong>in</strong>g the practical work itself, through mak<strong>in</strong>greports by students for each unit,2. It is possible <strong>to</strong> check the <strong>in</strong>termediate theoretical knowledgeand comprehension by short (5 – 10 m<strong>in</strong>utes) test-typeassessments at the beg<strong>in</strong>n<strong>in</strong>g or at the end of the practicalwork for each unit,3. At the end of the course there should be a global assessmentcomposed of:4. test-type assessment of theoretical knowledge,5. essay-type assessment of practical knowledge us<strong>in</strong>g acomplete <strong>statistical</strong> problem from description <strong>to</strong> <strong>in</strong>ferenceus<strong>in</strong>g appropriate <strong>statistical</strong> <strong>methods</strong> – it could be done on acomputer or on copies of the results made by a computerprogram.4
INTRODUCTION TO STATISTICAL METHODS INPUBLIC HEALTHCONTENTSROLE AND POSITION OF STATISTICAL METHODS IN PUBLIC HEALTHPublic <strong>health</strong>, epidemiology and statisticsSTATISTICAL METHODS AS A TOOL IN DESCRIPTIVE AND ANALYTIC EPIDEMIOLOGYAnalys<strong>in</strong>g the relationshipOBSERVED HEALTH-RELATED PHENOMENA AND RISK FACTORSDEPENDENCY AND CAUSALITYDependencyCausalitySIMPLE AND COMPLEX ANALYSIS OF THE RELATIONSHIPLEARNING STATISTICAL METHODS WITH EMPHASIS ON COMPREHENSIONPROPOSAL FOR TEACHING STATISTICAL METHODS FOR USE IN PUBLIC HEALTHTeach<strong>in</strong>g <strong>statistical</strong> <strong>methods</strong> <strong>in</strong> <strong>public</strong> <strong>health</strong> <strong>in</strong> SloveniaSEQUENCE OF TEACHING MATTERTEACHING METHODSDATA MATERIAL AND TEACHING TOOLSData materialTeach<strong>in</strong>g <strong>to</strong>olsSTUDYING MATERIALEVALUATION OF METHODS BY STUDENTSStructure of contents of teach<strong>in</strong>g modules5
ROLE AND POSITION OF STATISTICAL METHODS IN PUBLICHEALTHPUBLIC HEALTH, EPIDEMIOLOGY AND STATISTICSStatistical <strong>methods</strong> are important <strong>in</strong> all medical branches, thus also <strong>in</strong> <strong>public</strong> <strong>health</strong>. To putthese two terms <strong>in</strong> a relationship it is appropriate <strong>to</strong> def<strong>in</strong>e them, add<strong>in</strong>g one more which isput between them:1. Public <strong>health</strong> is def<strong>in</strong>ed as one of the efforts organized by society <strong>to</strong> protect,promote, and res<strong>to</strong>re the people’s <strong>health</strong>. It is the comb<strong>in</strong>ation of sciences, skills, andbeliefs that is directed <strong>to</strong> the ma<strong>in</strong>tenance and improvement of the <strong>health</strong> of all thepeople through collective or social actions [1]. One of these sciences also bee<strong>in</strong>g one ofimportant branches of medic<strong>in</strong>e science itself is epidemiology.2. Epidemiology is def<strong>in</strong>ed as the study of the distribution and determ<strong>in</strong>ants of <strong>health</strong>relatedstates or events <strong>in</strong> specified populations, and the application of this study <strong>to</strong>control of <strong>health</strong> problems [1]. Regard<strong>in</strong>g <strong>to</strong> the aim the epidemiology as a whole can besplit <strong>to</strong> more specific branches: descriptive epidemiology, analytic epidemiology,experimental epidemiology and evaluational epidemiology. Statistical <strong>methods</strong>represents one of the most powerful <strong>to</strong>ols <strong>in</strong> the hands of an epidemiologist.3. Statistics is def<strong>in</strong>ed as the science and art of collect<strong>in</strong>g, summariz<strong>in</strong>g and analyz<strong>in</strong>gdata that are subject <strong>to</strong> random variation [1]. It is represented by a huge set of different<strong>methods</strong> adequate for different situations.STATISTICAL METHODS AS A TOOL IN DESCRIPTIVE AND ANALYTICEPIDEMIOLOGYIt was already menthioned that epidemiology could be classified regard<strong>in</strong>g <strong>to</strong> the aim <strong>to</strong> fourma<strong>in</strong> branches. The first two - descriptive and analytic epidemiology as well as the<strong>in</strong>volvement of <strong>statistical</strong> <strong>methods</strong> <strong>in</strong> them it will be discussed here:1. Descriptive epidemiology is def<strong>in</strong>ed as activities <strong>to</strong> study occurrence of disease orother <strong>health</strong>-related characteristics <strong>in</strong> human population [1]. It is concerned <strong>in</strong> where,when and how frequent such phenomena are. The answers <strong>to</strong> these questions areobta<strong>in</strong>ed by the means of <strong>methods</strong> of descriptive statistics.2. Analytic epidemiology is def<strong>in</strong>ed as activities <strong>to</strong> exam<strong>in</strong>e associations, commonlyputative or hypothesized causal relationships. An analytic study is usually concerned withidentify<strong>in</strong>g or measur<strong>in</strong>g the effects of risk fac<strong>to</strong>rs, or is concerned with the <strong>health</strong>effects of specific exposure(s) [1]. In these activities the <strong>methods</strong> of analyticalstatistics are <strong>in</strong>volved.6
ANALYSING THE RELATIONSHIPBy the means of analytical <strong>statistical</strong> <strong>methods</strong> different aspects of association orrelationship between observed phenomenon and other characteristics of observedsubjects, seen as risk fac<strong>to</strong>rs for its occurrence are assesed. Therefore the appropriatename for the whole set of various procedures also would be relationship analysis.To make all considerations about <strong>statistical</strong> <strong>methods</strong> as a <strong>to</strong>ol for assess<strong>in</strong>g the type andstrenght of a relationship under observation easier some of concepts should be clarifyed.OBSERVED HEALTH-RELATED PHENOMENA AND RISK FACTORSThese two already used terms should be clarifyed first:1. Observed phenomenon - disease or other <strong>health</strong>-related condition frequently calledalso an outcome and2. Risk fac<strong>to</strong>r – a caracteristic (an aspect of behaviour or lifestyle, an environmentalexposure, an <strong>in</strong>born or iherited characteristic) which is on the basis of epidemiologicevidence known <strong>to</strong> be associated with <strong>health</strong>-related condition(s) considered important <strong>to</strong>prevent [1].DEPENDENCY AND CAUSALITYDependencyThe concept of dependency has different mean<strong>in</strong>g <strong>in</strong> epidemiology as it has <strong>in</strong> statistics <strong>in</strong>strict sense:− <strong>in</strong> epidemiology, the dependent variable is the manifestation or outcome whose variationis <strong>to</strong> be expla<strong>in</strong>ed by risk fac<strong>to</strong>rs− <strong>in</strong> statistics the dependent variable is the one predicted by a regression equationIn jargon the term “dependent” is rather loosely used. Frequently it is used <strong>in</strong> sense ofcausality.CausalityBy the def<strong>in</strong>ition [1] causuality is relat<strong>in</strong>g of causes <strong>to</strong> the effects they produce. Mostlyepidemiology is concerned of causuality. The phenomenon under observation is usuallyassigned the role of “effect” and the risk fac<strong>to</strong>rs thereof the role of "causes". Actuallycausality of the relationship is not as simple. It should be clearly stated that epidemiologicevidence of causality by itself is <strong>in</strong>sufficient <strong>to</strong> establish the causality <strong>in</strong> nature. The later isusually possible <strong>to</strong> be proved only by studies <strong>in</strong> different places which could be carried out7
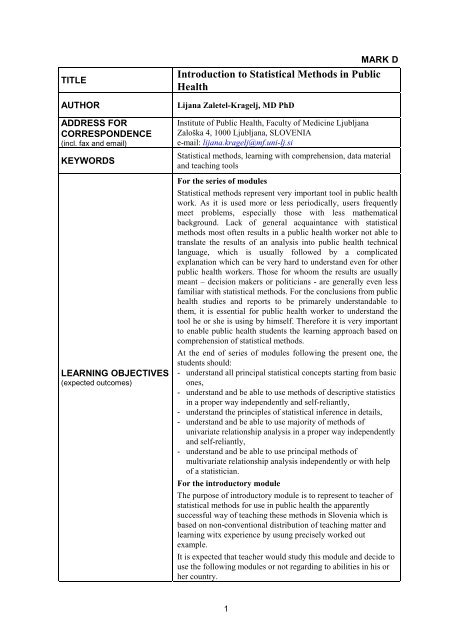
for more decades. However, for the <strong>statistical</strong> <strong>methods</strong> <strong>to</strong> be understandable, such sett<strong>in</strong>gup is very adequate. A picture (Figure 1) can offer additional help.C 1C 2C 3RISKOBSERVEDPHENOMENONC 5C 4FACTORSC 6»EFFECT«»CAUSES«Figure 1: Graphical representation of the sett<strong>in</strong>g up of the observed desease or other <strong>health</strong>related phenomenon - observed phenomenon or "effect" and characteristics ofobserved subjects - "causes" (C1 – C6) <strong>in</strong><strong>to</strong> a relationship, as a help at relationshipanalysis.SIMPLE AND COMPLEX ANALYSIS OF THE RELATIONSHIPIn analys<strong>in</strong>g the relationship between observed outcome and risk fac<strong>to</strong>rs two k<strong>in</strong>ds of<strong>methods</strong> could be used:1. Univariate <strong>statistical</strong> <strong>methods</strong> - the analysis of relationship of a s<strong>in</strong>gle risk fac<strong>to</strong>rwith an outcome2. Complex or multivariate <strong>statistical</strong> <strong>methods</strong> – the analysis of relationship ofseveral risk fac<strong>to</strong>rs with an outcome at a time8
It would be most appropriate <strong>to</strong> use multivariate <strong>statistical</strong> <strong>methods</strong> from the very beg<strong>in</strong>n<strong>in</strong>g,but these <strong>methods</strong> have several limitations connected with the number of observed subjectsand <strong>statistical</strong> features of "effects" and "causes". This way of perform<strong>in</strong>g the analysis is mostusually not possible <strong>to</strong> be carried out as the number of observations is rarely big enough. Somostly the univariate analysis of relationship of a s<strong>in</strong>gle "cause" with a "consequence" iscarried out, result<strong>in</strong>g <strong>in</strong> determ<strong>in</strong>ation of <strong>statistical</strong>ly the most important ones. Usually it isfollowed by multivariate <strong>methods</strong> afterwards.LEARNING STATISTICAL METHODS WITH EMPHASIS ONCOMPREHENSIONUsually all users of <strong>statistical</strong> <strong>methods</strong> with less mathematical background, specially periodicones, meet big problems. Maybe <strong>in</strong> medic<strong>in</strong>e these problems are even more outstand<strong>in</strong>g asmedical workers usually have less expressed abstract way of th<strong>in</strong>k<strong>in</strong>g. S<strong>in</strong>ce these <strong>methods</strong>represent very important <strong>to</strong>ol <strong>in</strong> researches <strong>in</strong> medic<strong>in</strong>e, specialy <strong>in</strong> <strong>public</strong> <strong>health</strong>, it is veryimportant <strong>to</strong> enable <strong>public</strong> <strong>health</strong> students the learn<strong>in</strong>g approach based on comprehensionof <strong>statistical</strong> <strong>methods</strong> not only us<strong>in</strong>g them as a “cook book”.For this aim <strong>to</strong> be atta<strong>in</strong>ed, learn<strong>in</strong>g must be approached with consideration. It isundoubtedly important:− the teach<strong>in</strong>g matter <strong>to</strong> be distributed logically and units should be smoothly associatedone <strong>to</strong> another;− not <strong>to</strong> use <strong>to</strong>o many equations or mathematical expressions, especially not <strong>in</strong>professions with less abstract way of th<strong>in</strong>k<strong>in</strong>g (<strong>in</strong> medic<strong>in</strong>e <strong>in</strong> particular);− <strong>to</strong> enable the students <strong>to</strong> use the <strong>methods</strong> <strong>in</strong> practice, mean<strong>in</strong>g transferr<strong>in</strong>g theemphasis from the lectures <strong>to</strong> practical work on an example (learn<strong>in</strong>g with experience);− <strong>to</strong> watch carefully all the time if the students are follow<strong>in</strong>g the explanation and practicaluse of the teach<strong>in</strong>g matter; the teacher must strive for not conclud<strong>in</strong>g a subject until it isaccepted by the majority of students;− <strong>to</strong> use new pedagogical approaches at lectur<strong>in</strong>g, for example work<strong>in</strong>g <strong>in</strong> smaller groups,learn<strong>in</strong>g with discussion etc., whenever possible;− <strong>to</strong> use adequate <strong>to</strong>ols, mean<strong>in</strong>g learn<strong>in</strong>g with the <strong>statistical</strong> program of good quality;nevertheless certa<strong>in</strong> calculations shall be carried out manually or partly manually,particularly where this shall be necessary for the procedure <strong>to</strong> be easier understandable;− students shall be proposed, if not supplied with, correspond<strong>in</strong>g study<strong>in</strong>g material.9
The ma<strong>in</strong> purpose of teach<strong>in</strong>g <strong>public</strong> <strong>health</strong> students <strong>statistical</strong> <strong>methods</strong> withcomprehension is for them <strong>to</strong> be able <strong>to</strong> have entire process of a <strong>public</strong> <strong>health</strong> research,from the def<strong>in</strong>ition of a problem as a start<strong>in</strong>g po<strong>in</strong>t, through collect<strong>in</strong>g the relevant data andanalys<strong>in</strong>g them, f<strong>in</strong>aly <strong>to</strong> <strong>in</strong>terpretation of the results of the analysis under control. This doesnot necessarily mean <strong>to</strong> do the entire process by themselves. Lack of general acqua<strong>in</strong>tancewith research <strong>to</strong>ols <strong>in</strong>clud<strong>in</strong>g <strong>statistical</strong> <strong>methods</strong> most often results <strong>in</strong> a <strong>public</strong> <strong>health</strong> worker,not be able <strong>to</strong> translate the results of an analysis <strong>in</strong><strong>to</strong> technical language of his or herprofession. This is usually followed by a very complicated <strong>in</strong>terpretations which can be veryhard <strong>to</strong> understand, specially <strong>to</strong> decision makers and polititians <strong>to</strong> whom the results are<strong>in</strong>tended for. In other words, teach<strong>in</strong>g <strong>statistical</strong> <strong>methods</strong> with comprehension means <strong>to</strong>make future <strong>public</strong> <strong>health</strong> workers <strong>to</strong> be able <strong>to</strong> speak the same language as statisticexperts, who are responsible for technical realisation of the <strong>methods</strong>.PROPOSAL FOR TEACHING STATISTICAL METHODS FOR USEIN PUBLIC HEALTHIn teach<strong>in</strong>g <strong>statistical</strong> <strong>methods</strong> <strong>in</strong> <strong>public</strong> <strong>health</strong> <strong>in</strong> Slovenia we try <strong>to</strong> follow the pr<strong>in</strong>ciples justdescribed as much as possible, specially at postgraduate level of education. It seems thiscould be the right way <strong>to</strong> atta<strong>in</strong> the aim already described.In follow<strong>in</strong>g paragraphs a short description of the teach<strong>in</strong>g process <strong>in</strong> our country ispresented. At the end of this <strong><strong>in</strong>troduction</strong> also the structure of teach<strong>in</strong>g modules is alsodescribed.TEACHING STATISTICAL METHODS IN PUBLIC HEALTH INSLOVENIASEQUENCE OF TEACHING MATTERThe longterm experiences show that the right sequence of teach<strong>in</strong>g matter is one of the keys<strong>to</strong> success. In Table 1 the way of distribution of taech<strong>in</strong>g matter we used is shown.10
Table 1: Proposal for distribution of <strong>statistical</strong> <strong>methods</strong> with regard <strong>to</strong> thematic wholes.ISTATISTICAL CONCEPTS ANDSTATISTICAL DESCRIBING OF DATAStatistical concepts− basic concepts;− concepts related <strong>to</strong> <strong>statistical</strong> activities− concepts related <strong>to</strong> <strong>statistical</strong> variables− concepts related <strong>to</strong> probability distributionsStatistical describ<strong>in</strong>g of data− present<strong>in</strong>g data− describ<strong>in</strong>g a distribution− summariz<strong>in</strong>g the distribution featuresPRINCIPLES OF STATISTICAL METHODSIIPRINCIPLES OFSTATISTICAL INFERENCETheoretical probability distributions− Normal distributionSampl<strong>in</strong>g distributions− pr<strong>in</strong>ciples of sampl<strong>in</strong>g distributions− sampl<strong>in</strong>g distribution of mean− sampl<strong>in</strong>g distribution of difference between two means___________________________________________________Statistical <strong>in</strong>ference techniques− confidence <strong>in</strong>tervals− test<strong>in</strong>g of hypothesesIPRINCIPLES OF RELATIONSHIP ANALYSISRelationship between two variables – univariate analysis− <strong>in</strong> case of two numerical variables (l<strong>in</strong>ear regression andcorrelation)− <strong>in</strong> case of two attributable variables (chi-square test,relative risk, odds ratio− <strong>in</strong> case of mixed variables (t-test for <strong>in</strong>dependentmeasurements, logistic regression)IIIREPEATED MEASUREMENTSTwo measurements− paired t-testMore than two measurements− analysis of variance for repeated measurementsUSING STATISTICAL METHODSIIMULTIVARIATE ANALYSISRelationship between more than two variables –multivariate analysis− <strong>in</strong> case of numerical dependent variable (multiple l<strong>in</strong>earregression, analysis of variance)− <strong>in</strong> case of b<strong>in</strong>ary attributable dependent variable (multipleb<strong>in</strong>ary logistic regression)−−IVNON-PARAMETRIC METHODSfor <strong>in</strong>dependent measurementsfor dependent (repeated) measurementsThe whole teach<strong>in</strong>g process is based on the relationship analysis which is situated centrally. Bythe means of the latter, teach<strong>in</strong>g starts. This is followed by construction of th<strong>in</strong>k<strong>in</strong>g from the mostsimple build<strong>in</strong>g blocs – basic concepts and <strong>methods</strong>, gradually <strong>to</strong> more complex ones. When thetechnique is absorbed we return <strong>to</strong> the relationship analysis. The realization of lessons is pr<strong>in</strong>cipallydesigned <strong>in</strong> follow<strong>in</strong>g steps:1. Step one – gett<strong>in</strong>g familiar with basic <strong>statistical</strong> concepts2. Step two – gett<strong>in</strong>g familiar with sample distributions and their mean<strong>in</strong>g <strong>in</strong> <strong>statistical</strong><strong>in</strong>ference3. Step three – gett<strong>in</strong>g familiar with techniques of <strong>statistical</strong> <strong>in</strong>ference us<strong>in</strong>g workedexamples4. Step four – transfer of basic pr<strong>in</strong>ciples of <strong>statistical</strong> <strong>methods</strong> <strong>to</strong> simple relationshipanalysis (univariate)5. Step five – extend<strong>in</strong>g the <strong>methods</strong> for simple relationship analysis <strong>to</strong> more complex ones,gett<strong>in</strong>g familiar with pr<strong>in</strong>ciples of multivariate relationship analysis11
6. Step six – transfer of all previous subjects <strong>to</strong> repeated measurements analysis7. Step seven – <strong><strong>in</strong>troduction</strong> of non-parametric <strong>methods</strong>Up <strong>to</strong> this time the first four steps were realized <strong>in</strong> all courses and the rema<strong>in</strong><strong>in</strong>g ones only <strong>in</strong>some of them.Such sequence imply one very important po<strong>in</strong>t of view <strong>to</strong> <strong>statistical</strong> <strong>methods</strong> – it does notrepresent classical <strong>statistical</strong> way of th<strong>in</strong>k<strong>in</strong>g <strong>in</strong> the sense of observ<strong>in</strong>g differences betweentwo groups of observed subjects. The students are for example represented that not onlyregression and correlation analysis are <strong>to</strong> analyse the relationship between two variables butalso the classical t-test is (<strong>in</strong> this test also two variables are <strong>in</strong>volved one of which be<strong>in</strong>g theobserved phenomenon – the outcome, and the other, the one divid<strong>in</strong>g the observed subjects<strong>in</strong><strong>to</strong> two groups – the risk fac<strong>to</strong>r).Based on our experiences, students also must be given enough time for basic concepts. Itis hard <strong>to</strong> say how much time would this take s<strong>in</strong>ce groups of <strong>public</strong> <strong>health</strong> students arediffer<strong>in</strong>g considerably. At the beg<strong>in</strong>n<strong>in</strong>g of s<strong>in</strong>gle course the groups of students mostly arepossible <strong>to</strong> be of very heterogeneous background knowledge. A good teacher shall be able<strong>to</strong> carry out the whole teach<strong>in</strong>g matter with no regard <strong>to</strong> the emphasis laid <strong>to</strong> <strong>in</strong>dividual partsof the subject.TEACHING METHODSFor successful outcome of teach<strong>in</strong>g process it is essential <strong>to</strong> use modern teach<strong>in</strong>g <strong>methods</strong>with emphasis on the active <strong>in</strong>volvement of students <strong>in</strong> the process. The approach oflearn<strong>in</strong>g with experience <strong>in</strong> small groups based on global worked example is used.In a group there are no more than three students with optimal number of two. Every s<strong>in</strong>glegroup of students, <strong>to</strong>gether with a computer, constitute one work<strong>in</strong>g unit. The students areas a rule distributed <strong>in</strong> such a way that at least one <strong>in</strong> a group is familiar with work<strong>in</strong>g on acomputer.This approach enables students <strong>to</strong> actively share their knowledge and help themselves<strong>in</strong>side each group. The discussion <strong>in</strong>side groups is therefore stimulated as well as discussionbetween groups. Also the comparison of results between work<strong>in</strong>g units, whenever possible,is stimulated.DATA MATERIAL AND TEACHING TOOLSData material12
For already several years at teach<strong>in</strong>g <strong>statistical</strong> <strong>methods</strong> <strong>in</strong> <strong>public</strong> <strong>health</strong> <strong>in</strong> Slovenia datacollection which enables learn<strong>in</strong>g such <strong>methods</strong> <strong>in</strong> quite a pleasant way has been used.These are the data collect<strong>in</strong>g with<strong>in</strong> the Per<strong>in</strong>atal Informational System of Slovenia (PISS)[2], which is considered <strong>to</strong> be one of the permanent collections of medical data of thehighest quality with the many years' tradition. It was started <strong>in</strong> 1987 when collection of datastarted on an uniform form <strong>in</strong> all Slovene maternity hospitals.Data material for teach<strong>in</strong>g is only a small piece out of the whole collection PISS, preparedespecially for this purpose. Safeguard of personal data is assured so that all personalidentifica<strong>to</strong>rs have been removed, and moreover only the data are selected from the wholecollection which shall be used for the teach<strong>in</strong>g purpose. Special attention was paid <strong>to</strong> <strong>in</strong>cludesuch data which are possible <strong>to</strong> play the role of the "effect" as well as the data which canplay the role of "cause". Also they are chosen <strong>to</strong> have diverse <strong>statistical</strong> characteristics as <strong>to</strong>be able <strong>to</strong> represent the majority of <strong>statistical</strong> <strong>methods</strong>.The basic data material for all <strong>statistical</strong> activities is composed of 6356 <strong>statistical</strong> units,represent<strong>in</strong>g the model of a population. For teach<strong>in</strong>g different <strong>statistical</strong> <strong>methods</strong>, samples ofvarious size are then randomly selected from the population database. The smallest samplesis composed of 30 units and the largest one of 800 units. The students shall select some ofsuch samples from the population while perform<strong>in</strong>g practical work by themselves, and othersshall be prepared by the teacher. First ones are, on pr<strong>in</strong>ciple, different at each work<strong>in</strong>g placeand shall be, at the end of the correspond<strong>in</strong>g exercise, deleted by the students or by theteacher. Others are the same for all work<strong>in</strong>g places, constantly present there and are usedfor many times. Data material is composed of the follow<strong>in</strong>g permanent databases:1. Population database2. Database with a sample of 100 units – ma<strong>in</strong> database for teach<strong>in</strong>g pr<strong>in</strong>ciples of <strong>statistical</strong><strong>methods</strong>3. Database with a sample of 500 units – additional database for teach<strong>in</strong>g pr<strong>in</strong>ciples of<strong>statistical</strong> <strong>methods</strong>4. Database with a sample of 800 units – ma<strong>in</strong> demonstrational database and ma<strong>in</strong>database for teach<strong>in</strong>g multivariate <strong>statistical</strong> <strong>methods</strong>Notwithstand<strong>in</strong>g the number of units <strong>in</strong> a s<strong>in</strong>gle database, all databases are <strong>in</strong>clud<strong>in</strong>g thesame <strong>statistical</strong> variables, description of which is presented <strong>in</strong> Table 2.Table 2: Description of variables, their values and codes <strong>in</strong> basic data set for teach<strong>in</strong>g<strong>statistical</strong> <strong>methods</strong> <strong>in</strong> <strong>public</strong> <strong>health</strong> <strong>in</strong> Slovenia.COLUMN IN SHORT NAME OF A INFORMATION THE VARIABLE IS GIVINGA DATA SET VARIABLEABOUT1 IDN unit identification numberVARIABLE VALUES AND THEIRCODES IN DATA SET13
2 BWEIGHT birth weight of a child (weight <strong>in</strong> grammes)3 SEX child sex 1 = boy2 = girl4 GESTAGE gestational age of a child (age <strong>in</strong> weeks of pregnancy)5 MOTHAGE age of mother at delivery (age <strong>in</strong> years)6 SMOKING mother’s smok<strong>in</strong>g habits dur<strong>in</strong>g pregnancy 0 = no1 = <strong>to</strong> 10 cigarettes/day2 = 10 cigarettes or more/day7 HYPIRUT hyperactivity of uterus dur<strong>in</strong>g pregnancy 0 = no1 = yes8 HBP higher blood pressure dur<strong>in</strong>g pregnancy 0 = no1 = yes9 MEDVIT tak<strong>in</strong>g vitam<strong>in</strong>e preparations dur<strong>in</strong>g pregnancy 0 = no1 = yes10 MEDFE tak<strong>in</strong>g iron preparations dur<strong>in</strong>g pregnancy 0 = no1 = yes11 MEDAB tak<strong>in</strong>g antibiotics dur<strong>in</strong>g pregnancy 0 = no1 = yesWith the purpose of teach<strong>in</strong>g, first of all representation of mean<strong>in</strong>g of the reduction of an<strong>in</strong>formation for the purpose of analysis, values of some basic <strong>statistical</strong> variables stated <strong>in</strong>Table 2, have been changed (merg<strong>in</strong>g of values). This resulted <strong>in</strong> new variables which areadded <strong>in</strong> the databases follow<strong>in</strong>g the basic ones. The values of the same are described <strong>in</strong>Table 3.Table 3: Description of new variables (transformation of variables from basic data set) andtheir values and codes <strong>in</strong> data material for teach<strong>in</strong>g <strong>statistical</strong> <strong>methods</strong> <strong>in</strong> <strong>public</strong><strong>health</strong> <strong>in</strong> Slovenia.COLUMN INA DATA SETSHORT NAME OF AVARIABLEINFORMATION THE VARIABLE IS GIVINGABOUTVARIABLE VALUES AND THEIR CODESIN DATA SET12 LBW low birth weight 0 = no (BWEIGHT 2501 grammes or more)1 = yes (BWEIGHT <strong>to</strong> <strong>in</strong>clud<strong>in</strong>g 2500grammes)13 SMOYES mother smok<strong>in</strong>g dur<strong>in</strong>g pregnancy 0 = no (SMOKING = 0)1 = yes (SMOKING 1 or more)14 PRETERM preterm delivery 0 = no (GESTAGE <strong>to</strong> <strong>in</strong>clud<strong>in</strong>g 36 weeks)1 = yes (GESTAGE 37 weeks or more)On this data most of <strong>statistical</strong> <strong>methods</strong> could be presented <strong>in</strong> an obvious way as well asnumerous possible traps of their missuse.14
Teach<strong>in</strong>g <strong>to</strong>olsAdequate equipment is also very important for teach<strong>in</strong>g <strong>statistical</strong> <strong>methods</strong> <strong>in</strong> a propermanner, which is carried out mostly by the means of a computer with a <strong>statistical</strong> program ofsuitable quality.At the University of Ljubljana, the <strong>statistical</strong> program SPSS (Statistical Package for SocialSciences) has been used for this purpose for already a few decades. At the beg<strong>in</strong>n<strong>in</strong>g, it waspossible <strong>to</strong> be used only on ma<strong>in</strong> university computer, however for the last few years, theUniversity has hired the licence <strong>to</strong> enable the distribution of the program with<strong>in</strong> its membersunder favourable conditions for each personal computer. Two ma<strong>in</strong> purposes are soachieved: a program of good quality is used with<strong>in</strong> the University, enabl<strong>in</strong>g the results <strong>to</strong> becompared with<strong>in</strong> the university and as this program is widely spread also enabl<strong>in</strong>g the results<strong>to</strong> be compared <strong>to</strong> other countries.However, whenever it is necessary for easier understand<strong>in</strong>g of <strong>methods</strong>, the program canbe supplemented by us<strong>in</strong>g a calcula<strong>to</strong>r and <strong>statistical</strong> tables.STUDYING MATERIALStudy<strong>in</strong>g material prepared for students, is composed of:1. A short manual for work<strong>in</strong>g with the SPSS program, so that they were able <strong>to</strong> startwork<strong>in</strong>g by themselves with a program from the very beg<strong>in</strong>n<strong>in</strong>g;2. Short summary of the subject, which was not <strong>in</strong>tended as be<strong>in</strong>g the only source of<strong>statistical</strong> theory for the students, but <strong>to</strong> help them direct<strong>in</strong>g their flow of th<strong>in</strong>k<strong>in</strong>g and as ahelp with practical work;3. Collection of exercises for practical work4. Copies of the ma<strong>in</strong> results of the SPSS program, so that the students were able <strong>to</strong> markdown their comments and explanations of pr<strong>in</strong><strong>to</strong>uts for help<strong>in</strong>g them at study<strong>in</strong>g;5. Advised textbook for deepen<strong>in</strong>g their theoretical knowledge, which could be f<strong>in</strong>d <strong>in</strong> aCentral Library of Faculty of Medic<strong>in</strong>e or bought for a reasonable price.EVALUATION OF METHODS BY STUDENTSAll generations of students were asked <strong>to</strong> evaluate the teach<strong>in</strong>g <strong>methods</strong>. With no exeptionthe <strong>methods</strong> described above were positively evaluated. Almost at the conclusion of eachcourse, students declared that after the course <strong>statistical</strong> <strong>methods</strong> were moreunderstandable <strong>to</strong> them and they were no more afraid of us<strong>in</strong>g them.15
STRUCTURE OF CONTENTS OF TEACHING MODULESThe teach<strong>in</strong>g material which is offered as a content under <strong>to</strong>pic “Statistical <strong>methods</strong>” iscomposed from series of modules <strong>in</strong> which <strong>statistical</strong> <strong>methods</strong> are distributed <strong>in</strong> the samemanner as demonstrated <strong>in</strong> Table 1 - <strong>in</strong><strong>to</strong> two big themes/sub<strong>to</strong>pics and the units/modulesthereof, all of them follow<strong>in</strong>g the <strong>in</strong>troduc<strong>to</strong>ry module:MODULE 1: Introduction <strong>to</strong> <strong>statistical</strong> <strong>methods</strong> <strong>in</strong> <strong>public</strong> <strong>health</strong>SUBTOPIC 1: Pr<strong>in</strong>ciples of <strong>statistical</strong> <strong>methods</strong>MODULE 2: Statistical concepts and <strong>statistical</strong> describ<strong>in</strong>g of dataMODULE 3: Statistical <strong>in</strong>ferenceSUBTOPIC 2: Us<strong>in</strong>g <strong>statistical</strong> <strong>methods</strong>MODULE 4: Pr<strong>in</strong>ciples of relationship analysis – univariate analysisMODULE 5: Multivariate analysisMODULE 6: Repeated measurementsMODULE 7: Non-parametric <strong>methods</strong>Each module except the <strong>in</strong>troduc<strong>to</strong>ry one is go<strong>in</strong>g <strong>to</strong> be composed of:− short summary of the subject covered by the unit− exercises for practical work− list of data files for practice− teach<strong>in</strong>g material necessary for the tasks which are foreseen <strong>to</strong> be calculated manually− copies of the results of analysis carried out by the means of the SPSS program on asample of 800 unitsThe follow<strong>in</strong>g is not <strong>in</strong>cluded:− short manual for work<strong>in</strong>g with the SPSS program s<strong>in</strong>ce we decided that not all users ofthe modules shall have this program at disposal or that they shall use software at theirdisposal− textbook suggestion for deepen<strong>in</strong>g theoretical knowledge, which shall be advised byeach teacher accord<strong>in</strong>g <strong>to</strong> his experiences and with regard <strong>to</strong> the textbook’s availability <strong>in</strong>the countryAs the author of these modules I declare that the teach<strong>in</strong>g method and material wasdevelopped by myself dur<strong>in</strong>g my work<strong>in</strong>g as a teach<strong>in</strong>g assistant at Institute of biomedical<strong>in</strong>formatics of Faculty of medic<strong>in</strong>e <strong>in</strong> Ljubljana. Now it is used also at Institute for <strong>public</strong>16
<strong>health</strong> of the same faculty, where I am work<strong>in</strong>g at the present. Also I declare, that the only<strong>in</strong>tention of publish<strong>in</strong>g this material is <strong>to</strong> present one of possible <strong>methods</strong> for teach<strong>in</strong>g<strong>statistical</strong> <strong>methods</strong>, apparently successful one and not <strong>in</strong> any case <strong>to</strong> publish <strong>statistical</strong>theory. The later is very good described <strong>in</strong> numerous <strong>statistical</strong> textbooks.17


