WATER BALANCE MODEL TO PREDICT CLIMATE ... - IWRA
WATER BALANCE MODEL TO PREDICT CLIMATE ... - IWRA
WATER BALANCE MODEL TO PREDICT CLIMATE ... - IWRA

Create successful ePaper yourself
Turn your PDF publications into a flip-book with our unique Google optimized e-Paper software.
13th World Water Congress, Montpellier, FranceDomaine de Lavalette - 859 rue Jean-François Breton – 34093. MontpellierCEDEX 5 - France<strong>WATER</strong> <strong>BALANCE</strong> <strong>MODEL</strong> <strong>TO</strong> <strong>PREDICT</strong> <strong>CLIMATE</strong> CHANGE IMPACTS INTHE <strong>WATER</strong>SHED EPITÁCIO PESSOA DAM– PARAÍBA RIVER - BRAZILJ. D. Galvíncio a ; M. S. B. Moura b and F. A. S. Sousa ca Department of Geographic Sciences, Center of Philosophy and Human Sciences, FederalUniversity of Pernambuco, P. O. Box 7308, Recife, PE, 50670-900, Brazil, Phone/Fax Numbers+55 81 2126 8277, E-mail address: josicleda.galvincio@ufpe.brbCompany Brazilian of the Resourches Agropecuary, Centre of research of thesemi-árid, Petrolina-Pernambuco, Brazil. magna@cpatsa.embrapa.brc Academic Unit of Atmospheric Sciences, Center of Technology and Natural Resources,Federal University of Campina Grande, Campina Grande, PB, Brazil. fassis@dca.ufcg.edu.brABSTRACTClimatic change has great implications for hydrological cycle and water resourcesplanning. In order to assess this impact, a semi-distributed monthly water balance modelwas proposed and developed to simulate and predict the hydrological processes. GIStechniques were used as a tool to analyze topography, river networks, land-use, humanactivities, vegetation and soil characteristics. The model parameters were linked to thesebasin characteristics by regression and optimization methods.The model development will also be used to obtain an appreciation of the processcontrols of water balance in large heterogeneous catchments in semi-arid climates.The semi-arid regions, such as Taperoá and Caraúbas River basins in State Paraíba –Brazil the runoffs of these basins are small or even zero during dry season (from Aug. toJan) and are very sensitive to temperature increase and rainfall decrease. Results of thestudy also indicated that runoff is more sensitive to variation in precipitation than toincrease in temperature. Climate change challenges existing water resourcesmanagement practices by additional uncertainty. Integrated water resourcesmanagement will enhance the potential for adaptation to change.Key-words: Climatic change; hydrological cycle, Semi-arid; Paraíba River-Brazil1. IntroductionGlobal climatic change caused by growing atmospheric concentration of carbondioxide and other trace gases has become evident (IPCC, 1995;Houghton et al., 2001;Kamga, 2001). Climate change or its increased variability is expected to alter the timingand magnitude of runoff. As a result it has important implications for existing waterresources systems as well as for future water resources planning and management. Forinstance, under the climate change in recent years, the imbalance between water supplyand water demands has been increasing, which has given rise to great attention from
oth the relevant authorities and the general public to water resources planningprograms. Hence, urgent action is required for understanding and solving potentialwater resources problems for human’s existence and well-being, especially, quantitativeestimates of hydrological effects of climate change are essential (Guo et al., 2002).Currently there are many different monthly water balance models and manyresearches in this field have been intensively conducted. In the 1940s and 1950s,Thornthwaite and Mather (1955) developed a set of deterministic monthly waterbalance models, in which only two parameters were used. In developing an index ofmeteorological drought, Palmer (1965) suggested a model that divides the soil moisturestorage into two layers. In 1981, Thomas proposed a four parameter abcd water balancemodel. Alley (1984) reviewed and examined the Thornthwaite-Mather models, thePalmer (1965) model, and the Thomas (1981, 1983) abcd models in considerable detail.He concluded that predication erros were relatively similar among these models. Gleick(1987) developed a monthly water balance model specifically for climate impactassessment and addressed the advantages of using water balance type models in pratice.In the 1990s, more monthly water balance models were developed for stunding theimpact of climate change on the hydrological balance and for general water resourcesplanning and management (Mimikon et al., 1991; Vandewiele et al.,1992; Guo, 1995;Guo and Yin, 1997; Panagoulia and Dimou, 1997; Xu and Singht, 1998; Xiong andGuo, 1997,1999).In 2001, Jothityangkoon et al., examined the process controls on water balanceat the annual, monthly and daily scales. Asystematic “downward” approach for theformulation of models of appropriate complexity is presented based on an investigationof the climate, soil and vegetation controls on water balance. The overall conclusion isthat in this semi-arid catchment, spatial variability of soil depths apper to be the mostimportant control on runoff variability at all time and space scales, followed by thespatial variability of climate and vegetation cover.In 2006, Galvíncio and Sousa, superficial water balance developed at EpitácioPessoa river basin, in the state of the Paraíba-Brasil. In this study the authorsdemonstrated the impact of climate, vegetation, and topography of land use in therunoff. The model developed responded very well to these variables.In 2007, Galvíncio and Sousa, evaluated the performance of the water balancemodel developed for years of El Nino and La Nina in the sub-basin of Caraúbas. Theauthors also concluded that the water balance model developed was able to makeestimates of daily discharges, for years of La Niña, El Niño moderate and normal years.For the purpose of water resources assessment and study of climate changeimpacts, a water balance model was proposed and developed in this paper to simulateand predict the hydrological process and water resources in the Epitácio Pessoa –Paraíba river - Brazil watershed. GIS techniques were used as a tool to analyzetopography, river networks, land-use, human activities, vegetation and soilcharacteristics.2. Material and methods2.1 Region StudiedThe waters of the Epitácio Pessoa river basin it flows for the Epitácio Pessoa dam,known as Boqueirão dam. This river basin is geographically located in the center of anarea, composed by a fragmented mountain range. The water contribution to the damcomes from the Upper Paraíba subbasin and Taperoá subbasin. The courses of naturalwaters that benefit the soil and the agricultural production are: Paraíba river, and thestreams: Marinho Velho, Perna, Canudos, Ramada, Relva and Feijão. According to the
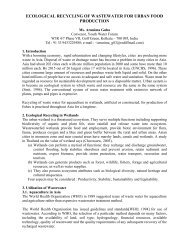
50-5-10-15-20-25-30-70 -65 -60 -55 -50 -45 -40 -35Executive Agency and Water Administration of the Paraíba state - AESA, the EpitácioPessoa dam has volume capacity of 411,7x10⁶ cubic meters of water. The Fig. 1 showsthe Epitácio Pessoa river basin location.- 7- 7 . 2- 7 . 4- 7 . 6- 7 . 8- 8BRASIL- 8 . 2-37.2 -37 -36.8 -36.6 -36.4 -36.22.1.1 Climate, hydrology and soilFigure 1. Location of the Epitácio Pessoa river basinThe river basin in investigation is formed by rocks of the precambrian period.The main soil in the Paraíba sub-basins and Taperoá is the polish no-calcic of littledepth, on whole existent crystalline. The soils of these sub-basins are almostimpervious.In the semiarid of the Northeast of the Brazil, the precipitated annual total, onaverage, is from 520 to 660 mm. This is the same amount that precipitates in Europeancities, for instance, Berlin and Paris, but nobody speech of disastrous droughts in thosecities. The difference between the European rainfall and of the semiarid region is theevaporation rate, that here is high, besides rainfall irregularities relative to space-time.Those are the causes that control the quantity of water that it will be to people'sdisposition, animals and plants.The temperatures in the semiarid are high during whole the year because it isplaced close to the Equator, and register strong winds and low air humidity. Theseatmospheric variables contribute for high evaporative rates. Case a dam is not deepenough; it will empty in few months after the rainfall period. The water of the rain thatinfiltrates in the terrain is absorbed in part, and protected of the evaporation. Afterweeks, and until months, of strong rainfall, the plants roots can still get the necessaryhumidity.The river basin hydrography is poor because of the rainfall absence in the longperiod. Its rivers and lakes are irregular and with intermittent characteristics. Somegeneral features that characterize the basin are: low cultures productivity, fewer choicesof cultivations; little agricultural technology, absence of soil conservation, low use ofnatural resources, limited and irregular water resources disponibility and naturalpreservation areas limited. Those features are of fundamental importance to assure thefarmers' survival, in a region subject to drought. In the Brazilian semiarid, the
widespread cattle are the main activity; the great owner accumulates stocks, when theweather is favorable. In otherwise, the owner transfers the animals for more favorableareas. On other hands, the small producer practices the subsistence agriculture,producing: corn, bean and rice. Those cultures represent the main sources of income andfood for the rural community.2.2 Software and dataFor accomplishment of the tasks of this study were necessary the materialsfollowing: satellite image of the Landsat TM-5, 1999 October 17, 215 orbit, 65 point;terrain elevation data with resolutions of 1.0 kilometer and 90 meters.The Supervision of the Northeast for Development - SUDENE and ExtraordinarySecretariat of Environment, Water Resources and Mineral - SEMARH of the Paraíbastate supplied the data of annual rainfall, monthly and daily of 23 gauges, spread in theriver basin studied, from 1973 to 1990 period. In the SEMARH were still obtained theevaporation data, estimated by the program of Soil Humidity Control. This task wasperformed by the partnership of the Paraiba state Government and Space Research'sNational Institute - INPE.The streamflows data were obtained in the National Agency of Water (ANA)and in the Civil Engineering Department, Federal University of Campina Grande -UFCG, from 1973 to 1990 period. Those data are natural streamflows, free of changesprovoked by hydraulic systems such as bridges and dams. The ANA did do consistenceanalysis in them.2.3 MethodologyThe main steps to developing this work were: treatment for the terrain elevationdata; to get the physics characteristics of the river basin, based on terrain elevation datawith resolutions of 1.0 kilometer and 90 meters; vegetal cover fraction, using satelliteimage; development and application of the water balance model for to estimate thesuperficial runoff for inside the Epitácio Pessoa dam.2.3.1 Vegetal coverFor to characterize the vegetation, Geographical Information Systems tools wereused. This characterization is estimated by the NDVI and by the vegetal cover fractionof the river basin in study, based on images of the satellite Landsat - TM 5. Accordingto (Gutman and Ignatov, 1998) can be written as:0 )/( NDVI − )Vfrac = ( NDVI − NDVI∞ NDVI(1)0where NDVI0, NDVI and NDVI∞are the minimum value, the maximum value, and theaverage of the vegetal index, respectively, in each grid point.Water balance model for the Caraúbas sub-basins and Poço de PedrasTo estimate the superficial runoff for the Caraúbas sub-basins and Poço dePedras, the model was developed based on identification and in the hydrology processesquantification. The form of the model is similar to the proposed by (Jothityangkoon etal., 2001, 2003; Galvíncio and Sousa, 2005, 2006, 2007). The Caraúbas control points,
and Poço de Pedras were chosen because of streamflows time series recent. Besides ofthis, the drainage areas represent great part of the areas of the Paraíba sub-basins andTaperoá, upstream of those control points.The information obtained by terrain elevation data such as: subbasin terraininclination, stream length and substream, areas, and the vegetal cover fraction were usedin the adjustment of the water balance model. The Fig. 2 displays the stream gaugelocations of Caraúbas, Poço de Pedras and Boqueirão de Cabaceiras.-7-7.2-7.4Poço de PedraBoqueirão de Cabaceiras-7.6Caraúbas-7.8-8-8.2-37.2 -37 -36.8 -36.6 -36.4 -36.2Figure 2. Stream gauge locationsThe superficial runoff is influenced by several causes that can facilitate or not itshappening. Those causes can be of climatic nature, related to rainfall and theevaporation or related to the physical characteristic of the river basin. The modeldeveloped in Galvíncio and Sousa (2006) was based on the mass conservationprinciples. Initially, was considered the rainfall variation, because is the more importantclimatic variable for the superficial runoff. Soon after, the runoff was separated in twofundamental parts: superficial runoff and subsuperficial. The potentialevapotranspiration was divided in surface evaporation and in plants transpiration. Allmethodology used in the water balance procedure can be seen in Galvíncio (2005).2.3.2 Water balance equationsThe Eq. (1) was proposed to estimate the physical processes on river basin:ds( t)/dt= p(t)−q( t)−q( t)−e( t)−e( t)(1)sssebvwhere p (t)is the intensity of the rain (mm), q se(t)is the superficial runoff rate or waterds ( t)excess after soil saturation, is the water volume variation stored in the soil, qssisdtthe subsuperficial drainage, (t)is the evaporation rate in the soil without vegetation,e band e v(t)is the rate of vegetal transpiration. The subsuperficial runoff in the Eq. (1) isdescribed as function of the soil storage water:q = ( s − s ) / t se s > s(2)ssfcf
q = 0 se s
2.4 Model parametersThe parameters of the monthly model are classified in the categories that follow:topographical D , φ , fc, L , Ksand vegetal M , kv. Here, the results will be presentedas time series with intraannual variability of the superficial runoff.2.5 Criteria to evaluate the modelIn this study were used two criteria to select the best estimative to model. The firstcriteria adopted was to evaluate the response of the model using the Nash-Sutcliffecoefficient. The second consists to obtain the accounted for variance using thedetermination coefficient (R2). The Nash-Sutcliffe (NS) coefficient efficiency is givenas (Nash and Sutcliffe, 1990):NS =22[ Q − Q)− ( Q − ˆi Qi) ]/∑∑ ∑ ( Qi−2i )(11)( Qwhere Qiand Qˆ iare observed and estimated streamflows, respectively, Q is meanstreamflow observed. The determination coefficient (R2) is given as the squarecorrelation coefficient. It estimates the critical variation common between variables.2.6 Scenarios climate changeBased on the hypothetical scenarios (combining temperature increase ordecrease of 1, 2 and 3 0 C with precipitation changes of -100, -50, -25, 0, 25, 50, 100%),the sensitivity of hydrological and water resource systems variables to global warmingare investigated in the Epitácio Pessoa watershed. The water balance model was used tosimulate monthly runoff and soil moisture for these sub-basins or basins under differentclimatic conditions.3. Results3.1 The runoff distributed in Epitácio Pessoa watershedThe Epitácio Pessoa watershed is divided into 2 sub-basins. In the Caraúbas andTaperoá sub-basins. Figs. 3 and 4 show the distribution of runoff in the watershedEpitácio Pessoa dam.
Mean monthly Q/Mean annual P0,0250,020,0150,010,00501 2 3 4 5 6 7 8 9 10 11 12MonthsSimulatedObserved in the periodfrom 1973 a 1990Figure 3 - Simulated (dash line) and observed (solid line) runoff in the watershedEpitácio Pessoa damDialy discharge (m 3 /s)250200150100500SimulatedObserved in Caraúbas and Poço de Pedras0 20 40 60 80 100Time percentage of streamflow equal or exceededFigure 4 – Simulated (dash line) and observed (solid line) runoff in the watershedEpitácio Pessoa dam3.2 Sensitivity of runoff to climate changeBased on the hypothetical scenarios the sensitivity of hydrological and waterresource systems variables to global warming are investigated in the Epitácio Pessoawatershed.Table 1 shows that temperature increases of 1 0 C combined with 25% change inthe expected precipitation is likely to result in runoff change from 0,66 to -0,3. If theprecipitation is unchanged and temperature increases from 1 to 3 0 C, the runoff change
will decrease from 0,978 to 0,92 the criterion NASH. From Table 3 it is show that therunoff is more sensitive to precipitation variation than to temperature increase. As amatter of fact, IPCC report (WMO and UNEP, 2001) has found the projected changes inprecipitation.Table 1 – The sensitivity of runoff to temperature change (∂T) and precipitation change(∂P)(∂P)(∂T) -50 -25 0 25 50-3 -0,06 0,74 0,973 -0,59 -5,4-2 -0,08 0,71 0,974 -0,51 -5,23-1 -0,1 0,69 0,976 -0,42 -5,020 -0,127 0,66 0,979 -0,3 -4,751 -0,15 0,62 0,95 -0,18 -4,42 -0,17 0,58 0,94 -0,05 -4,113 -0,19 0,54 0,92 0,09 -3,7The Figure 5 shows the runoff change in relation the percentage of precipitationchange. When the precipitation increases 50% of the value of the runoff almost 600%increase. When the precipitation decreases 50% the runoff will be zero. Figure 6 showsthat the decrease of 50% of the precipitation E basta a precipitação diminuir 50% arunoff será zero. The Figure 6 show que a diminuição de 50% da precipitation therunoff change increased em torno de 40%. Se a temperatura aumentar 1, 2 and 3 0 C avazão diminuirá em tonro de 2, 3 and 5%, respectivamente.When precipitation increases 50% of the value of the flow reaches almost 600%increase. When the precipitation decrease 50% to runoff will be zero. Figure 6 showsthat the decrease of 25% of the precipitation the runoff will decrease 40%. If thetemperature increase 1, 2 and 3 0 C the runoff decrease 2, 3 and 5%, respectively.runoff change2001000-100-200-300-400-500-600-50 -25 0 25 50Percentage of precipitation changeT-3T-2T-1TT+1T+2T+3Figure 5 – Relation percentage of precipitation change and runoff change
unoff change120100806040200-20-40-60-80-25 0 25Percentage of precipitation changeT-3T-2T-1TT+1T+2T+3Figure 6 – Relation percentage of precipitation change and runoff change4. ConclusionThe runoff is more sensitive to variation in precipitation than to increase intemperature. Climate change challenges existing water resources management practicesby additional uncertainty. Integrated water resources management will enhance thepotential for adaptation to change.5.ReferencesAlley, W. M., 1984. On the treatment of evapotranspiration, soil moisture accountingand aquifer recharge in monthly water balance models. Water Resourches Researches.20 (8), 1137-1149.Galvíncio, J. D.; Sousa, F. A. S. Balanço Hídrico à superfície da bacia hidrográfica doaçude Epitácio Pessoa, utilizando informações digitais do terreno. Tese de doutoradoem Recursos Naturais. Universidade Federal de Campina Grande-UFCG., pp.15,1março 2005.
Galvíncio, J. D.; Sousa, F. A. S. Balanço Hídrico à superfície da bacia hidrográfica doaçude Epitácio Pessoa. Revista Brasileira de Recursos Hídricos, pp. 135-146, vol. 11,n.03, jul/set, 2006.Galvíncio, J. D.; Sousa, F. A. S. Avaliação do Desempenho do Modelo Hidrológico deBalanço Hídrico na Sub-Bacia de Caraúbas, em anos de El Nino e La Nina. Revis.Revista Brasileira de Recursos Hídricos, pp. ??, vol. 12, n.04, out/dez, 2007.Gleick, P.H., 1987. The development and testing of a water balance model for climateimpact assessment: modeling the Sacramento basin. Water Resour. Res. 23 (6), 1049–1061.Guo, S., 1995. Impact of climate change on hydrological balance and water resourcesystems in the Dongjiang Basin, China. Modeling and Management of SustainableBasin-Scale Water Resource (Proceedings of Boulder Symposium, 1995), IAHSPublication No. 231.Guo, S., Yin, A., 1997. Uncertainty analysis of impact of climatic change on hydrologyand water resource. Sustainability of Water Resource Under Increasing Uncertainty(Proceedings of Morocco Symposium, July 1997) 1997, No 240.Guo, S., Wang, J., Xiong, L., Ying, A., Li, D., 2002. A macro-scale and semidistributedmonthly water balance model to predict climate change impacts in China.Journal of Hydrology 268, 1–15.
Houghton, J.T., Ding, Y., Griggs, D.J., Noguer, M., Van Der Linden, P.J., Xiaosu, D.,2001. Climate Change 2001—the Scientific Basis, Contribution of Working Group I tothe Third Assessment Report of the Intergovernmental Panel on Climate Change(IPCC), Cambridge University Press, London, UK, p. 944.IPCC, 1995. IPCC Second Report of Assessment of Climate Change, CambridgeUniversity Press, London, UK.Kamga, F.M., 2001. Impact of greenhouse gas induced climate change on the runoff ofthe Upper Benue River (Camernoon). J. Hydrol. 252, 145–156.Mimikou, M., Kouvopoulos, Y., Cavadias, G., Vayianos, N., 1991.Nash, J.E., Sutcliffe, J., 1970. River flow forecasting through conceptual models. J.Hydrol. 10, 282–290.Palmer, W.C., 1965. Meteorologic drought. Res. Pap. US Weather Bur. 45, 58.Panagoulia, D., Dimou, G., 1997. Linking space-time scale in hydrological modelingwith respect to global climate change: model properties and experimental design. J.Hydrol. 194, 15–37.Thomas, H.A., 1981. Improved methods for national water assessment. Rep. ContractWR15249270, US Water Resource Council, Washington, D.C.
Thomas, H.A., Marin, C.M., Brown, M.J., Fiering, M.B., 1983. Methodology for waterresources assessment. Report to US Geological Survey, Rep. NTIS 84-124163, NationalTechnical Information Service, Springfield, V.A.Thornthwaite, C.W., Mather, J.R., 1955. The water balance. Publ. Climatol. Lab.Climatol. Drexel Inst. Technol. 8 (1), 1–104.Vandewiele, G.L., Elias, A., 1995. Monthly water balance of ungauged basins obtainedby geographical regionalization. J. Hydrol. 134, 315–347.Vandewiele, G.L., Xu, C., Ni-Lar-Win, 1992. Methodology and comparative study ofmonthly water balance models in Belgium, China and Burma. J. Hydrol. 134, 315–347.UNEP, 2001. Climate Change 2001—Impacts, Adaptation and Vulnerability, Summaryfor Policymakers and Technical Summary of the IPCC WGII Third Assessment Report,Cambridge University Press, London, UK, pp. 8–9.Xiong, L., Guo, S., 1997. Water balance models and application in China (in Chinesewith English abstract). J. Adv. Water Sci. 7, 74–78.Xiong, L., Guo, S., 1999. Two-parameter water balance model and its application. J.Hydrol. 216, 315–347.Xu, C.Y., Singh, V.P., 1998. A review on monthly water balance models for waterresources investigations. Water Resour. Mgmt 12, 31–50.
Yin, A., 2000. Support system of climate change on water resources in China. PhDThesis (in Chinese). Wuhan University of Hydraulic and Electrical Engineering, China,p. 133.Zhao, R., 1992. The Xinanjiang model applied in China. J. Hydrol. 135, 371–381.