MICRO AND SMALL ENTERPRISES IN LEBANON
MICRO AND SMALL ENTERPRISES IN LEBANON
MICRO AND SMALL ENTERPRISES IN LEBANON
You also want an ePaper? Increase the reach of your titles
YUMPU automatically turns print PDFs into web optimized ePapers that Google loves.
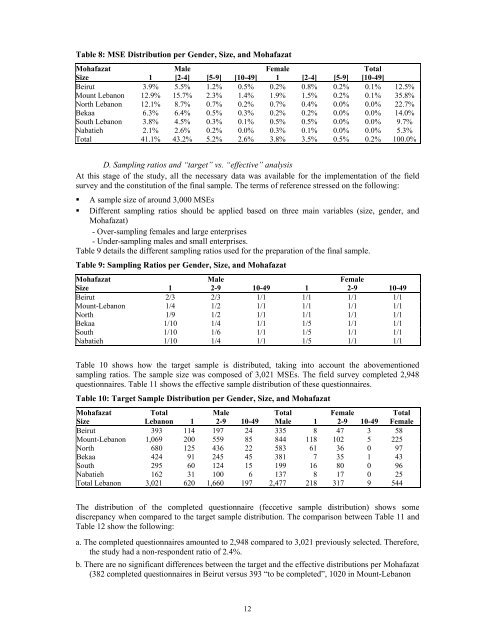
Table 8: MSE Distribution per Gender, Size, and MohafazatMohafazat Male Female TotalSize 1 [2-4] [5-9] [10-49] 1 [2-4] [5-9] [10-49]Beirut 3.9% 5.5% 1.2% 0.5% 0.2% 0.8% 0.2% 0.1% 12.5%Mount Lebanon 12.9% 15.7% 2.3% 1.4% 1.9% 1.5% 0.2% 0.1% 35.8%North Lebanon 12.1% 8.7% 0.7% 0.2% 0.7% 0.4% 0.0% 0.0% 22.7%Bekaa 6.3% 6.4% 0.5% 0.3% 0.2% 0.2% 0.0% 0.0% 14.0%South Lebanon 3.8% 4.5% 0.3% 0.1% 0.5% 0.5% 0.0% 0.0% 9.7%Nabatieh 2.1% 2.6% 0.2% 0.0% 0.3% 0.1% 0.0% 0.0% 5.3%Total 41.1% 43.2% 5.2% 2.6% 3.8% 3.5% 0.5% 0.2% 100.0%D. Sampling ratios and “target” vs. “effective” analysisAt this stage of the study, all the necessary data was available for the implementation of the fieldsurvey and the constitution of the final sample. The terms of reference stressed on the following:• A sample size of around 3,000 MSEs• Different sampling ratios should be applied based on three main variables (size, gender, andMohafazat)- Over-sampling females and large enterprises- Under-sampling males and small enterprises.Table 9 details the different sampling ratios used for the preparation of the final sample.Table 9: Sampling Ratios per Gender, Size, and MohafazatMohafazat Male FemaleSize 1 2-9 10-49 1 2-9 10-49Beirut 2/3 2/3 1/1 1/1 1/1 1/1Mount-Lebanon 1/4 1/2 1/1 1/1 1/1 1/1North 1/9 1/2 1/1 1/1 1/1 1/1Bekaa 1/10 1/4 1/1 1/5 1/1 1/1South 1/10 1/6 1/1 1/5 1/1 1/1Nabatieh 1/10 1/4 1/1 1/5 1/1 1/1Table 10 shows how the target sample is distributed, taking into account the abovementionedsampling ratios. The sample size was composed of 3,021 MSEs. The field survey completed 2,948questionnaires. Table 11 shows the effective sample distribution of these questionnaires.Table 10: Target Sample Distribution per Gender, Size, and MohafazatMohafazat Total Male Total Female TotalSize Lebanon 1 2-9 10-49 Male 1 2-9 10-49 FemaleBeirut 393 114 197 24 335 8 47 3 58Mount-Lebanon 1,069 200 559 85 844 118 102 5 225North 680 125 436 22 583 61 36 0 97Bekaa 424 91 245 45 381 7 35 1 43South 295 60 124 15 199 16 80 0 96Nabatieh 162 31 100 6 137 8 17 0 25Total Lebanon 3,021 620 1,660 197 2,477 218 317 9 544The distribution of the completed questionnaire (feccetive sample distribution) shows somediscrepancy when compared to the target sample distribution. The comparison between Table 11 andTable 12 show the following:a. The completed questionnaires amounted to 2,948 compared to 3,021 previously selected. Therefore,the study had a non-respondent ratio of 2.4%.b. There are no significant differences between the target and the effective distributions per Mohafazat(382 completed questionnaires in Beirut versus 393 “to be completed”, 1020 in Mount-Lebanon12


