File_2012_Document1
File_2012_Document1 File_2012_Document1
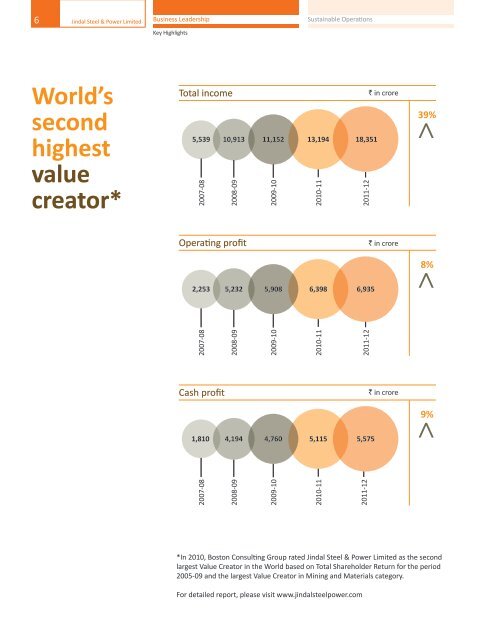
6 Jindal Steel & Power Limited Business Leadership Sustainable Operations Excellent Governance Robust FinancialsKey HighlightsAnnual Report 2011-127World’ssecondhighestvaluecreator*Total income5,539 10,9132007-082008-0911,1522009-1013,194` in crore18,351Profit after tax1,251 3,007 3,635 3,804 4,0022007-082008-092009-102010-112011-12` in crore5%>Operating profit2,253 5,232 5,908 6,398 6,935` in crore8%EPS (annualised)13.54 32.44 38.39 40.22 42.42`6%>2007-08**2008-09**2009-102010-112011-12Dividend rate %80 110 125 150 1602007-08**2008-09**2009-102010-112011-122007-082008-092009-102010-112011-12>Cash profit` in crore1,810 4,194 4,760 5,115 5,5759%2007-082008-09>2009-102010-112011-122010-112011-1239%>*In 2010, Boston Consulting Group rated Jindal Steel & Power Limited as the secondlargest Value Creator in the World based on Total Shareholder Return for the period2005-09 and the largest Value Creator in Mining and Materials category.** Normalised on account of issue of bonus shares in the ratio of 5:1 during 2009-10For detailed report, please visit www.jindalsteelpower.comGraphs not to scale
- Page 1 and 2: Value LeadershipANNUALREPORT11 12Ji
- Page 4: 2 Jindal Steel & Power Limited Busi
- Page 10: 8 Jindal Steel & Power Limited Busi
- Page 20: 18 Jindal Steel & Power Limited Bus
- Page 26: 24 Jindal Steel & Power Limited Bus
- Page 30: 28 Jindal Steel & Power Limited Bus
- Page 34: 32 Jindal Steel & Power Limited Bus
- Page 38: 36 Jindal Steel & Power Limited Bus
- Page 42: 40 Jindal Steel & Power Limited Bus
- Page 46: 44 Jindal Steel & Power Limited Bus
- Page 52: 50 Jindal Steel & Power Limited Bus
- Page 56: 54 Jindal Steel & Power Limited Bus
6 Jindal Steel & Power Limited Business Leadership Sustainable Operations Excellent Governance Robust FinancialsKey HighlightsAnnual Report 2011-127World’ssecondhighestvaluecreator*Total income5,539 10,9132007-082008-0911,1522009-1013,194` in crore18,351Profit after tax1,251 3,007 3,635 3,804 4,0022007-082008-092009-102010-112011-12` in crore5%>Operating profit2,253 5,232 5,908 6,398 6,935` in crore8%EPS (annualised)13.54 32.44 38.39 40.22 42.42`6%>2007-08**2008-09**2009-102010-112011-12Dividend rate %80 110 125 150 1602007-08**2008-09**2009-102010-112011-122007-082008-092009-102010-112011-12>Cash profit` in crore1,810 4,194 4,760 5,115 5,5759%2007-082008-09>2009-102010-112011-122010-112011-1239%>*In 2010, Boston Consulting Group rated Jindal Steel & Power Limited as the secondlargest Value Creator in the World based on Total Shareholder Return for the period2005-09 and the largest Value Creator in Mining and Materials category.** Normalised on account of issue of bonus shares in the ratio of 5:1 during 2009-10For detailed report, please visit www.jindalsteelpower.comGraphs not to scale


