File_2012_Document1
File_2012_Document1
File_2012_Document1

Create successful ePaper yourself
Turn your PDF publications into a flip-book with our unique Google optimized e-Paper software.
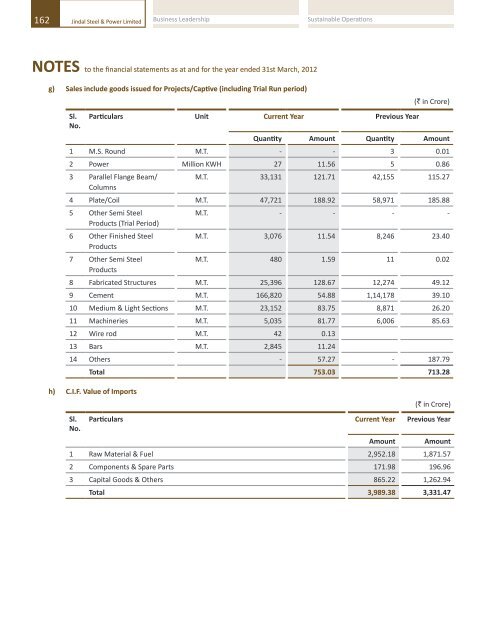
162 Jindal Steel & Power Limited Business Leadership Sustainable Operations Excellent Governance Robust FinancialsStandaloneAnnual Report 2011-12163NOTES to the financial statements as at and for the year ended 31st March, <strong>2012</strong>g) Sales include goods issued for Projects/Captive (including Trial Run period)(` in Crore)Sl. Particulars Unit Current Year Previous YearNo.Quantity Amount Quantity Amount1 M.S. Round M.T. - - 3 0.012 Power Million KWH 27 11.56 5 0.863 Parallel Flange Beam/ M.T. 33,131 121.71 42,155 115.27Columns4 Plate/Coil M.T. 47,721 188.92 58,971 185.885 Other Semi SteelM.T. - - - -Products (Trial Period)6 Other Finished SteelM.T. 3,076 11.54 8,246 23.40Products7 Other Semi SteelM.T. 480 1.59 11 0.02Products8 Fabricated Structures M.T. 25,396 128.67 12,274 49.129 Cement M.T. 166,820 54.88 1,14,178 39.1010 Medium & Light Sections M.T. 23,152 83.75 8,871 26.2011 Machineries M.T. 5,035 81.77 6,006 85.6312 Wire rod M.T. 42 0.1313 Bars M.T. 2,845 11.2414 Others - 57.27 - 187.79Total 753.03 713.28h) C.I.F. Value of Imports(` in Crore)Sl. Particulars Current Year Previous YearNo.Amount Amount1 Raw Material & Fuel 2,952.18 1,871.572 Components & Spare Parts 171.98 196.963 Capital Goods & Others 865.22 1,262.94Total 3,989.38 3,331.47NOTES to the financial statements as at and for the year ended 31st March, <strong>2012</strong>i) Break up of consumption of Raw Materials and Stores & Spares into Imported and IndigenousParticulars Current Year Previous Year(` in Crore)Amount % Amount %a) Raw Materialsi) Imported (including purchased through 2,313.88 51.08 1,094.73 40.09canalising agencies, High Sea Sales &others)ii) Indigenous 2,215.96 48.92 1,635.62 59.914,529.84 100.00 2,730.35 100.00b) Stores and Sparesi) Imported (including purchased through185.68 12.74 244.51 21.53canalising agencies, High Sea Sales &others)ii) Indigenous 1,271.49 87.26 890.94 78.471,457.17 100.00 1,135.45 100.00c) Coke and Coali) Imported (including purchased through413.07 73.23 296.16 98.56canalising agencies, High Sea Sales &others)ii) Indigenous 150.99 26.77 4.32 1.44564.06 100.00 300.48 100.00j) Expenditure in Foreign Currency (As Remitted)(` in Crore)Sl. Particulars Current Year Previous YearNo.Amount Amount1 Travelling 0.60 2.482 Interest & Arrangement Charges 92.28 67.823 Dividend* 9.78 0.024 Technical Knowhow Fees 59.84 36.645 Others 94.33 71.28Total 256.83 178.24* Total number of foreign shareholder to whom dividend paid during current financial year-47k) Earnings in Foreign Currency(` in Crore)Sl. Earnings In Foreign Currency Current Year Previous YearNo.Amount Amount1 FOB Value of Export Sales 1,428.84 1,073.612 Others - -Total 1,428.84 1,073.61