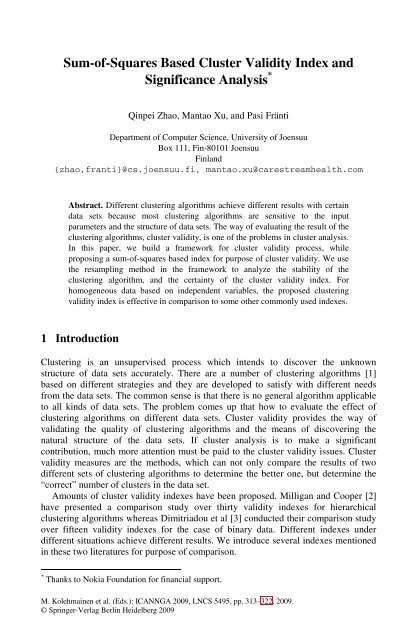
Sum-of-Squares Based Cluster Validity Index and ... - Joensuu
Sum-of-Squares Based Cluster Validity Index and ... - Joensuu
Sum-of-Squares Based Cluster Validity Index and ... - Joensuu

Create successful ePaper yourself
Turn your PDF publications into a flip-book with our unique Google optimized e-Paper software.
<strong>Sum</strong>-<strong>of</strong>-<strong>Squares</strong> <strong>Based</strong> <strong>Cluster</strong> <strong>Validity</strong> <strong>Index</strong> <strong>and</strong> Significance Analysis 3152 Related Work<strong>Cluster</strong> validity relates to the clustering algorithms. The fundamental clusteringproblem is to partition a given data set into groups, so that the points in the samegroup are more similar to each other than the points in different groups. Thus, oneway <strong>of</strong> the cluster validity is to analyze within-between group variance.Let X = {x 1 , x 2 … x n } be a set <strong>of</strong> data with n samples. Suppose the samples in Xhave hard labels that mark them as representatives <strong>of</strong> m non-overlapping clusters, saysC = {C 1 , C 2 … C m }. The clustering algorithm is to find the optimal partition P = {P 1 ,P 2 … P m }. The most important parameter among them is the parameter m, the number<strong>of</strong> clusters, because most <strong>of</strong> the clustering algorithms require the parameter m as theinput <strong>and</strong> thus the clustering result is also affected by it.Given the data set X, a specific clustering algorithm, <strong>and</strong> a fixed range <strong>of</strong> number<strong>of</strong> clusters, the basic procedure <strong>of</strong> the cluster validity involves the following steps:• Fix the data sets with external information.• Repeat the clustering algorithm successively for the number <strong>of</strong> clusters, mfrom a predefined minimum m min , to a predefined maximum m max .• Get the clustering results: partitions <strong>and</strong> codebooks. Calculate the indexvalue <strong>of</strong> each number <strong>of</strong> clusters.• Plot the “number <strong>of</strong> clusters vs. index metric” graph <strong>and</strong> select the m atwhich the partition appears to be the “best” according to how the index isoptimized.• Compare the detected number <strong>of</strong> clusters (m*) with the “externalinformation” to prove the effectiveness <strong>of</strong> the index.INPUT:DataSet(X)Parametersm<strong>Cluster</strong>ingAlgorithmPartitions PCodebook C<strong>Validity</strong><strong>Index</strong>m*({X})({P*, C*})ResamplingResampling'Fig. 1. Scheme diagram <strong>of</strong> cluster validity processThe clustering algorithm can be any <strong>of</strong> the existing algorithms. We use theR<strong>and</strong>om Local Search algorithm (RLS) [17] in the validity procedure. The RLSclustering algorithm shares the advantage <strong>of</strong> both the k-means <strong>and</strong> the local search.To eliminate the effect on index from the clustering algorithm, K-means clustering,the most typical clustering algorithm is also tested in this paper.<strong>Based</strong> on this procedure, we can easily have the scheme diagram <strong>of</strong> cluster validityin Fig.1. To estimate the stability <strong>of</strong> the clustering algorithm, we could use resamplingmethod as is shown in the resampling part. Furthermore, in order to exclude the effect
316 Q. Zhao, M. Xu, <strong>and</strong> P. Fränti<strong>of</strong> data sets <strong>and</strong> clustering algorithm, another resampling method is employed, as theresampling’ part shows. This part will be shown in section 4 in detail.Basically, comparison is essential to prove the effectiveness. The two types’indexes mentioned above are compared to the proposed index in the experimentssection.3 Proposed MethodIn cluster analysis, the within group variance <strong>and</strong> between group variance can becalculated by sum-<strong>of</strong>-squares within cluster (SSW) <strong>and</strong> sum-<strong>of</strong>-squares betweenclusters (SSB) respectively. We analysis the existing index based on SSW <strong>and</strong> SSB,<strong>and</strong> then propose a sum-<strong>of</strong>-squares based method, so-called WB-index.The value <strong>of</strong> SSW is defined as:1SSW ( C, m) = || x −C||m∑∑ j P( j)(1)n i = 1 j ∈ Ciwhich is minimized over all m-partitions C in the clustering procedure. According toANOVA, the total sum-<strong>of</strong>-squares (SST) can be decomposed into two parts that areSSW <strong>and</strong> SSB for any partition C.m1SSB( C, m) = ∑ ni|| Ci−x||(2)n i = 1where n i is the number <strong>of</strong> elements in each cluster, <strong>and</strong> x is the mean value <strong>of</strong> thewhole data set, m is the number <strong>of</strong> clusters. Hence, we can now define a generalizedwithin-between cluster type (SSWB) in Eq.3, which is a function <strong>of</strong> the SSW or SSB:SSWB = function( SSW ( C, m), SSB( C, m))(3)Table 1. <strong>Sum</strong>-<strong>of</strong>-squares based indexesNo. <strong>Index</strong> Name Formula1 Ball & Hall SSW/m2 Calinski&HarabaszSSB /( m −1)CH = SSW /( n − m )3 Hartigan H − index =− log( SSW / SSB)4 Xu Xu = d log(2SSW /( dn )) + log( m)The sum-<strong>of</strong>-squares based methods above (table.1) are all based on the property <strong>of</strong>the SSW <strong>and</strong> SSB. We study these indexes in Fig.1. As in Fig1.(a) shows, the trends <strong>of</strong>normalized SSW <strong>and</strong> SSW/SSB are almost same, indicating that the factor <strong>of</strong> the SSWhas a more important effect in the ratio <strong>of</strong> SSW/SSB. In other WB-type indexes exceptfor Xu’s index, we find that they either monotonously increase/decrease or need
<strong>Sum</strong>-<strong>of</strong>-<strong>Squares</strong> <strong>Based</strong> <strong>Cluster</strong> <strong>Validity</strong> <strong>Index</strong> <strong>and</strong> Significance Analysis 317additional knee point detection method, such as successive difference in order to get theoptimal number <strong>of</strong> clusters. Xu’s index has clear minimum knee point; however, ourexperiments in section 4 will show it doesn’t work well on real data sets.Thus, we propose a simpler sum-<strong>of</strong>-square method, WB-index as:WB = m SSW / SSB(4)We emphasize the effect <strong>of</strong> SSW with multiplying the number <strong>of</strong> clusters. Theadvantages <strong>of</strong> the proposed method are that it determines the number <strong>of</strong> clusters byminimal value <strong>of</strong> it without any knee point detection method, <strong>and</strong> it is easy to beimplemented.(a)(b)(c)(d)(e)(f)Fig. 2. (a). Comparison <strong>of</strong> SSW <strong>and</strong> SSW/SSB; (b)-(f). Comparison <strong>of</strong> several sum-<strong>of</strong>-squarebased indexes with four artificial data sets (s1-s4).
318 Q. Zhao, M. Xu, <strong>and</strong> P. Fränti4 Experimental ResultsIn this paper, we test the methods with the data sets in table.2. The data sets s1 to s4are generated with varying complexity in terms <strong>of</strong> spatial data distributions, whichhave 5000 vectors scattered around 15 predefined clusters with a varying degrees <strong>of</strong>overlap. The datasets a1 <strong>and</strong> R15 are generated in 2-dimensional Gaussi<strong>and</strong>istribution. Iris <strong>and</strong> Breast are the real data sets obtained from the UCI MachineLearning Repository. Iris is a four-dimensional data set, containing three classes <strong>of</strong> 50instances each, in which each class refers to a type <strong>of</strong> iris plant. The second real dataset is the Wisconsin breast cancer data set (Wolberg <strong>and</strong> Mangasarian, 1990).For purpose <strong>of</strong> comparison, we test five other classic measures:• Dunn's index (DI)• Davies-Bouldin's <strong>Index</strong> (DBI)• Xie-Beni (XB)• Bayes Information Criterion (BIC)• Silhouette Coefficient (SC)In the special case <strong>of</strong> m=1, SSW equals to SST. <strong>Cluster</strong>ing algorithm is thereforeperformed by m=[2,30] in the case <strong>of</strong> S1-S4, <strong>and</strong> m=[2,10] in the case <strong>of</strong> the real datasets.Table 2. Information <strong>of</strong> the data sets in the experimentsDataSet Size Dimension# <strong>of</strong>clustersGenerateds1-s4 5000 2 15 artificiala1 3000 2 20 artificialR15 600 2 15 artificialBreast 699 11 2 realiris/Iris 150 4 3 realTable 3. Results using the RLS (with 5000 RLS iterations <strong>and</strong> 2 K-means iterations)DataSet BH* CH* Har* Xu DI DBI XB SC BIC*WB-INDEX3 15 15 15 15 15 15 15 15 15s1-s43 15 4 15 7 15 15 15 4 154 15 4 15 16 8 4 15 4 153 15 3 15 25 13 13 15 5 15a1 3 20 3 20 34 20 20 20 3 20R15 3 15 15 15 2 15 15 15 8 15Breast 3 3 3 NA 14 2 2 2 2 2Iris 3 3 3 NA 2 2 2 9 6 3
<strong>Sum</strong>-<strong>of</strong>-<strong>Squares</strong> <strong>Based</strong> <strong>Cluster</strong> <strong>Validity</strong> <strong>Index</strong> <strong>and</strong> Significance Analysis 319Fig. 3. The results with different validity indexes <strong>and</strong> data sets. The results <strong>of</strong> Xu’s index <strong>and</strong>the proposed index on real data set Iris are on the last row. It is unable to find the minimumvalue <strong>of</strong> Xu’s index as the optimal number <strong>of</strong> clusters as it is monotonously decreasing.
320 Q. Zhao, M. Xu, <strong>and</strong> P. Fränti4 Significance AnalysisThe results <strong>of</strong> the experiments with different clustering algorithms <strong>and</strong> data setsdemonstrate that the proposed index can provide an accurate estimation <strong>of</strong> the number<strong>of</strong> clusters, which also shows the effectiveness <strong>of</strong> the cluster validity. Fundamentally,we can demonstrate the proposed index as it shows in the experiments. Moreover, wewant to confirm the results in this section by further significance analysis.4.1 Variability AnalysisWith an uncertain distribution <strong>of</strong> the results, resampling method can be employed as anatural approach for the variability estimation associated with each index value. As inthe process shows (Fig.1), we could resample on the original data set (X), get a newdata set (X*) <strong>and</strong> apply the new data set for the validation procedure again. Repeat theresampling B times, deal with the B times index values to get the statisticalsignificance. However, the RLS clustering algorithm is designed with r<strong>and</strong>omization,in which there is r<strong>and</strong>om swapping <strong>of</strong> the code vectors. Hence, we keep the data setunchanged <strong>and</strong> utilize the r<strong>and</strong>omization <strong>of</strong> the clustering algorithm by running Btimes to analyze the results.Fig. 4. 90% probability interval <strong>of</strong> the WB-index with the RLS <strong>and</strong> KMeans clustering on thedata set IrisQuartile range is one <strong>of</strong> the measures used to estimate variability. We use it intoour scheme to analyze the variability <strong>of</strong> each index value. With the same setting <strong>of</strong>input parameters, fix the number <strong>of</strong> clusters, <strong>and</strong> run the clustering algorithm B timesto get B values on the same number <strong>of</strong> clusters. Then the 5 th <strong>and</strong> 95 th percentiles <strong>of</strong> theB index values are calculated to get 90% probability range.Iris data as a real data set is a representative to be tested. According to the results,only the proposed method <strong>and</strong> the BIC with knee detection get the correct number onIris. In this case, both <strong>of</strong> the clustering algorithms with the same data set <strong>and</strong> indexare tested. We run B = 100 times <strong>of</strong> the clustering algorithm with the same inputparameters setting. The 90% probability interval with the RLS <strong>and</strong> K-means is shown
<strong>Sum</strong>-<strong>of</strong>-<strong>Squares</strong> <strong>Based</strong> <strong>Cluster</strong> <strong>Validity</strong> <strong>Index</strong> <strong>and</strong> Significance Analysis 321respectively in Fig.4, <strong>and</strong> the dash line is the boundary <strong>of</strong> the range. It is clear that therange m = [2, 3] strongly indicates the optimal number <strong>of</strong> clusters with the RLSclustering; <strong>and</strong> m = [2, 5] with the K-means clustering. The range <strong>of</strong> m is wider withthe K-means clustering than the RLS clustering. Thus we can conclude that RLSclustering is more stable than the K-means <strong>and</strong> the variability <strong>of</strong> the K-means on m =3 is convincingly larger than that <strong>of</strong> the RLS on the Iris.4.2 Certainty AnalysisWe develop another way to prove the certainty <strong>of</strong> the proposed index, which employsthe resampling method. As Fig.1 shows, the effect <strong>of</strong> the validity index is affected bythe data set <strong>and</strong> the clustering algorithm. In this case, resampling the data set cannotprevent the effect coming from the clustering algorithm. Hence, we process theresampling method on the partitions getting from the clustering to avoid this problem.In the first run <strong>of</strong> the validity procedure, a set <strong>of</strong> partitions (P) is generated.Basically, this set <strong>of</strong> partitions is the optimal one according to the clusteringalgorithm. A WB-index value (WBI) is obtained on P. We permute the originalpartitions (P) by B times, get {P*}, <strong>and</strong> recalculate the index values {WBI*}. As theoptimal value <strong>of</strong> the WB-index should be as small as possible, we can estimate thecertainty by counting the probability that WBI*≤ WBI.No.( WBI* ≤ WBI)P = (5)TotalNo.( WBI*)The smaller the probability P is, the more certainty the method obtains. It is notpractical to calculate all possible permutations due to the involved time. Generally, atleast B =1000 times permutations should be done. In this paper, 1000 r<strong>and</strong>ompermutations were performed on the partitions (Fig.5). It indicates the certainty <strong>of</strong> theindex, as the observed optimal value is much smaller than any <strong>of</strong> the values obtainedunder permutation.Fig. 5. Distribution <strong>of</strong> the WB-index on Iris data set (m=3) for 1000 permutations <strong>of</strong> thepartitions with the RLS clustering. The “optimal” value <strong>of</strong> the WBI is very extreme byreference to this distribution (WBI = 0.032653).
322 Q. Zhao, M. Xu, <strong>and</strong> P. Fränti5 ConclusionsWe represented a framework with the resampling step for the estimation on thestability <strong>of</strong> the clustering algorithm <strong>and</strong> the variability <strong>of</strong> the validity index in clustervalidity process. In addition, we proposed a new sum-<strong>of</strong>-squares based index whichindicates simplicity <strong>and</strong> good prospect compared to other indexes. <strong>Based</strong> on theproposed index, we completed the whole process <strong>of</strong> the cluster validity.References1. Xu, R., Wunsch, D.: Survey <strong>of</strong> clustering algorithms. IEEE Transactions on NeuralNetworks 16(3), 645–678 (2005)2. Milligan, G.W., Cooper, M.C.: An examination <strong>of</strong> procedures for determining the number<strong>of</strong> clusters in a data set. Psychometrika 50, 159–179 (1985)3. Dimitriadou, E., Dolnicar, S., Weingassel, A.: An examination <strong>of</strong> indexes for determiningthe number <strong>of</strong> clusters in binary data sets. Psychometrika 67(1), 137–160 (2002)4. Ball, G.H., Hubert, L.J.: ISODATA, A novel method <strong>of</strong> data analysis <strong>and</strong> patternclassification (Tech. Rep. NTIS No. AD 699616). St<strong>and</strong>ford Research Institute, MenloPark (1965)5. Calinski, T., Harabasz, J.: A dendrite method for cluster analysis. Communication instatistics 3, 1–27 (1974)6. Hartigan, J.A.: <strong>Cluster</strong>ing algorithms. Wiley, New York (1975)7. Xu, L.: Bayesian Ying-Yang machine, clustering <strong>and</strong> number <strong>of</strong> clusters. PatternRecognition Letters 18, 1167–1178 (1997)8. Dunn, J.C.: Well separated clusters <strong>and</strong> optimal fuzzy partitions. Journal <strong>of</strong> Cybernetica 4,95–104 (1974)9. Davies, D.L., Bouldin, D.W.: <strong>Cluster</strong> separation measure. IEEE Transactions on PatternAnalysis <strong>and</strong> Machine Intelligence 1(2), 95–104 (1979)10. Xie, X.L., Beni, G.: A validity measure for fuzzy clustering. IEEE Trans. on PatternAnalysis <strong>and</strong> Machine Intelligence 13(8), 841–847 (1991)11. Frayley, C., Raftery, A.: How many clusters? Which clustering method? answers viamodel-based cluster analysis. Technical Report no. 329, Department <strong>of</strong> Statistics,University <strong>of</strong> Washington (1998)12. Kaufman, L., Rousseeuw, P.J.: Finding Groups in data. In: An Introduction to clusteranalysis. Wiley, New York (1990)13. Peck, R., Fisher, L., Ness, J.V.: Approximate confidence intervals for the number <strong>of</strong>clusters. Journal <strong>of</strong> the American Statistical Association 84(405), 184–191 (1989)14. Ben-Hur, A., Elisseeff, A., Guyon, I.: A stability based method for discovering structure inclustered data. In: Proceedings <strong>of</strong> the Pacific Symposium on Biocomputing, pp. 6–17(2002)15. Tibshirani, R., Walther, G.: <strong>Cluster</strong> validation by prediction strength. Journal <strong>of</strong>Computational & Graphical Statistics 14(3), 511–528 (2005)16. Dudoit, S., Fridly<strong>and</strong>, J.: A prediction-based resampling method for estimating the number<strong>of</strong> clusters in a dataset. Genome Biology 3(7) (June 2002)17. Fränti, P., Kivijärvi, J.: R<strong>and</strong>omized local search algorithm for the clustering problem.Pattern Analysis <strong>and</strong> Applications 3(4), 358–369 (2000)