Measurement of the Ω lifetime - Infn
Measurement of the Ω lifetime - Infn
Measurement of the Ω lifetime - Infn

You also want an ePaper? Increase the reach of your titles
YUMPU automatically turns print PDFs into web optimized ePapers that Google loves.
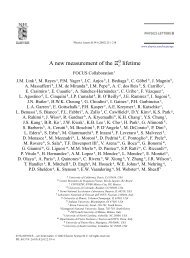
Physics Letters B 561 (2003) 41–48www.elsevier.com/locate/npe<strong>Measurement</strong> <strong>of</strong> <strong>the</strong> Ω 0 c <strong>lifetime</strong>FOCUS CollaborationJ.M. Link, M. Reyes, P.M. YagerUniversity <strong>of</strong> California, Davis, CA 95616, USAJ.C. Anjos, I. Bediaga, C. Göbel, J. Magnin, A. Massafferri, J.M. de Miranda,I.M. Pepe, A.C. dos ReisCentro Brasileiro de Pesquisas Físicas, Rio de Janeiro, RJ, BrazilS. Carrillo, E. Casimiro, E. Cuautle, A. Sánchez-Hernández, C. Uribe, F. VázquezCINVESTAV, 07000 México City, DF, MexicoL. Agostino, L. Cinquini, J.P. Cumalat, B. O’Reilly, J.E. Ramirez, I. Segoni, M. WahlUniversity <strong>of</strong> Colorado, Boulder, CO 80309, USAJ.N. Butler, H.W.K. Cheung, G. Chiodini, I. Gaines, P.H. Garbincius, L.A. Garren,E. Gottschalk, P.H. Kasper, A.E. Kreymer, R. KutschkeFermi National Accelerator Laboratory, Batavia, IL 60510, USAL. Benussi, S. Bianco, F.L. Fabbri, A. ZalloLaboratori Nazionali di Frascati dell’INFN, I-00044 Frascati, ItalyC.Cawlfield,D.Y.Kim,A.Rahimi,J.WissUniversity <strong>of</strong> Illinois, Urbana-Champaign, IL 61801, USAR. Gardner, A. KryemadhiIndiana University, Bloomington, IN 47405, USAC.H. Chang, Y.S. Chung, J.S. Kang, B.R. Ko, J.W. Kwak, K.B. LeeKorea University, Seoul 136-701, South Korea0370-2693/03/$ – see front matter © 2003 Published by Elsevier Science B.V.doi:10.1016/S0370-2693(03)00388-5
42 FOCUS Collaboration / Physics Letters B 561 (2003) 41–48K. Cho, H. ParkKyungpook National University, Taegu 702-701, South KoreaG. Alimonti, S. Barberis, M. Boschini, A. Cerutti, P. D’Angelo, M. DiCorato,P. Dini, L. Edera, S. Erba, M. Giammarchi, P. Inzani, F. Leveraro,S. Malvezzi, D. Menasce, M. Mezzadri, L. Moroni, D. Pedrini,C.Pontoglio,F.Prelz,M.Rovere,S.SalaINFN and University <strong>of</strong> Milano, Milano, ItalyT.F. Davenport IIIUniversity <strong>of</strong> North Carolina, Asheville, NC 28804, USAV. Arena, G. Boca, G. Bonomi, G. Gianini, G. Liguori, M.M. Merlo, D. Pantea,D. Lopes Pegna, S.P. Ratti, C. Riccardi, P. VituloDipartimento di Fisica Nucleare e Teorica and INFN, Pavia, ItalyH. Hernandez, A.M. Lopez, E. Luiggi, H. Mendez, A. Paris, J. Quinones,W. Xiong, Y. ZhangUniversity <strong>of</strong> Puerto Rico, Mayaguez, PR 00681, USAJ.R. WilsonUniversity <strong>of</strong> South Carolina, Columbia, SC 29208, USAT. Handler, R. MitchellUniversity <strong>of</strong> Tennessee, Knoxville, TN 37996, USAD. Engh, M. Hosack, W.E. Johns, M. Nehring, P.D. Sheldon, K. Stenson,E.W. Vaandering, M. WebsterVanderbilt University, Nashville, TN 37235, USAM. SheaffUniversity <strong>of</strong> Wisconsin, Madison, WI 53706, USAReceived 25 February 2003; accepted 10 March 2003Editor: L. Montanet
44 FOCUS Collaboration / Physics Letters B 561 (2003) 41–48Fig. 1. Invariant mass distributions for Ω 0 c candidates: (a) reconstructed mass <strong>of</strong> Ξ − K − π + π + .Thereare38± 9 events at a mass <strong>of</strong>2696.5 ± 1.9 MeV/c 2 . (b) Reconstructed mass <strong>of</strong> Ω − π + .Thereare23± 7 events at a mass <strong>of</strong> 2699.4 ± 3.4 MeV/c 2 . (c) Combined invariantmass distribution. There are 64 ± 14 events at a mass <strong>of</strong> 2697.5 ± 2.2 MeV/c 2 . We define <strong>the</strong> signal region (hatched area) to be within 2σ <strong>of</strong><strong>the</strong> fitted mass value and <strong>the</strong> two sideband regions (dotted area) are 4–12σ from <strong>the</strong> fitted mass value.three charged tracks <strong>of</strong> <strong>the</strong> right charge combinationfor <strong>the</strong> Ξ − K − π + π + mode, and an Ω − and an oppositelycharged track for <strong>the</strong> Ω − π + mode. The confidencelevel <strong>of</strong> <strong>the</strong> decay vertex <strong>of</strong> <strong>the</strong> Ωc 0 candidate isrequired to be greater than 10%. The combined momentumvector located at <strong>the</strong> decay vertex forms <strong>the</strong>Ωc 0 track. A candidate driven vertexing algorithm [12]uses <strong>the</strong> Ωc 0 track as a seed track to find a productionvertex with a confidence level greater than 1%. Theprimary multiplicity, including <strong>the</strong> seed track, mustbe at least 3 tracks and <strong>the</strong> production vertex mustbe inside a target. The significance <strong>of</strong> separation between<strong>the</strong> production and <strong>the</strong> decay vertices (L/σ L )must be greater than 2 for <strong>the</strong> Ξ − K − π + π + modeand greater than 0 for <strong>the</strong> Ω − π + mode. Different valuesare chosen for <strong>the</strong> L/σ L cut due to a differencein <strong>the</strong> secondary vertex resolution. Čerenkov particleidentification (PID) is performed by constructing a loglikelihood value W i for <strong>the</strong> particle hypo<strong>the</strong>ses (i =e,π,K,p).Theπ consistency <strong>of</strong> a track is defined byW π = W min − W π ,whereW min is <strong>the</strong> minimum Wvalue <strong>of</strong> <strong>the</strong> o<strong>the</strong>r three hypo<strong>the</strong>ses. Similarly, we defineW K,π = W π − W K for kaon identification. Werequire W K,π > 3 for kaons and W π > −6 forpions. In <strong>the</strong> Ξ − K − π + π + mode, we add additionalcombination PID cuts based on Monte Carlo simulationstudies. We define ∑ W π to be <strong>the</strong> positivesum over pion candidates and <strong>the</strong> negative sumover o<strong>the</strong>r particle candidates. Also W K,π +W K,pis used for separation between <strong>the</strong> protons and <strong>the</strong>kaons. ∑ W π and W K,π + W K,p are requiredto be greater than 7. In <strong>the</strong> Ω − π + mode <strong>the</strong> momentumasymmetry, (P Ω − − P π +)/(P Ω − + P π +), isrequired to be greater than −0.2 and less than 0.7.Also <strong>the</strong> π + transverse momentum must be larger than0.2 GeV/c and <strong>the</strong> momentum <strong>of</strong> Ωc 0 must be greaterthan 50 GeV/c. The resulting mass spectra are shownin Fig. 1. The mass spectra are fit with a Gaussianfunction for <strong>the</strong> signal distribution and a first orderpolynomial function for <strong>the</strong> background. From <strong>the</strong>combined sample, we find a fitted mass <strong>of</strong> 2697.5 ±2.2 MeV/c 2 (systematic uncertainty not evaluated),consistent with <strong>the</strong> results <strong>of</strong> o<strong>the</strong>r experiments.4. Lifetime measurementTo measure a <strong>lifetime</strong> in fixed target experiments,we use a binned maximum likelihood technique [13].We fit <strong>the</strong> reduced proper time distribution, definedas t ′ = (L − Nσ L )/βγ c = t − Nσ t ,whereN is <strong>the</strong>separation cut value between <strong>the</strong> production and <strong>the</strong>decay vertex, βc is <strong>the</strong> particle velocity, and γ is <strong>the</strong>Lorentz boost factor to <strong>the</strong> Ωc 0 center <strong>of</strong> mass frame.The signal region is defined to lie within 2σ <strong>of</strong> <strong>the</strong>fitted Ωc 0 mass. The background is assumed to have
FOCUS Collaboration / Physics Letters B 561 (2003) 41–48 45Fig. 2. The f(t ′ ) correction function is displayed for each mode.Fig. 3. (a) The corrected t ′ distribution with <strong>the</strong> <strong>lifetime</strong> fit function for <strong>the</strong> combined signal. (b) The t ′ distributions <strong>of</strong> expected backgroundsin <strong>the</strong> signal band for each mode; <strong>the</strong> dark region is for Ξ − K − π + π + and <strong>the</strong> light one is for Ω − π + . Lines show <strong>the</strong> <strong>lifetime</strong> fitting functionsfor signal and background distributions. The <strong>lifetime</strong> fit finds 59 ± 12 signal events ra<strong>the</strong>r than 64 ± 14 due to <strong>the</strong> 2σ mass window used.<strong>the</strong> same <strong>lifetime</strong> behavior in <strong>the</strong> signal region as in<strong>the</strong> sidebands, 4–12σ away from <strong>the</strong> peak. Taking S as<strong>the</strong> number <strong>of</strong> signal events in <strong>the</strong> signal region and Bas <strong>the</strong> total number <strong>of</strong> background events in <strong>the</strong> sameregion, <strong>the</strong> expected number <strong>of</strong> events n i in <strong>the</strong> ithreduced proper time bin centered at ti ′ is given by:n i = S f(t′ i )e−t i ′/τ∑(1)i f(t′ i )e−t i ′/τ + B b i∑i b ,iwhere b i describes <strong>the</strong> background reduced propertime as estimated from sidebands and f(ti ′ ) is a correctionfunction which takes into account <strong>the</strong> effects<strong>of</strong> spectrometer acceptance and efficiency, analysis cutefficiencies, and particle absorption. The f(t ′ ) distributionare shown in Fig. 2 for each decay mode.The likelihood is constructed from <strong>the</strong> product<strong>of</strong> <strong>the</strong> Poisson probability <strong>of</strong> observing s i eventswhen n i are expected with <strong>the</strong> Poisson probability <strong>of</strong>observing N b = ∑ b i events in <strong>the</strong> sidebands when
46 FOCUS Collaboration / Physics Letters B 561 (2003) 41–48Fig. 4. The predicted events (histogram) are superimposed on <strong>the</strong> observed events (points) while <strong>the</strong> shaded distribution displays <strong>the</strong> t ′distribution <strong>of</strong> <strong>the</strong> background for (a) <strong>the</strong> Ξ − K − π + π + mode and (b) <strong>the</strong> Ω − π + mode.4B background events are expected. The factor <strong>of</strong> 4accounts for <strong>the</strong> fact that <strong>the</strong> sideband region is fourtimes wider than <strong>the</strong> signal region. The likelihoodtakes <strong>the</strong> form:( ∏ n s i) (iL =e−n i (4B)N be −4B )×.s i !N b !iThe combined likelihood function is given by <strong>the</strong>product <strong>of</strong> <strong>the</strong> likelihoods:L Ω 0 c= L Ξ − K − π + π + × L Ω − π +.(2)There are 3 fit parameters; one parameter for <strong>the</strong><strong>lifetime</strong> τ and two parameters, B Ξ − K − π + π + andB Ω − π +, for <strong>the</strong> backgrounds from each mode. Ourmeasurement <strong>of</strong> <strong>the</strong> Ωc 0 <strong>lifetime</strong> is 72 ±11 fs as shownin Fig. 3. In Fig. 4, <strong>the</strong> t ′ distributions from <strong>the</strong> dataand from <strong>the</strong> fit are compared with each o<strong>the</strong>r.5. Studies <strong>of</strong> systematic errorsWe have studied various systematic uncertaintiesassociated with <strong>the</strong> Monte Carlo modeling by computing<strong>the</strong> <strong>lifetime</strong>s <strong>of</strong> independent data samples splitby particle/antiparticle, primary vertex position (upstreamand downstream target region), Ω 0 c momentum(greater than 70 GeV/c and less than 70 GeV/c) andproduction vertex multiplicity (> 5and 5). All <strong>lifetime</strong>sfrom <strong>the</strong>se samples are consistent within <strong>the</strong> statisticalerror as shown in Fig. 5 points 1–8, indicatinga negligible systematic error due to <strong>the</strong> Monte Carlosimulation.Since <strong>the</strong> binned likelihood method has been usedto measure <strong>the</strong> <strong>lifetime</strong>, we have investigated <strong>the</strong>uncertainty from <strong>the</strong> fit range and binning effects byexamining <strong>the</strong> variance in <strong>lifetime</strong> for different t ′ binsizes (Fig. 5, points 10–11) and for different fittingranges (Fig. 5, point 9).The proper time resolution <strong>of</strong> our fully simulatedMonte Carlo for <strong>the</strong> Ωc0 data is about 40–50 fs.We have tested <strong>the</strong> accuracy <strong>of</strong> <strong>the</strong> fitting procedurewhen <strong>the</strong> <strong>lifetime</strong> is comparable to <strong>the</strong> proper timeresolution. We used a toy Monte Carlo study to test<strong>the</strong> fitting procedure using <strong>the</strong> proper time from whichwe extracted a systematic uncertainty <strong>of</strong> 4 fs. Thetoy Monte Carlo test was also used to validate <strong>the</strong>statistical error determination.The systematic uncertainty due to <strong>the</strong> backgroundcontamination is examined by investigating <strong>the</strong> reflectionsfrom o<strong>the</strong>r charm baryon decays and by varying<strong>the</strong> sideband and signal regions (Fig. 5, points 12–17).The studies <strong>of</strong> <strong>the</strong> systematic uncertainties are summarizedin Table 1. The total systematic uncertainty <strong>of</strong><strong>the</strong> Ωc 0 <strong>lifetime</strong> measurement is determined to be 11 fsby adding all <strong>of</strong> <strong>the</strong> systematic uncertainties in quadrature.
FOCUS Collaboration / Physics Letters B 561 (2003) 41–48 47Fig. 5. Lifetime measurements for systematic studies. The solid line represents <strong>the</strong> best determined value for <strong>the</strong> Ωc 0 <strong>lifetime</strong> and <strong>the</strong> two dottedlines show <strong>the</strong> extent <strong>of</strong> <strong>the</strong> statistical error.Table 1The itemized list <strong>of</strong> <strong>the</strong> systematic uncertainties. The numbers in <strong>the</strong> items column refer to <strong>the</strong> entry numbers in Fig. 5Systematic source Items Uncertainty (fs)Split sample method Particle and antiparticle (1,2) ∼ 0Upstream and downstream target (3,4) ∼ 0High and low momentum (5,6) ∼ 0Primary vertex multiplicity (7,8) ∼ 0Fit variant Bin size (10,11) and fitting region (9) ±9t ′ resolution Toy Monte Carlo studies ±4Background Sideband (12,13,14) and signal band (15,16,17) ±5Total ±11Table 2The Ωc 0 <strong>lifetime</strong> measurementsExperiment Lifetime Decay modesE687 86 +27−20 ± 28 fs + K − K − π +WA89 55 +13−11 +18−23 fs Ξ − K − π + π + , Ω − π + π + π −PDG2002 64 ± 20 fsFOCUS 72 ± 11 ± 11 fs Ξ − K − π + π + , Ω − π +6. ConclusionWe measure an Ωc 0 <strong>lifetime</strong> <strong>of</strong> 72±11±11 fs using64 ± 14 events in <strong>the</strong> two decay modes, Ω − π + andΞ − K − π + π + . We compare our result with previousmeasurements in Table 2. Our <strong>lifetime</strong> result is consistentwith previous Ωc 0 <strong>lifetime</strong> results. This 20% measurement<strong>of</strong> <strong>the</strong> <strong>lifetime</strong> substantially improves upon<strong>the</strong> current (30%) world average.AcknowledgementsWe wish to acknowledge <strong>the</strong> assistance <strong>of</strong> <strong>the</strong> staffs<strong>of</strong> Fermi National Accelerator Laboratory, <strong>the</strong> INFN<strong>of</strong> Italy, and <strong>the</strong> physics departments <strong>of</strong> <strong>the</strong> collaboratinginstitutions. This research was supported in part by<strong>the</strong> US National Science Foundation, <strong>the</strong> US Depart-
48 FOCUS Collaboration / Physics Letters B 561 (2003) 41–48ment <strong>of</strong> Energy, <strong>the</strong> Italian Istituto Nazionale di FisicaNucleare and Ministero della Istruzione, Universitàe Ricerca, <strong>the</strong> Brazilian Conselho Nacional de DesenvolvimentoCientífico e Tecnológico, CONACyT-México, and <strong>the</strong> Korea Research Foundation <strong>of</strong> <strong>the</strong>Korean Ministry <strong>of</strong> Education.References[1] S.F. Biagi, et al., Z. Phys. C 28 (1985) 175.[2] ARGUS Collaboration, J. Stiewe, in: J.R. Sanford (Ed.),Proceedings <strong>of</strong> 26th International Conference in High EnergyPhysics, Dallas 1992, Vol. 1, American Institute <strong>of</strong> Physics,New York, 1993, p. 1076.[3] P.L. Frabetti, et al., Phys. Lett. B 338 (1994) 106.[4] P.L. Frabetti, et al., Phys. Lett. B 357 (1995) 678.[5] P.L. Frabetti, et al., Phys. Lett. B 300 (1993) 190.[6] M.I. Adamovich, et al., Phys. Lett. B 358 (1995) 151.[7] D. Cronin-Hennessy, et al., Phys. Rev. Lett. 86 (2001) 3730.[8] H.-Y. Cheng, Phys. Lett. B 289 (1992) 455.[9] Particle Data Group, K. Hagiwara, et al., Phys. Rev. D 66(2002) 010001.[10] J.M. Link, et al., Nucl. Instrum. Methods A 484 (2002) 270.[11] J.M. Link, et al., Nucl. Instrum. Methods A 484 (2002) 174.[12] E687 Collaboration, P.L. Frabetti, et al., Nucl. Instum. MethodsA 320 (1992) 519.[13] P.L. Frabetti, et al., Phys. Lett. B 268 (1991) 584.