Stat-403/Stat-650 : Intermediate Sampling and Experimental Design ...
Stat-403/Stat-650 : Intermediate Sampling and Experimental Design ...
Stat-403/Stat-650 : Intermediate Sampling and Experimental Design ...
You also want an ePaper? Increase the reach of your titles
YUMPU automatically turns print PDFs into web optimized ePapers that Google loves.
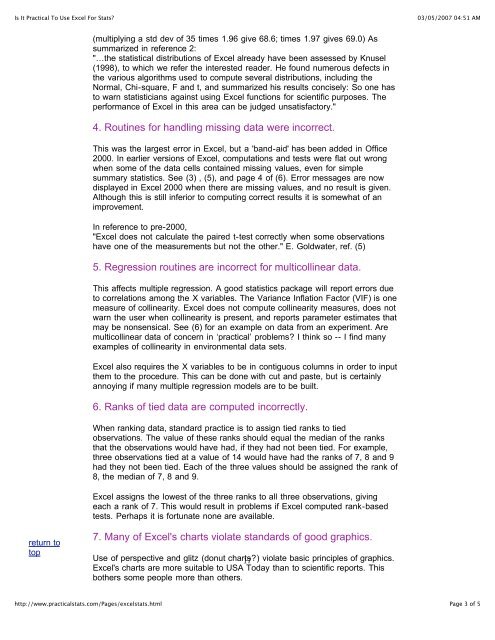
Is It Practical To Use Excel For <strong>Stat</strong>s?03/05/2007 04:51 AM(multiplying a std dev of 35 times 1.96 give 68.6; times 1.97 gives 69.0) Assummarized in reference 2:"…the statistical distributions of Excel already have been assessed by Knusel(1998), to which we refer the interested reader. He found numerous defects inthe various algorithms used to compute several distributions, including theNormal, Chi-square, F <strong>and</strong> t, <strong>and</strong> summarized his results concisely: So one hasto warn statisticians against using Excel functions for scientific purposes. Theperformance of Excel in this area can be judged unsatisfactory."4. Routines for h<strong>and</strong>ling missing data were incorrect.This was the largest error in Excel, but a 'b<strong>and</strong>-aid' has been added in Office2000. In earlier versions of Excel, computations <strong>and</strong> tests were flat out wrongwhen some of the data cells contained missing values, even for simplesummary statistics. See (3) , (5), <strong>and</strong> page 4 of (6). Error messages are nowdisplayed in Excel 2000 when there are missing values, <strong>and</strong> no result is given.Although this is still inferior to computing correct results it is somewhat of animprovement.In reference to pre-2000,"Excel does not calculate the paired t-test correctly when some observationshave one of the measurements but not the other." E. Goldwater, ref. (5)5. Regression routines are incorrect for multicollinear data.This affects multiple regression. A good statistics package will report errors dueto correlations among the X variables. The Variance Inflation Factor (VIF) is onemeasure of collinearity. Excel does not compute collinearity measures, does notwarn the user when collinearity is present, <strong>and</strong> reports parameter estimates thatmay be nonsensical. See (6) for an example on data from an experiment. Aremulticollinear data of concern in ‘practical’ problems? I think so -- I find manyexamples of collinearity in environmental data sets.Excel also requires the X variables to be in contiguous columns in order to inputthem to the procedure. This can be done with cut <strong>and</strong> paste, but is certainlyannoying if many multiple regression models are to be built.6. Ranks of tied data are computed incorrectly.When ranking data, st<strong>and</strong>ard practice is to assign tied ranks to tiedobservations. The value of these ranks should equal the median of the ranksthat the observations would have had, if they had not been tied. For example,three observations tied at a value of 14 would have had the ranks of 7, 8 <strong>and</strong> 9had they not been tied. Each of the three values should be assigned the rank of8, the median of 7, 8 <strong>and</strong> 9.Excel assigns the lowest of the three ranks to all three observations, givingeach a rank of 7. This would result in problems if Excel computed rank-basedtests. Perhaps it is fortunate none are available.return totop7. Many of Excel's charts violate st<strong>and</strong>ards of good graphics.Use of perspective <strong>and</strong> glitz (donut charts?) 17 violate basic principles of graphics.Excel's charts are more suitable to USA Today than to scientific reports. Thisbothers some people more than others.http://www.practicalstats.com/Pages/excelstats.htmlPage 3 of 5


