Optimal control of the penicillin G fed-batch fermentation: An ...
Optimal control of the penicillin G fed-batch fermentation: An ...
Optimal control of the penicillin G fed-batch fermentation: An ...

Create successful ePaper yourself
Turn your PDF publications into a flip-book with our unique Google optimized e-Paper software.
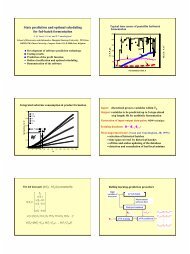
PENIClLLlN G FED-BATCH FERMENTATION 27questions concerning <strong>the</strong> validity <strong>of</strong> <strong>the</strong> model <strong>of</strong> Heijnen et al. under conditions imposed byapplying <strong>the</strong> optimal feed rate. Since up to now <strong>the</strong> <strong>penicillin</strong> <strong>fermentation</strong> has been recognizedthrough all experiments as an intrinsically biphasic process, it seems unlikely that <strong>the</strong> obtained<strong>control</strong> put into practice would result in a quasi-monophasic <strong>fermentation</strong> while producingsuch a high gain. We conclude that <strong>the</strong> results obtained using optimal <strong>control</strong> <strong>the</strong>ory suggestsome possible shortcomings in this model: optimization for model discrimination. A deeperstudy <strong>of</strong> this model in comparison with <strong>the</strong> model <strong>of</strong> Bajpai and Red6 can be found inReference 4.3.2.2. B=brif= ZO-'. We now give <strong>the</strong> analogous results for <strong>the</strong> o<strong>the</strong>r extremal valueB = perit = lo-' in order to demonstrate that <strong>the</strong> computational algorithm can be applied toevery model with 0 < B < hrit. The left plot <strong>of</strong> Figure 5 shows <strong>the</strong> evolution <strong>of</strong> tz and thusP(tr) and tf as functions <strong>of</strong> SO. Observe that <strong>the</strong> optimal couple (S:, t?) corresponds to tz = 0;in o<strong>the</strong>r words, <strong>the</strong> optimal initial state lies on <strong>the</strong> singular hyperplane itself. As a consequence,<strong>the</strong> separation between growth and production phases has disappeared completely. This is alsoillustrated by <strong>the</strong> time pr<strong>of</strong>iles <strong>of</strong> <strong>the</strong> right plot <strong>of</strong> Figure 5. In this case both u and ?r are <strong>of</strong>Monod type: <strong>the</strong> corner point in ?r has disappeared completely (see Figure 3). However, <strong>the</strong>optimal solution does not consist <strong>of</strong> adding all substrate available at t = 0 followed by a <strong>batch</strong>phase as could be expected at first sight. The main reason is <strong>the</strong> following. Combiningequations (2) and (4) with (13). we can verify that <strong>the</strong> resulting expression for u as a function<strong>of</strong> C, does not satisfy an equation <strong>of</strong> <strong>the</strong> formu(Cs) = Yp/xp(C,)In o<strong>the</strong>r words, this is not a case <strong>of</strong> completely growth-associated production.For this value <strong>of</strong> B <strong>the</strong> lower limit &in is equal to <strong>the</strong> optimal value $. Note again that <strong>the</strong>condition dP/dt = 0 is never met before t = tt, so we can indeed apply <strong>the</strong> proposed algorithmto <strong>the</strong> whole interval So€ [Smin,a]. Some numerical values for <strong>the</strong> optimal <strong>control</strong> aresummarized in Table 11.Observe that on <strong>the</strong> singular arc <strong>the</strong> variations in u and p (and thus in C,) with respect totime are more pronounced than in <strong>the</strong> case <strong>of</strong> B = lo-", although kh has not been changed.We conclude that <strong>the</strong> model structure itself also plays an important role in <strong>the</strong> amplitude <strong>of</strong><strong>the</strong>se variations.1, , 10,0 0.5 1 1.5 1 1.5 3 3.5YW Imdlxi04Figure 5. B= peril = lo-'. Left plot: extremal values for P(tr), 12 and tr as functions <strong>of</strong> So. Scaling: 12/50, rf/300,(P(tr) - 430O)/280. Right plot: optimal glucose feed rate and corresponding cell, glucose, product, P and ppr<strong>of</strong>iles.Scaling: C, x 2 x lo3, C, x 2, q103, p x 200, ?r x 4 x lo4, u/300