Financial Stability Report No1 20 December 2010 - Banka Qendrore ...
Financial Stability Report No1 20 December 2010 - Banka Qendrore ...
Financial Stability Report No1 20 December 2010 - Banka Qendrore ...
Create successful ePaper yourself
Turn your PDF publications into a flip-book with our unique Google optimized e-Paper software.
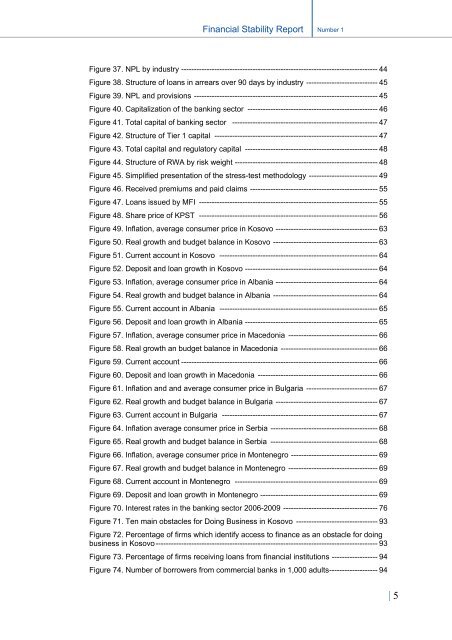
<strong>Financial</strong> <strong>Stability</strong> <strong>Report</strong>Number 1Figure 37. NPL by industry ----------------------------------------------------------------------------- 44Figure 38. Structure of loans in arrears over 90 days by industry ---------------------------- 45Figure 39. NPL and provisions ------------------------------------------------------------------------ 45Figure 40. Capitalization of the banking sector --------------------------------------------------- 46Figure 41. Total capital of banking sector --------------------------------------------------------- 47Figure 42. Structure of Tier 1 capital ---------------------------------------------------------------- 47Figure 43. Total capital and regulatory capital ---------------------------------------------------- 48Figure 44. Structure of RWA by risk weight -------------------------------------------------------- 48Figure 45. Simplified presentation of the stress-test methodology --------------------------- 49Figure 46. Received premiums and paid claims -------------------------------------------------- 55Figure 47. Loans issued by MFI ---------------------------------------------------------------------- 55Figure 48. Share price of KPST ---------------------------------------------------------------------- 56Figure 49. Inflation, average consumer price in Kosovo ---------------------------------------- 63Figure 50. Real growth and budget balance in Kosovo ----------------------------------------- 63Figure 51. Current account in Kosovo -------------------------------------------------------------- 64Figure 52. Deposit and loan growth in Kosovo ---------------------------------------------------- 64Figure 53. Inflation, average consumer price in Albania ---------------------------------------- 64Figure 54. Real growth and budget balance in Albania ----------------------------------------- 64Figure 55. Current account in Albania -------------------------------------------------------------- 65Figure 56. Deposit and loan growth in Albania ---------------------------------------------------- 65Figure 57. Inflation, average consumer price in Macedonia ----------------------------------- 66Figure 58. Real growth an budget balance in Macedonia -------------------------------------- 66Figure 59. Current account ----------------------------------------------------------------------------- 66Figure 60. Deposit and loan growth in Macedonia ----------------------------------------------- 66Figure 61. Inflation and and average consumer price in Bulgaria ---------------------------- 67Figure 62. Real growth and budget balance in Bulgaria ---------------------------------------- 67Figure 63. Current account in Bulgaria ------------------------------------------------------------- 67Figure 64. Inflation average consumer price in Serbia ------------------------------------------ 68Figure 65. Real growth and budget balance in Serbia ------------------------------------------ 68Figure 66. Inflation, average consumer price in Montenegro ---------------------------------- 69Figure 67. Real growth and budget balance in Montenegro ----------------------------------- 69Figure 68. Current account in Montenegro -------------------------------------------------------- 69Figure 69. Deposit and loan growth in Montenegro ---------------------------------------------- 69Figure 70. Interest rates in the banking sector <strong>20</strong>06-<strong>20</strong>09 ------------------------------------- 76Figure 71. Ten main obstacles for Doing Business in Kosovo -------------------------------- 93Figure 72. Percentage of firms which identify access to finance as an obstacle for doingbusiness in Kosovo --------------------------------------------------------------------------------------- 93Figure 73. Percentage of firms receiving loans from financial institutions ------------------ 94Figure 74. Number of borrowers from commercial banks in 1,000 adults ------------------- 94| 5


