Achieving ALARP with Safety Instrumented Systems - ICEWeb
Achieving ALARP with Safety Instrumented Systems - ICEWeb
Achieving ALARP with Safety Instrumented Systems - ICEWeb

You also want an ePaper? Increase the reach of your titles
YUMPU automatically turns print PDFs into web optimized ePapers that Google loves.
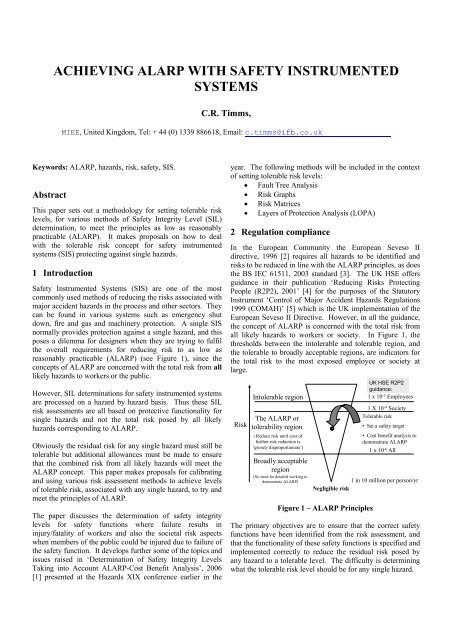
ACHIEVING <strong>ALARP</strong> WITH SAFETY INSTRUMENTEDSYSTEMSC.R. Timms,MIEE, United Kingdom, Tel: + 44 (0) 1339 886618, Email: c.timms@ifb.co.ukKeywords: <strong>ALARP</strong>, hazards, risk, safety, SIS.AbstractThis paper sets out a methodology for setting tolerable risklevels, for various methods of <strong>Safety</strong> Integrity Level (SIL)determination, to meet the principles as low as reasonablypracticable (<strong>ALARP</strong>). It makes proposals on how to deal<strong>with</strong> the tolerable risk concept for safety instrumentedsystems (SIS) protecting against single hazards.1 Introduction<strong>Safety</strong> <strong>Instrumented</strong> <strong>Systems</strong> (SIS) are one of the mostcommonly used methods of reducing the risks associated <strong>with</strong>major accident hazards in the process and other sectors. Theycan be found in various systems such as emergency shutdown, fire and gas and machinery protection. A single SISnormally provides protection against a single hazard, and thisposes a dilemma for designers when they are trying to fulfilthe overall requirements for reducing risk to as low asreasonably practicable (<strong>ALARP</strong>) (see Figure 1), since theconcepts of <strong>ALARP</strong> are concerned <strong>with</strong> the total risk from alllikely hazards to workers or the public.However, SIL determinations for safety instrumented systemsare processed on a hazard by hazard basis. Thus these SILrisk assessments are all based on protective functionality forsingle hazards and not the total risk posed by all likelyhazards corresponding to <strong>ALARP</strong>.Obviously the residual risk for any single hazard must still betolerable but additional allowances must be made to ensurethat the combined risk from all likely hazards will meet the<strong>ALARP</strong> concept. This paper makes proposals for calibratingand using various risk assessment methods to achieve levelsof tolerable risk, associated <strong>with</strong> any single hazard, to try andmeet the principles of <strong>ALARP</strong>.The paper discusses the determination of safety integritylevels for safety functions where failure results ininjury/fatality of workers and also the societal risk aspectswhen members of the public could be injured due to failure ofthe safety function. It develops further some of the topics andissues raised in ‘Determination of <strong>Safety</strong> Integrity LevelsTaking into Account <strong>ALARP</strong>-Cost Benefit Analysis’, 2006[1] presented at the Hazards XIX conference earlier in theyear. The following methods will be included in the contextof setting tolerable risk levels:• Fault Tree Analysis• Risk Graphs• Risk Matrices• Layers of Protection Analysis (LOPA)2 Regulation complianceIn the European Community the European Seveso IIdirective, 1996 [2] requires all hazards to be identified andrisks to be reduced in line <strong>with</strong> the <strong>ALARP</strong> principles, as doesthe BS IEC 61511, 2003 standard [3]. The UK HSE offersguidance in their publication ‘Reducing Risks ProtectingPeople (R2P2), 2001’ [4] for the purposes of the StatutoryInstrument ‘Control of Major Accident Hazards Regulations1999 (COMAH)’ [5] which is the UK implementation of theEuropean Seveso II Directive. However, in all the guidance,the concept of <strong>ALARP</strong> is concerned <strong>with</strong> the total risk fromall likely hazards to workers or society. In Figure 1, thethresholds between the intolerable and tolerable region, andthe tolerable to broadly acceptable regions, are indicators forthe total risk to the most exposed employee or society atlarge.RiskIntolerable regionThe <strong>ALARP</strong> ortolerability region( Reduce risk until cost offurther risk reduction is‘grossly disproportionate’)Broadly acceptableregion(No need for detailed working todemonstrate <strong>ALARP</strong>)UK HSE R2P2guidance:1 x 10 -3 Employees1 X 10 -4 SocietyTolerable risk• Set a safety target• Cost benefit analysis todemonstrate <strong>ALARP</strong>1 x 10 -6 All1 in 10 million per person/yrNegligible riskFigure 1 – <strong>ALARP</strong> PrinciplesThe primary objectives are to ensure that the correct safetyfunctions have been identified from the risk assessment, andthat the functionality of these safety functions is specified andimplemented correctly to reduce the residual risk posed byany hazard to a tolerable level. The difficulty is determiningwhat the tolerable risk level should be for any single hazard.
In addition, tolerable is not the same as acceptable, it is alevel at which there is a willingness to live <strong>with</strong> the risk inorder to obtain the benefits.3 Risk Assessment MethodsThe risk assessment method may be either qualitative orquantitative and it does not have to be quantified if it candemonstrate that the residual risk is better than, or close to,the ‘broadly acceptable’ region.However quantified or semi quantified methods are usuallyused when the levels of risk are quite high and include:• Fault Tree Analysis• Semi quantified Risk Graphs• Semi quantified Risk Matrices• Layers of Protection Analysis (LOPA)Experience shows that a semi quantified approach such as arisk graph or risk matrix is most appropriate to undertake theinitial risk assessment for large installations. They are simpleto interpret, relatively fast to use and they also produceconservative results. This is due to their rigid framework, asthis limits the number of parameters for which risk reductioncredit can be claimed. A more detailed analysis of the higherSIL results can then be undertaken by methods such as FaultTree Analysis or LOPA. Fully quantified methods such aFault Tree Analysis tend to be time consuming and when awhole process plant is to be analysed then it become animpracticable exercise.Whether quantified or semi quantified methods are used, theyrequire a numerical value for the target or objective residualrisk. This then allows the analysis to determine if sufficientrisk reduction is achieved. This tolerable risk objective willbe referred to as the <strong>Safety</strong> Target.4 Setting <strong>Safety</strong> TargetsAlthough most major organisations will probably haveestablished corporate values for ‘tolerable risk’, this is often anew experience for the majority of end users of <strong>Safety</strong><strong>Instrumented</strong> <strong>Systems</strong> (SIS), and an area which causesconsiderable problems.None of the UK regulations offer a ‘typical’ value for atolerable risk and this is understandable since it will bedependant on the disproportional cost of further riskreduction, and this will never have any ‘typical’ value.The HSE document ‘Reducing Risks, Protecting People, 200’(R2P2) (paragraph 128) indicates the upper limit boundarybetween Tolerable and Unacceptable risk, for workers, wouldbe 1 in 1,000 (1.0E-03) per annum, as shown in Figure 1.In (Paragraph 130) of R2P2 the boundary between Tolerableand Broadly Acceptable risk, for risks entertaining fatalities,for both workers and public is indicated as 1 in 1,000,000(1.0E-06) per annum as this corresponds to a very low levelof risk, as shown in Figure 1.These boundaries are based on total risk to the most exposedindividual and the dilemma faced by engineers involved inSIS is to understand and/or calculate where the tolerable risk,or safety target, should sit <strong>with</strong>in the upper and lowerboundaries for a single hazard.Where a major accident hazard could impact on both workersand the public then it is necessary to establish tolerable risklevels for both. It is generally expected that the tolerable riskfor the public, often referred to as societal risk, will be at leastten times less, i.e. more restrictive than for workers.Risk assessment by SIL determination only makes anassessment of the risk associated <strong>with</strong> a single hazard whilst<strong>ALARP</strong> is concerned <strong>with</strong> the most exposed person to ALLrisks per annum. It is practically impossible for the SISdesigner to estimate how many simultaneous risks anindividual might be exposed to when considering a design toprotect against a specific hazard in a particular area, as ‘allrisks’ embrace a wide spectrum of hazards including slips,trips and falls. It is simply not practicable to try and resolvesuch a complex problem for all workers and society for everyindividual safety instrumented function (SIF).Thus some rationale needs to be established to makeallowances for the fact that only single hazards are analysedduring SIL determination. It may be possible to try andestimate all the hazards that might be encountered by the mostexposed individual, under normal routines and occupancy,and then take an average for the <strong>Safety</strong> Target.Another option is to use judgement to set the single hazard<strong>Safety</strong> Target a factor more sensitive than a corporate all risksper annum tolerable risk target. This would make allowancesfor these uncertain multiple risk conditions; e.g. if a corporateall risks per annum was set at of 1 in 1000 (1.0E-03), for themost exposed individual, then if a factor of ten was used thesingle hazard tolerable risk would be reduced to 1 in 10,000(1.0E-04). The HSE do not currently provide guidance on thescale of this factor, and opinion ranges between 10 and 100,but there is general agreement in the industry that a factor ofat least 10 is sufficient.Where the consequences of a hazardous event impact uponthe public then a Societal Risk assessment is required. Eachoperating organisation must set their societal risk criteria andthis is quite commonly set to be a factor of ten times lowerthan for on site workers; e.g. If the tolerable risk for workerswas set at 1.0E-04 then the tolerable societal risk could be1.0E-05. Thus the suggested factor of ten risk reduction forsingle hazards can be applied to both the tolerable risk forworkers and society.If risk is being assessed for a multiple proximity plant site,then the target for society/public needs to be proportionallyfurther reduced, i.e. if there are ten plants in close proximity
then the public risk target needs to be a factor of another tentimes lower. This would not be the case for workers as theyusually work on one plant <strong>with</strong> exposure limited to hazardsfrom that plant. However, consideration needs to be giventoo any potential for domino escalation between sites.4.1 <strong>Safety</strong> Targets and Risk ReductionRisk analysis determines if existing risk reduction measuresare sufficient. Risk reduction is generally made up of anumber of different layers and some typical examples areshown in Figure 2.Mitigating Layers: e.g. Deluge andEmergency Response ProceduresOther Protective Layers:e.g. Pressure Relief<strong>Safety</strong> <strong>Instrumented</strong> <strong>Systems</strong>Alarm LayerProcess Control LayerProcessdesignFigure 2 – Risk Reduction LayersTotal risk reduction is a product of the individual riskreduction measures. Thus each risk reduction layer normallyhas a quantified value attributable to it. Having established a<strong>Safety</strong> Target or tolerable risk for any single hazard, theobjective of the risk assessment is to estimate the riskreduction achieved by existing measures, in numerical terms,and to compare this <strong>with</strong> the <strong>Safety</strong> Target such that:<strong>Safety</strong> TargetProduct of Existing Risk Reduction Measures5 Setting <strong>Safety</strong> TargetsThis section will discuss ways in which <strong>Safety</strong> targets can beset for different methods of risk assessment.5.1 Risk GraphsRisk graphs are far more useful and consistent when all theparameters are semi quantified. The general arrangement ofthe BS IEC 61508 risk graph used for a Personnel <strong>Safety</strong> isshown in Figure 3.Starting point forrisk reductionassessmentC AC BC CC DF AF BF AF BF AF BW 1a --- ---P A1 a ---P AP BP AP BP AP BFigure 3 – Risk Graph General ArrangementThe graph uses the following parameters for making the riskassessment:• C = Consequence severityWhere C = Number of people x Vulnerability Factor• F = Occupancy of the hazardous area being considered• P = Alternatives to avoid the hazard• W = Frequency of demand on the SIS or likelihood• 1,2,3,4 = <strong>Safety</strong> integrity level (SIL)234b1234a123The actual <strong>Safety</strong> Target delivered by this kind of graph isbest demonstrated by an example shown in Table 2This will indicate if additional risk reduction measures areneeded and the value of required risk reduction required. Therelationship between the required risk reduction and theprobability of failure on demand (PFD) used in SIS design is:An example risk Parameter Low Value High1 / Risk Reduction = PFDThe Relationship between SIL, risk reduction and PFD isprovided in BS IEC 61511 and is shown in Table 1.SIL Risk Reduction PFD1 10 - 100 1.0E-1 – 1.0E-22 100 - 1000 1.0E-2 – 1.0E-33 1000 - 10000 1.0E-3 – 1.0E-44 10000 - 100000 1.0E-4 – 1.0E-5Table 1 – SIL, Risk Reduction and PFDThe PFD range of values, for a specific SIL, is often referredto as the ‘SIL Band’.graph has beenValueassignedW3 0.3 3.0parameters <strong>with</strong> W2 0.03 0.3the valuesW1 0.003 0.03opposite:CA 0.001 0.01CB 0.01 0.1A ‘typical SIL CC 0.1 1.0determination has CD >1.0resulted in a riskFA 0.01 0.01path <strong>with</strong> theFB 0.1 1.0highlightedPA 0.1 0.1parameters.PB 1.0 1.0Each parameter hasSIL 1 0.01 0.1a range value <strong>with</strong>SIL 2 0.001 0.01a high and low end SIL 3 0.0001 0.001values SIL 4 0.00001 0.0001Table 2 – Example Risk Graph Calibration
The calibration assigned to each parameter has a range ofvalues <strong>with</strong> high and low end value. An example SILdetermination is highlighted on the risk graph in Figure 3 andin the parameters of Table 2. These result in a specificcalibration for the risk graph.The ‘high’ end and ‘low’ end values of any parameter impacton the overall risk assessment e.g. From the example inTable 2, the frequency of demand parameter of W2 rangesfrom 0.03 years to 0.3 years. Obviously the risk is less if thedemand is 0.03/year than if it was 0.3/year.If all the parameters were at their ‘low’ end of range thiswould result in the highest level of achievable risk reductionof 3.0E-08, or best case as shown in Case A:is required to meet the Tolerable Risk for a single hazard i.e.the <strong>Safety</strong> Target.5.2 Risk MatrixRisk matrices afford a far more limited risk assessment thanrisk graphs, but they can still be semi quantified to help <strong>with</strong>assessment consistency. Figure 4 shows a basic 5 x 4 matrix.ConsequenceCACBNone0.01- 0.1W33.0-0.3_1Likelihood (Demands Per Year)W20.3-0.03_aW10.03-0.003__W010234123a12_a1If all the parameters were at their ‘high’ end of range thiswould result in the lowest level of achievable risk reductionof 3.0E-04, or worst case as shown in Case B:(High CC) * (High FA) * (PB) * (High W2) * (High SIL 2)Thus:Case B = (1.0) * (0.1) * (1.0) * (0.3) * (0.01)Case B = 3.0E-04Taking the two extreme cases the average risk reduction canbe calculated as follows:The risk reduction afforded by the best case:Case A = 3.0E-08andThe risk reduction afforded by the worst case:Case B = 3.0E-04Since the example risk graph is based on a logarithmic scalingthe average risk figure is the logarithmic average of the bestand worst risk values:Ln(Average risk) = (Ln A +Ln B)/2Ln(Average risk) = ((Ln(3.0E-08) +Ln(3.0E-04))/2Average risk for this example = 3.0E-06 for any singlehazard and represents the <strong>Safety</strong> Target achieved by thisrisk graph example.Similar risk graphs <strong>with</strong> specific tolerable risk targets forsocietal consequences, asset loss and environmentalconsequences usually form a complete risk assessment.The <strong>Safety</strong> Integrity Level (SIL) which is delivered by thistype of risk graph represents the additional risk reduction thatFigure 4–Example Risk MatrixThere are now only three parameters to be considered:• W = Likelihood• C = Consequence severityWhere C = Number of people x Vulnerability Factor• 1,2,3,4 = <strong>Safety</strong> Integrity Level (SIL)As <strong>with</strong> the risk graph example, each parameter has a range ofvalues. To understand how the calibration works it is bestdemonstrated by an example as shown in Figure 4, where aSIL assessment has resulted in W2, CC and a SIL 1. Then ifall the parameters were at their ‘low’ end of range this wouldresult in the highest level of achievable risk reduction of3.0E-05, or the best case as shown in Case A:Case A = (Low CC) * (Low W2) * (Low SIL 1)Thus:Case A = (0.1) * (0.03) * (0.01)Case A = 3.0E-05If all the parameters were at their ‘high’ end this would resultin the lowest level of achievable risk reduction of 3.0E-02, orthe worst case as shown in Case B:Case B = (High CC)* (High W2) * (High SIL 1)Thus:Case B = (1.0) * (0.3) * (0.1)Case B = 3.0E-02Since the risk example matrix is based on a logarithmicscaling the average risk figure is the logarithmic average ofthe best and worst case risk values:Ln(Average risk) = (Ln A +Ln B)/2Ln(Average risk) = ((Ln(3.0E-05) +Ln(3.0E-02))/2
Average risk for this example = 9.0E-04 for any singlehazard and represents the <strong>Safety</strong> Target achieved by thisrisk matrix example.5.3 Fault Tree AnalysisFault Tree Analysis is probably the most straightforward ofall risk assessment methods for determining the differencebetween any existing risk reduction and a <strong>Safety</strong> Target.Freq/yr1.0PFD0.10.10.10.10.1EventPressuresurge occursPressurecontrol failsHighpressurealarm failsOperatorfails torespondSIF failsRelief ValvefailsImpact EventOverpressureand loss ofcontainmentfrom First StageSeparatorSurgeControl0.1/yr0.2/yrAlarmOperator0.02/yrSIF0.002/yrFigure 5–Example Fault Tree AnalysisTotal MitigatedEvent Frequency7.5E-04RV2x10 -4 /yrLoss ofContainmentTaking a very simple example as shown in Figure 5 thelikelihood of an undesirable loss of containment event iscalculated at 2.0E-04/year. This can be compared <strong>with</strong> therequired tolerable risk, and adjustments can then be made tothe SIF PFD, or other measures taken as required.5.4 Layers of Protection Analysis (LOPA)LOPA is rapidly becoming a popular method for riskassessment and SIL determination and guidance onapplication can be founding the American Institute ofChemical Engineers Centre for Chemical Process <strong>Safety</strong>document -‘Layer of Protection Analysis Simplified ProcessAssessment’, 2001[6]. A simple example of a safety basedLOPA worksheet is shown in Figure 6.Protection &MitigationLayersEvent FrequencyProcess designRelief valveProcess ControlOccupancyIndependent alarmIntermediateEvent FrequencyTolerable EventFrequencyRequired SIS riskreductionInitiating CauseBlocked Outlet0.1/year0.50.10.10.10.52.5E-041.0E-05Initiating CauseProcess Control0.2/year0.50.10.10.55.0E-041.0E-05/7.5E-04 = 1.3E-02 (SIL 1)Figure 6– Example Layers of Protection AnalysisAs <strong>with</strong> risk graphs LOPA must be quantified to providemeaningful and consistent results. A tolerable risk or <strong>Safety</strong>-Target must also be set. The consequence severity andlikelihood of a hazardous event are quantified for everycause/consequence pair, in the absence of any protection ormitigation measures. Credit is taken for risk reductionafforded by independent protection layers and also factorswhich are considered to make a contribution towardsmitigating the consequences. Each layer, for which riskreducing credit is taken, is assigned an appropriate quantifiedrisk reduction factor. Conditional modifiers are also used tocredit further risk reduction which might only be specific toworkers, society, the asset or the environment; e.g. a bundround a tank or closed drains will reduce the environmentalimpact of a spillage but have no effect on the asset loss.Some typical risk reduction layers are shown in Figure 2 andmight include:• Inherent process design factors;• Process control systems;• Alarm systems if independent from the processcontrol;• Existing safety instrumented functionality;• Personnel occupancy of the area;• Mechanical protection such a pressure relief;• Mitigating measures such as fire and gas systems;• <strong>Safety</strong> procedures;• Emergency response procedures.The total mitigated event frequency is compared <strong>with</strong> thetolerable risk frequency target that has been set for workers,society, the asset and environment and the difference equatesto any additional risk reduction factor to be contributed by theSIS.6.0 Use of Cost Benefit Analysis (CBA)When a safety target is set for any risk assessment methodthen, by achieving the determined SIL for the SIS, the safetytarget will be met.However, there still remains the question about whethersufficient risk reduction has been made for satisfying the ‘aslow as reasonably practicable’ requirement i.e. shouldadditional risk reduction measures be applied?6.1 CBA BackgroundThe UK guidance, on the relationship between ‘as low asreasonably practicable’ (<strong>ALARP</strong>) and the use of cost benefitanalysis (CBA), can be found in the HSE R2P2 document.The CBA is based on an estimate of the costs of riskreduction measures and the number of casualties saved byimplementation. Thus the cost of preventing a fatality (CPF)takes the form:CPF = Total cost of the risk reduction measures (1)Total fatalities prevented
Then by comparing this <strong>with</strong> the value of preventing a fatality(VPF) an estimate can be made of the proportion factor:Proportion Factor = CPF / VPF (2)When the Proportion Factor is 1 or less (or even 2 or less)then R2P2 advises that additional measures should beimplemented.* R2P2 Appendix 3 Para graph 13: ‘VPF is oftenmisunderstood to mean that a value is being placed on a life.This is not the case. It is simply another way of saying whatpeople are prepared to pay to secure an average riskreduction. A VPF of £1,000,000 corresponds to a riskreduction of 1 in 100,000 being worth £10 to an averageindividual. VPF is therefore not to be confused <strong>with</strong> whatsociety, or the courts, might put on the life of a real person orthe compensation appropriate to its loss.’ ‘VPF will varydepending on the particular hazardous situation.’This is fine for assessing the benefit where no risk reductionhas been previously specified. The CBA is a little morecomplex when an operator already has specified certain riskreduction measures, but needs to demonstrate whether furtherrisk reduction would be cost effective. This is often thesituation when designing SIS. In many cases the cost ofexisting measures is not known, particularly on legacy orbrown field installations.6.2 Developing CBA for an Existing <strong>Safety</strong> TargetThe difference between the current risk reduction measuresand the additional risk reduction, achieved by implementationof further measures, has to be analysed. This involves theadditional costs of implementation, the difference in riskreduction achieved and the value for all fatalities preventedover the predicted life time operation of the facility.In this case from (2):Proportion Factor = CPF/VPFOr:P f = CPF/VPFThen:CPF = P f * VPF (3)And since (1)CPF = Total cost of the risk reduction measuresTotal fatalities preventedThen :Substituting (3) in (4) for CPF:(Pf * VPF) * Total fatalities prevented = Total cost of riskreduction measures (5)And since the total fatalities prevented is represented by aproduct of the frequency of demand (F) on the SIS, theprobability of failure on a demand (PFD), the operating life ofthe plant (PL) and the number of fatalities (N) resulting fromthe hazardous event:Total fatalities prevented = F x PFD x PL x N (6)Then substituting for (6) in (5):(Pf * VPF) * (F * PFD * PL * N) = Total cost of riskreduction measures (7)Where:Pf = Proportion factorVPF = Value of preventing a fatalityF = Frequency of demand on the SIF (for a range usehigh frequency value)PFD = Probability of failure of the SIFPL = Plant operating lifeN = Number of fatalities per hazardous eventWhere an existing risk reduction proposal has been madethrough a risk assessment (such as by use of a risk graph orLOPA), then the additional fatalities prevented will beproportional to the difference between the PFD of the existingsolution and the PFD <strong>with</strong> further risk reduction measures.Ifpfd 1 = PFD of existing proposal from risk assessmentpfd 2 = PFD <strong>with</strong> additional risk reduction measuresTotal ADDITIONAL fatalities prevented= F * (pfd 1 - pfd 2 ) * PL * N (8)Then by taking equation (5):P f * VPF * Total fatalities prevented = Total cost of riskreduction measuresSubstituting (8) for ‘total additional fatalities prevented’:Total justified cost of FURTHER risk reduction measures= P f * VPF * (F * (pfd 1 - pfd 2 ) * PL * N) (9)But at what value should the objective pfd 2 be set?This paper suggests that the <strong>ALARP</strong> threshold of ‘broadlyacceptable’ is the ultimate objective i.e. 1.0E-06 for bothworkers and public for all risks.CPF* Total fatalities prevented = Total cost of risk reductionmeasures (4)
Thus using the factor of ten times more sensitive for anysingle hazard this would be a pfd 2 of 1.0E-07.Note.R2P2 indicates the Proportion Factor ‘P f ’ should be:• 10 when working close totolerable/unacceptable boundary;• 1-2 when working close to the broadlyacceptable boundary.A value of 1 will be used for P f as pdf 2 is at the ‘broadlyacceptable’ level of risk.6.3 Example of CBA for a given <strong>Safety</strong> TargetThe justifiable additional cost for achieving the principle of<strong>ALARP</strong> is best demonstrated by way of an example:Where:• The tolerable risk will be based on the example riskgraph calibration described in Section 5.1 i.e. 3.0E-06;• Value of preventing a fatality (VPF) = £2,000,000 forvoluntary (workers);• The boundary between Tolerable and BroadlyAcceptable = 1 in 1,000,000 for both workers and public– HSE R2P2.• The number of onsite fatalities estimated due to a majortoxic release (N) = 10.• The frequency of demand (F) = 0.1 (1 in ten years).• The operational plant life expectancy (PL) = 30 years.The PFD of current proposal (pfd 1 ) = 3.0E-06 (Tolerable riskcalibration of the risk graph).The PFD <strong>with</strong> additional measures (pfd 2 ) = 1.0E-07 (The‘broadly acceptable’ value of 1.0E-06 for public and workersincreased by a factor of ten for the single hazard analysis).Then by using equation (9):Total cost of risk reduction measures (C t )= P f * VPF * (F * (pfd 1 - pfd 2 ) * PL * N)7.0 Finding the Optimal <strong>Safety</strong> TargetThe SIS engineer really needs to know where the optimal<strong>Safety</strong> Target is before setting out on the risk assessmentprocess. If this could be determined then calibrating thechosen risk assessment method to the optimal <strong>Safety</strong> Targetvalue, and designing the SIS to achieve the target, wouldensure compliance <strong>with</strong> the <strong>ALARP</strong> principles.This cannot be done by simply making a ‘stab in the dark’but making multiple iterations for the CBA calculations couldbe prohibitively time consuming. The optimal <strong>Safety</strong> targetcan be found by using equation (9) to plot a range of initialPFD options (i.e. pfd 1 ) to a ‘broadly acceptable’ PFD value(i.e. pfd 2 ). The VPF can be set to the company value and thenumber of fatalities per hazardous event can be assessed bythe normal risk assessment methods.This is again best demonstrated by an example:• VPF = £2,000,000• N = 10• PL = 30 years• F = 0.1/yearIf a range of pfd 1 values is plotted for 10 fatalities against a‘broadly acceptable’ risk for pdf 2 of 1.0E-07 (for a singlehazard) then Figure 7 indicates that further risk reductionmeasures of many millions of pounds would be justified if thecurrent risk reduction measures achieved less than 1.0E-2. Italso indicates that there is a distinct flattening of the curve ataround 1.0E-04 indicating the region of the optimal <strong>Safety</strong>Target and achieving greater risk reduction than this value islikely to satisfy <strong>ALARP</strong> principles.Justified Cost ofFurther Measures£5,999,000£4,999,000£3,999,000Acceptable Risk = 1.0E-7Workers (VPF = £2.0 Million), 10 fatalities, 30 year plant life, demand = 0.1/yrC t = 1 .0 * 2,000,000 * (0.1 * (3.0E-6 – 1.0E-7) * 30 * 10)£2,999,000Series1C t = 174£1,999,000Thus the total discounted cost of further risk reductionmeasures would need to be below £174. Therefore, in thisexample, additional measures would be implemented if thetotal cumulative discounted cost over the plant/project life of30 years was below £174. This also demonstrates that thecalibration of the safety target, for the risk graph used in thisexample, is very close to <strong>ALARP</strong>.£999,000-£1,0001.E- 5.E- 1.E- 5.E- 1.E- 5.E- 1.E- 5.E- 1.E- 5.E- 1.E- 5.E- 1.E- 5.E- 1.E-01 02 02 03 03 04 04 05 05 06 06 07 07 08 08Current Risk ReductionFigure 7a – Justified Cost of Further Measures / CurrentRisk ReductionIf the curve is plotted for a single fatality over the same rangeas in Figure 7b the scale of the justified cost of further riskreduction measures decreases, as would be expected, but theknee of the curve is identical.
Justified Cost ofFurther Measures£599,000£499,000Acceptable Risk = 1.0E-7Workers (VPF = £2.0 Million), 1 fatality, 30 year plant life, demand = 0.1/yrHowever, the approaches and methodology that have beendescribed are only one practitioner’s perspective. Thepurpose of this paper is to stimulate discussion and promotethe need for further guidance on <strong>ALARP</strong> from a <strong>Safety</strong><strong>Instrumented</strong> <strong>Systems</strong> perspective.£399,000£299,000£199,000£99,000-£1,0001.E- 5.E-01 021.E-025.E-031.E-035.E-041.E-045.E-051.E-055.E-06Current Risk Reduction1.E-065.E-071.E-075.E-081.E-08Series1References[6] American Institute of Chemical Engineers Centre forChemical Process <strong>Safety</strong>, Layer of Protection AnalysisSimplified Process Assessment, 2001.[3] BS IEC 61511-3: “Functional safety - <strong>Safety</strong> <strong>Instrumented</strong><strong>Systems</strong> for the process industry sector –Part 3”:Guidance for the determination of the required safetyintegrity levels. (2003).Figure 7b – Justified Cost of Further Measures / CurrentRisk ReductionIt would appear to make a great deal of sense to plot a curvelike Figures 7a and 7b, in preparation for a risk assessmentexercise. It then only requires a simple cross check todetermine the justifiable cost of further risk reductionmeasures to comply <strong>with</strong> the <strong>ALARP</strong> principles. Ideally, the<strong>Safety</strong> Target would be set to a value low down in the knee ofthe curve so that the outcome of the risk assessment wouldthen deliver SIL requirements meeting <strong>ALARP</strong> principles.Similar curves can be plotted to take account of theappropriate level of VPF for hazards that put the public atrisk.[2] European Seveso Directive, 1982 (Council Directive81/501/EEC) reviewed 1996 and adopted as Seveso IIDirective.[5] HMSO Statutory Instruments 1999 No. 743. “TheControl of Major Accident Hazards Regulations 1999(COMAH)” - ISBN 0 11 082192 0.[4] HSE document: “Reducing Risks, Protecting People(R2P2)”. (2001) - ISBN: 07176 21 51 0.[1] C Timms – “Determination of <strong>Safety</strong> Integrity LevelsTaking into Account <strong>ALARP</strong>- Cost Benefit Analysis”presented at the Hazards XIX conference March 2006.8 DiscussionThere is a considerable gap between the current guidance on<strong>ALARP</strong>, which is concerned <strong>with</strong> total annual risk from allhazards, and the situation facing designers of functions <strong>with</strong>insafety instrumented systems protecting against single hazards.Designers are currently forced to develop their own rationalefor implementing SIS to meet the <strong>ALARP</strong> principles forprotection against single hazards.This paper has made suggestions for setting tolerable risktargets, or <strong>Safety</strong> Targets, for single hazards, and it has alsoindicated how these can then be developed to demonstrate<strong>ALARP</strong> through cost benefit analysis. Methodology has beenproposed for assessing the difference between the proposed,or current, risk reduction measures, and what would thejustifiable cost of additional risk reduction measures, in<strong>ALARP</strong> terms.It has also been demonstrated that there is no need forextensive cost benefit analysis providing the risk assessment,and subsequent design is undertaken to suitably set tolerablerisk levels.