Vantage Pro Console Manual - Davis Instruments Corp.
Vantage Pro Console Manual - Davis Instruments Corp.
Vantage Pro Console Manual - Davis Instruments Corp.

Create successful ePaper yourself
Turn your PDF publications into a flip-book with our unique Google optimized e-Paper software.
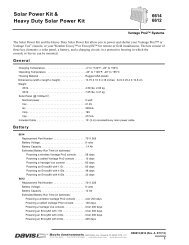
9DQWDJH3UR Š:HDWKHU6WDWLRQ&RQVROH0DQXDO3URGXFW &
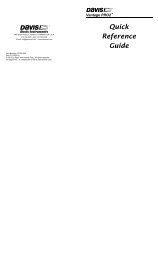
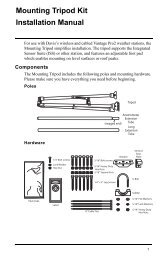
9DQWDJH3UR&RQVROH'LVSOD\)HDWXUHV2 3456WINDNWNNEGRAPHpm2nd71WETEMP OUTFHUM OUTBAROMETERhPa8SWLast 24 hrsMPHSESEvery 1 hrTEMP INFHUM INCHILLF14DAILYRAIN RATE913Vertical Scale:X10inSTATION NO.1in/hr1211101. Compass Rose2. Graph & Hi/Low Mode Settings3. Forecast Icons4. Moon Phase Indicator5. Time / Sunrise Time6. Date / Sunset Time7. 2ND Button Indicator8. Barometric Trend Arrow9. Graph Icon10. Current Rain Icon11. Station Number Indicator12. Weather Ticker13. Graph Field14. Alarm icon© <strong>Davis</strong> <strong>Instruments</strong> <strong>Corp</strong>. 2001-2003. All rights reserved.<strong>Vantage</strong> <strong>Pro</strong> <strong>Console</strong> <strong>Manual</strong>Rev. C, October 23, 2003Document Part Number: 07395.134<strong>Pro</strong>duct # 6310 & 6310CThis product complies with the essential protection requirements of the EC EMCDirective 89/336/EC.DriveRight is a registered trademark of <strong>Davis</strong> <strong>Instruments</strong> <strong>Corp</strong>., Hayward, CA.Information in this document subject to change without notice.
LLHighs and Lows Mode . . . . . . . . . . . . . . . . . . . . . . . . . . . . . . . . . . . . . . . . . 31Viewing Highs and Lows . . . . . . . . . . . . . . . . . . . . . . . . . . . . . . . . . . 32Alarm Mode . . . . . . . . . . . . . . . . . . . . . . . . . . . . . . . . . . . . . . . . . . . . . . . . . . 32Three Special Alarms . . . . . . . . . . . . . . . . . . . . . . . . . . . . . . . . . . . . 33Setting Alarms . . . . . . . . . . . . . . . . . . . . . . . . . . . . . . . . . . . . . . . . . 33Setting the Time Alarm . . . . . . . . . . . . . . . . . . . . . . . . . . . . . . . . . . . 34Clearing Alarm Settings . . . . . . . . . . . . . . . . . . . . . . . . . . . . . . . . . . 34Silencing Alarms . . . . . . . . . . . . . . . . . . . . . . . . . . . . . . . . . . . . . . . . 34Graph Mode . . . . . . . . . . . . . . . . . . . . . . . . . . . . . . . . . . . . . . . . . . . . . . . . . 35Viewing Graphs . . . . . . . . . . . . . . . . . . . . . . . . . . . . . . . . . . . . . . . . 354. Troubleshooting & Maintenance . . . . . . . . . . . . . . . . . . . . . . . . . . . . . . 39<strong>Vantage</strong> <strong>Pro</strong> Troubleshooting Guide . . . . . . . . . . . . . . . . . . . . . . . . . . . . . . . 39Troubleshooting Reception <strong>Pro</strong>blems . . . . . . . . . . . . . . . . . . . . . . . . 41<strong>Console</strong> Diagnostic Screen . . . . . . . . . . . . . . . . . . . . . . . . . . . . . . . 42<strong>Console</strong> Firmware Versions . . . . . . . . . . . . . . . . . . . . . . . . . . . . . . . 43<strong>Console</strong> Maintenance . . . . . . . . . . . . . . . . . . . . . . . . . . . . . . . . . . . . . . . . . . 43Changing Batteries . . . . . . . . . . . . . . . . . . . . . . . . . . . . . . . . . . . . . . 43Contacting <strong>Davis</strong> Technical Support . . . . . . . . . . . . . . . . . . . . . . . . . . . . . . . 44One Year Limited Warranty . . . . . . . . . . . . . . . . . . . . . . . . . . . . . . . . . . . . . 44Appendix A: Weather Data . . . . . . . . . . . . . . . . . . . . . . . . . . . . . . . . . . . . 45Wind . . . . . . . . . . . . . . . . . . . . . . . . . . . . . . . . . . . . . . . . . . . . . . . . . . . . . . . 45Temperature . . . . . . . . . . . . . . . . . . . . . . . . . . . . . . . . . . . . . . . . . . . . . . . . . 45Apparent Temperatures . . . . . . . . . . . . . . . . . . . . . . . . . . . . . . . . . . . . . . . . 45Wind chill . . . . . . . . . . . . . . . . . . . . . . . . . . . . . . . . . . . . . . . . . . . . . 45Heat Index . . . . . . . . . . . . . . . . . . . . . . . . . . . . . . . . . . . . . . . . . . . . 45Temperature/Humidity/Sun/Wind (THSW) Index . . . . . . . . . . . . . . . 46Humidity . . . . . . . . . . . . . . . . . . . . . . . . . . . . . . . . . . . . . . . . . . . . . . . . . . . . 46Dew Point . . . . . . . . . . . . . . . . . . . . . . . . . . . . . . . . . . . . . . . . . . . . . . . . . . . 46Rain . . . . . . . . . . . . . . . . . . . . . . . . . . . . . . . . . . . . . . . . . . . . . . . . . . . . . . . . 47Barometric Pressure . . . . . . . . . . . . . . . . . . . . . . . . . . . . . . . . . . . . . . . . . . . 47Solar Radiation . . . . . . . . . . . . . . . . . . . . . . . . . . . . . . . . . . . . . . . . . . . . . . . 47UV (Ultra Violet) Radiation . . . . . . . . . . . . . . . . . . . . . . . . . . . . . . . . . . . . . . 48UV MEDs . . . . . . . . . . . . . . . . . . . . . . . . . . . . . . . . . . . . . . . . . . . . . 48UV Index . . . . . . . . . . . . . . . . . . . . . . . . . . . . . . . . . . . . . . . . . . . . . . 49Evapotranspiration (ET) . . . . . . . . . . . . . . . . . . . . . . . . . . . . . . . . . . . . . . . . 50Leaf Wetness . . . . . . . . . . . . . . . . . . . . . . . . . . . . . . . . . . . . . . . . . . . . . . . . 50Soil Moisture . . . . . . . . . . . . . . . . . . . . . . . . . . . . . . . . . . . . . . . . . . . . . . . . . 50Time . . . . . . . . . . . . . . . . . . . . . . . . . . . . . . . . . . . . . . . . . . . . . . . . . . . . . . . 50Appendix B: Specifications . . . . . . . . . . . . . . . . . . . . . . . . . . . . . . . . . . . . 51<strong>Console</strong> Specifications . . . . . . . . . . . . . . . . . . . . . . . . . . . . . . . . . . . . . . . . . 51Wireless Transmission Specifications . . . . . . . . . . . . . . . . . . . . . . . . . . . . . . 51<strong>Console</strong> Data Display Specifications . . . . . . . . . . . . . . . . . . . . . . . . . . . . . . 52Weather Data Specifications . . . . . . . . . . . . . . . . . . . . . . . . . . . . . . . . . . . . . 53
:(/&20(729$17$*(352Welcome to your <strong>Vantage</strong> <strong>Pro</strong> ® Weather Station console. The consoledisplays and records your station’s weather data, provides graphing andalarm functions, and interfaces your weather data to a computer using ouroptional WeatherLink software.<strong>Vantage</strong> <strong>Pro</strong> stations are available in two basic versions: Cabled andWireless. A Cabled <strong>Vantage</strong> <strong>Pro</strong> station transmits outside sensor data fromthe Integrated Sensor Suite (ISS) to the console using a standard fourconductorcable. A Wireless <strong>Vantage</strong> <strong>Pro</strong> station transmits outside sensordata from the ISS to the console via a low-power radio. Wireless stations canalso collect data from the optional <strong>Vantage</strong> <strong>Pro</strong> stations listed on page 3.The <strong>Vantage</strong> <strong>Pro</strong> Quick Reference Guide included with your station providesan easy to use reference for most console functions.<strong>Console</strong> FeaturesKeyboard & DisplayThe keyboard lets you view current and historical data, set and clear alarms,change station modes, enter calibration numbers, set up and view graphs,select sensors, and read the forecast. The keyboard consists of 12command keys located next to the screen console and four navigation keyslocated below the command keys.A weather variable or console command is printed on each command key.Just press a key to select the variable or function printed on that key.Each command key also has a secondary function which is printed abovethe key on the console case. To select the secondary function, press andrelease the 2ND key (on the front of the console, upper right corner) andthen immediately press the key for that function.
1. Welcome to <strong>Vantage</strong> <strong>Pro</strong>Note: After pressing the 2ND key, the screen displays the 2ND icon for threeseconds. All secondary key functions are enabled during this time. Keys resumenormal operation after the icon disappears.2 NDThe the +, - , navigation keys are used to select command options,adjust values, and to provide additional functions when used in combinationwith a command key.To learn more about the keyboard, see “Selecting Weather Variables” onpage 21.<strong>Console</strong> ModesThe <strong>Vantage</strong> <strong>Pro</strong> console operates in five different modes:TABLE 1-1: CONSOLE OPERATING MODESModeSetupCurrent DataHigh/LowAlarmGraphDescriptionUse Setup mode to enter the time, date, and other information required to calculateand display weather data.Use Current Data mode to read the current weather information, change measurementunits, and to set, clear or calibrate weather readings.High/Low mode displays the daily, monthly or yearly high and low readings.Alarm mode allows you to set, clear, and review alarm settings.Graph mode displays your weather data using over 100 different kinds of graphs.<strong>Vantage</strong> <strong>Pro</strong> OptionsOptional Sensors<strong>Vantage</strong> <strong>Pro</strong> stations are extremely flexible. Use the following optionalsensors and wireless stations to enhance the weather monitoringcapabilities of your <strong>Vantage</strong> <strong>Pro</strong>. See our website for complete details:www.davisnet.com.Note: Optional wireless stations can only be used with Wireless <strong>Vantage</strong> <strong>Pro</strong> Stations.Wireless Weather Envoy (#6314)The Wireless Weather Envoy performs much of the same functions as a<strong>Vantage</strong> <strong>Pro</strong> console, but in a much smaller package. Use Envoy to interfaceyour wireless station to a computer when you’d rather place the console in abetter location for viewing weather conditions.Anemometer Transmitter Kit (#6330)<strong>Pro</strong>vides more flexible anemometer placement for wireless stations.Wireless Leaf & Soil Moisture/Temperature Station (#6343)Measures and transmits leaf wetness, soil moisture and temperature data.
<strong>Vantage</strong> <strong>Pro</strong> OptionsWireless Soil Moisture/Temperature Station (#6361)Measures and transmits soil moisture and temperature data.Wireless Temperature Station (#6370)Measures and transmits temperature data.Wireless Temperature/Humidity Station (#6380)Measures and transmits air temperature and humidity data.Wireless Temperature/Humidity Station with Fan-Aspirated RadiationShield (#6385)Measures and transmits air temperature and humidity data. Uses our patentedfan-aspirated radiation shield for much more accurate readings.Solar Radiation Sensor (# 6450)Measures solar radiation. Required for calculating evapotranspiration (ET).Available for cabled and wireless stations. Requires Sensor Mounting Shelf(#6672).Ultraviolet (UV) Radiation Sensor (#6490)Measures UV radiation. Required for calculating the UV dose. Available forCabled and Wireless stations. Requires Sensor Mounting Shelf (#6672).Optional WeatherLink Š SoftwareOur WeatherLink software and data logger connect your <strong>Vantage</strong> <strong>Pro</strong> stationdirectly to a computer, providing enhanced weather monitoring capabilitiesand powerful internet features. The WeatherLink data logger fits neatly onthe console and stores weather data even when the computer is turned off.WeatherLink ® for <strong>Vantage</strong> <strong>Pro</strong>, Windows version (#6510C)Requires computer running Windows 95, 98, 2000, ME, NT or XP and onefree serial port. Includes data logger, eight foot cable, software, and manual.WeatherLink ® for <strong>Vantage</strong> <strong>Pro</strong>, Mac version (#6520C)Requires a Macintosh computer running OS X 10.01 or newer and a USB-toserial(DB-9) Cable (#8434) or third-party USB-to-serial port adapter.Includes data logger, eight foot cable, 9-pin DIN connector, software, andmanual.Optional AccessoriesThe following accessories are available from your dealer or may be ordereddirectly from <strong>Davis</strong> <strong>Instruments</strong>.
1. Welcome to <strong>Vantage</strong> <strong>Pro</strong>Sensor Mounting Shelf (#6672)Required for mounting the optional Solar Radiation and/or UV sensors. Themounting shelf attaches to the ISS.Car/Boat/RV Lighter Cord (#6604)Allows the <strong>Vantage</strong> <strong>Pro</strong> to draw power from a standard car cigarette lighter.USB-to-Serial (DB-9) Cable (#8434)Allows WeatherLink to connect to a USB port on your computer.Telephone Modem Adapter (#6533)Allows a dialup connection between the station and the computer.Extension Cables (#7876)Allows you to place the Cabled <strong>Vantage</strong> <strong>Pro</strong> ISS further away from the console.Maximum cable length is 1000’ feet (300 m).• #7876-040 Cable, 40’ (12 m)• #7876-100 Cable, 100’ (30 m)• #7876-200 Cable, 200’ (61 m)<strong>Davis</strong> Baseball Cap (#PR725)100% cotton twill cap is two-toned with awashed khaki crown, dark blue brim, andembroidered <strong>Davis</strong> logo. Self-fabric closure withbrass buckle. One size fits all.
,167$//,1* 7+(& 2162/(The <strong>Vantage</strong> <strong>Pro</strong> console is designed to give extremely accurate readings.As with any precision instrument, use care in its assembly and handling.Although installing the console is relatively simple, following the steps outlinedin this chapter and assembling the <strong>Vantage</strong> <strong>Pro</strong> correctly from the startwill help ensure that you enjoy all of its features with a minimum of time andeffort.Powering the <strong>Console</strong>Cabled <strong>Vantage</strong> <strong>Pro</strong> StationsCabled <strong>Vantage</strong> <strong>Pro</strong> consoles supply power to the Integrated Sensor Suite(ISS) through the console cable. Because of the added power consumptionof the ISS, the cabled console requires an AC power adapter or optionalCar/Boat/RV Lighter Cord for the main power supply. The console batterieswill provide backup power for up to four to six weeks.Wireless <strong>Vantage</strong> <strong>Pro</strong> StationsWireless <strong>Vantage</strong> <strong>Pro</strong> consoles have been optimized to reduce power consumptionand do not require the use of an AC adapter. You may use theincluded adapter if you wish, but the three C-cell batteries should power awireless console for up to one year.WARNING: Be sure to use the power adapter supplied with your <strong>Vantage</strong> <strong>Pro</strong> <strong>Console</strong>. Your console maybe damaged by connecting the wrong power adapter.Note: The console does not recharge the batteries. Because of this, and because NiCad batteries willnot power the console as long as alkaline batteries, we recommend using alkaline batteries inyour console.
2. Installing the <strong>Console</strong>Installing the AC Power Adapter1. Find the power jack located on the bottom of the console case.Power PlugWrap Cord Around Pins2. Insert the power adapter plug into the console power jack then plug theother end of the adapter into an appropriate power outlet.3. Check to make sure the console runs through a brief self-test proceduresuccessfully. The console will display all the LCD segments and thenbeep twice.4. After power-up the console automatically enters Setup mode. Setupmode guides you through steps required to configure the station. See“Setup Mode” on page 11 for more information.Installing Batteries1. Remove the battery cover located on the back of the console by pressingdown on the two latches at the top of the cover.BatteryBatteryBattery2. Insert three C batteries into the battery channel, negative (or flat) terminalfirst.
Connecting Cabled Stations3. Replace the battery cover.Note: To remove old batteries, see “Changing Batteries” on page 43.Connecting Cabled StationsCabled <strong>Vantage</strong> <strong>Pro</strong> stations come with 100 feet (30m) of cable. Maximumcable length from ISS to console is 1000 feet. See “Optional Accessories” onpage 3 to purchase additional cable.1. Gently insert the console end of the 4-conductor wire into the consolereceptacle marked “ISS” until it clicks into place.To ISSWARNING: Do not force the connector into the receptacle.2. Ensure that the ISS cable is not twisted through the access hole.Note: The ISS must be assembled and powered before you can test the console connection.3. Test the connections between the ISS and the console.Spin the wind cups and change the direction of the vane. If the ISS ispowered and the connection between the ISS and the console is correct,you should see the wind direction and speed fields changing. Tip the rainbucket back and forth. You should see rain registering. Also check theoutside temperature and outside humidity readings, as well as readingsfor the optional solar and UV sensors, if installed in your station.Note: If you are installing a wireless station, you will be checking communications between yourconsole, ISS and any optional wireless stations when you perform the Setup Mode instructionslocated in the next chapter. See “Setup Mode” on page 11.
2. Installing the <strong>Console</strong><strong>Console</strong> LocationYou should place the console in a location where the keyboard is easilyaccessible and the display is easy to read. For more accurate readings, followthese suggestions:• Avoid placing the console in direct sunlight. This may causeerroneous inside temperature and humidity readings and maydamage to the unit.• Avoid placing the console near radiant heaters or heating and airconditioning ducts.• If you are mounting the console on a wall, choose an inner or interiorwall. Avoid walls that heat up or cool down depending on the weather.• If you have a wireless console, be aware of possible interference fromcordless phones and other devices. To prevent interference, maintaina distance of 10 feet between the <strong>Vantage</strong> <strong>Pro</strong> console and a cordlessphone (handset and base).• Avoid positioning a wireless console near large metallic surfaces suchas beside a refrigerator.
<strong>Console</strong> LocationTable & Shelf PlacementThe console kickstand can be set tofive different angles providing five differentdisplay angles.1. Lean the kickstand out by pulling onits top edge.You’ll see the indentation for yourfinger at the top edge of the console.2. Slide the catch to arrest the kickstandin the appropriate angle.Choose low angles for display on acoffee table or other low area.Choose higher angles for display ona desk or shelf.3. Pull up on the stand to close it. It willbe a little tight, so it’s okay to push hard enough to get it to slide.4. Install the two roundrubber feet on thebottom of the console.5. Install the two rubberchannel feet on the kickstand.
2. Installing the <strong>Console</strong>Wall MountingThe console mounts to the wall using two keyholes located on the back ofthe case.To mount the console on a wall:1. Use a ruler to mark two mounting hole positions on the wall 8 inches (203mm) apart.8" (203mm)Drill two 3/32" or 7/64" (2.4 to 2.8mm) holes8" (203mm) apart for the #6 x 1" mounting screws.Note: Drawing not to scale.If you are installing a standard <strong>Vantage</strong> <strong>Pro</strong> console with sensor cablerunning inside the wall, mount the console over an empty switch box.2. Use an drill a 3/32 or 7/64” (2.5 mm) drill bit to drill two pilot holes for thescrews.3. Using a screwdriver, drive the two #6 x 1” pan head self-threading screwsinto the wall. Leave at least 1/8” (3 mm) between the wall the heads of thescrews.4. If the kickstand has been pulled out from the case, push it back into itsupright and locked position.5. Guide the two keyholes on the back of the console over the two screwheads.Wall Mounting the<strong>Console</strong>
86,1*
3. Using Your Weather StationScreen 1: Active TransmittersScreen 1 displays the message “Receiving from...” and shows the transmittersbeing received by the console. In addition, an “X” will blink in the lowerright-hand corner of the screen every time the console receives a datapacket from the ISS. The rest of the LCD screen will be blank.If you have a cabled station, or if your wireless ISS uses the factory settingsand you are receiving the signal, the screen displays “Receiving from stationNo. 1”. Any optional stations you are installing should also appear.Note: An ISS or optional station must be powered for the <strong>Console</strong> to recognize it. Refer to theinstallation instructions for the ISS or optional station for more information.STATION NO.1 41. Make a note of the station number(s) listed on the screen.2. Press DONE to move to the next screen.The console can receive signals from up to eight transmitters total, but thereis also a limit on the number of certain types of transmitters. Table 1 belowlists the maximum number for each type of transmitter:TABLE 3-1: MAXIMUM NUMBER OF TRANSMITTERSTransmitter TypeMaximum NumberIntegrated Sensor Suite (ISS) 1Anemometer Transmitter Kit 1Leaf & Soil Moisture/Temperature Station 1Soil Moisture/Temperature Station 1Temperature Station 8Temperature/Humidity Station 8SensorLink 1Screen 2: Configuring Transmitter IDs - Wireless OnlyNote: If you have a cabled station, you can press DONE and go to Screen 4: Time & Date.Setup screen 2 allows you to change the ISS transmitter ID and to add orremove optional transmitter stations. The default setting works fine for mostinstallations. The default transmitter ID setting is “1” (ISS).<strong>Vantage</strong> <strong>Pro</strong> Transmission IntervalsYou may also need to set an alternate transmission interval for an ISS(alternate interval = “.25X”), a Temperature Humidity Station (alternateinterval = “4X”) or Temperature Station (alternate interval = “4X”). A station
Setup Modemay need to use the alternate transmission interval if it is being substitutedfor another type of station or because of changes we have made to theproducts.ISS Transmitter ID Settings:• ISS Station used as an ISS: ISS• ISS Station used as a Temp/Hum Station: TEMP HUM and 4XTemperature/Humidity Station Transmitter ID Settings:• Temp/Hum Stations built before April 2003: TEMP HUM• Temp/Hum Stations built April 2003 or later: TEMP HUM & “4X.”• Temp/Hum Stations built before April 2003, used as an ISS station:ISS & “.25x”• Temp/Hum Stations built April 2003 or later, used as an ISS station:ISSTemperature Station Transmitter ID Settings:• Temperature Stations built before April 2003: TEMP• Temperature Stations built in April 2003 or later: TEMP HUM & “4X”.11. If you have a cabled station, or if you have a wireless station and areusing the default transmitter ID setting, press DONE to move to the nextscreen.Note: Typically, you can use the default transmitter ID setting of unless you are installing one of theoptional transmitter stations or unless a nearby neighbor has a <strong>Vantage</strong> <strong>Pro</strong> Station thatuses transmitter ID 1 for the ISS.2. Press the < and > keys to select the transmitter ID.When you select a transmitter ID, the ID number is displayed on thescreen as well as the current configuration.3. Press + or - to toggle console reception of signals from transmittersusing that ID ON and OFF.4. Press GRAPH to change the type of station assigned to each transmitternumber. Scroll through the station types - ISS, TEMP, HUM,TEMP HUM,WIND, LEAF, SOIL, LEAF/SOIL and SENSORLINK - until the correct typeappears.Note: Select SENSORLINK if the transmitter station is a Wireless Weather Monitor II or WirelessWeather Wizard II weather station.
3. Using Your Weather Station5. To change the transmission interval for a transmitter station, press andhold TEMP then press HI/LOW.The alternate interval for that station type is indicated on the screen:“.25X” or “4X”.6. Press DONE to move to the next screen.Screen 3: Retransmit - Wireless OnlyThe console can transmit data from the ISS and other outside sensors toother <strong>Vantage</strong> <strong>Pro</strong> consoles or to the <strong>Davis</strong> Weather Echo and WeatherEcho Plus.21. Press the +, -, > or STATION key to enable retransmit. The first availabletransmitter ID is automatically assigned.2. Press the + or - key to toggle retransmit ON and OFF.3. When retransmit has already been enabled, pressing > will change thetransmitter ID used for retransmit.4. Press DONE to move to the next screen.Screen 4: Time & DateThe very first time you power-up the console, the time and date are set to12:00am 1/1 2000. Be sure to enter the correct date and local time.amTo change the time and date:1. Press < and > to select the hour, minute, month, day or year. The selectedtime or date setting will blink on and off.2. To change a setting, press + or - to adjust the value up or down.
Setup Mode3. To choose a 12-hour or 24-hour clock, first select either the hour or minutesetting, then press 2ND and immediately press UNITS. This will switchthe console from one type of clock to the other.4. To choose a MM/DD or DD/MM display for the date, first select either theday or month setting, then press 2ND and immediately press UNITS. Thiswill switch the console from date display to the other.5. When you’re finished, press DONE to move to the next screen.Screen 5: LatitudeBe sure to enter the correct latitude. The console uses latitude along withlongitude to determine your location, allowing it to adjust the forecast andcalculate the times for sunset and sunrise.• Latitude measures distance north or south of the equator.• Latitude is used with longitude to identify your position on earth.• If you do not know your latitude and longitude, there are several waysto find out. Many atlases and maps include latitude and longitudelines. You can also talk to the reference department of your locallibrary, call your local airport, or search on the Internet. The moreaccurate you are, the better; however, a reasonable estimate willwork, too.1. Press < and > to move between fields.2. Press + and - to change the settings up or down.3. To select the Northern or Southern Hemisphere, press 2ND, then UNITS.4. Press DONE to move to the next screen.Screen 6: LongitudeBe sure to enter the correct longitude. The console uses longitude along withlatitude to determine your location, allowing it to adjust the forecast and calculatethe times for sunset and sunrise. See Screen 5: Latitude for informationon determining your longitude.• Longitude measures distance east or west of the Prime Meridian, animaginary line running north and south through Greenwich, England.• Longitude is used with latitude to identify your position on earth.
3. Using Your Weather Station1. Press < and > to move between fields.2. Press + and - to change the settings up or down.3. To select the Northern or Southern Hemisphere, press 2ND, then UNITS.4. Press DONE to move to the next screen.Screen 7: Time ZoneThe console is pre-programmed with a combination of US time zones andthe names of major cities representing time zones around the world. You canalso configure your time zone using the Universal Time Coordinate (UTC)offset.Note: UTC offset measures the difference between the time in any time zone and a standard time,set by convention as the time at the Royal Observatory in Greenwich, England. Hayward,California, the home of <strong>Davis</strong> <strong>Instruments</strong>, observes Pacific Standard Time. The UTC offset forPacific Standard Time is -8:00, or eight hours behind Universal Time (UT). When it’s 7:00 pm(1900 hours) UT, it’s 19 - 8 = 1100 hours, or 11:00 am in Hayward.1. Press + and - to cycle through time zones.2. If your time zone is not shown, press 2ND then press + and - to set yourUTC offset.3. Press DONE to select the time zone or UTC offset shown on the screenand move to the next screen.Screen 8: Daylight Savings SettingsIn most of North America, including Mexico (excepting Saskatchewan, EasternIndiana, Arizona, and Hawaii), as well as in Australia (excepting WesternAustralia, Northern Territory, and Queensland) and in Europe use the AUTODaylight Savings setting. The console is pre-programmed to use the correctstarting and stopping dates for Daylight Savings Time in these areas, basedon the time zone setting in screen 7.Weather stations located in areas not listed above should use the MANUALsetting.
Setup Mode1. Press + and - to choose Auto or <strong>Manual</strong>.2. Press DONE to move to the next screen.Screen 9: Daylight Savings StatusUse this screen to either verify the correct automatic Daylight Savings statusor to control Daylight Savings manually.1. If you have a MANUAL Daylight Savings setting, press + and - to turnDaylight Savings Time on or off on the appropriate days of the year.2. If you have an AUTO Daylight Savings setting, the console will display theappropriate setting based on the current time and date.3. Press DONE to move to the next screen.Screen 10: ElevationMeteorologists standardize barometric pressure data to sea level so that surfacereadings are comparable, whether they’re taken on a mountainside orby the ocean. To make this same standardization and ensure accurate readings,enter your elevation in this screen.If you do not know your elevation, there are several ways to find out. Manyatlases and almanacs include elevation for cities and towns. You can alsocheck with the reference department of your local library. The more accurateyou are, the better; but a reasonable estimate works too.1. Press < and > to move from one numeral in the elevation to another.2. Press + and - to adjust a numeral up or down.3. To switch between feet and meters, press 2ND then press UNITS.
3. Using Your Weather Station4. If you are below sea level, such as some places in California like DeathValley, first enter the elevation as a positive number. Then, select the “0”immediately to the left of the left most non-zero digit (the second zerofrom the left in 0026, for example, or the first zero from the left in 0207)and press + and - to switch from a positive to negative elevation.Note: You can only set the elevation to negative after you have entered a non-zero digit and whenthe zero in the position immediately to the left of the left-most non-zero digit has beenselected.5. Press DONE to move to the next screen.Screen 11: Wind Cup Size<strong>Vantage</strong> <strong>Pro</strong> Stations come standard with large wind cups. Switch this settingto small only if you have separately purchased and installed small windcups.Note: Large wind cups are more sensitive to low wind speeds and are the best choice for most users.Small wind cups are less sensitive at low wind speeds but can measure much higher windspeeds. Install small wind cups if you wish to measure winds over 150 mph (242 km/h).1. Press + and - to switch between large and small wind cups.2. Press DONE to move to the next screen.Screen 12: Rain CollectorThe tipping bucket in your <strong>Vantage</strong> <strong>Pro</strong> rain collector has been calibrated atthe factory to measure 0.01” of rain with each tip. Although the consoleprovides 0.01”, 0.1mm or 0.2 mm settings, the rain collector requires the0.01” setting to accurately measure rainfall.1. Press DONE to use the 0.01” setting and move to the next screen.Note: See “Metric Rain Collector Settings” on page 27 for instructions on how to set up your stationto display rain data in millimeters instead of inches.
Setup ModeScreen 13: Rain SeasonBecause rainy seasons begin and end at different times in different parts ofthe world, you must specify the month you wish your yearly rain data tobegin. January is the default.1. Press + and - to select the month for the start of the rainy season.2. Press DONE to move to the next screen.Screen 14: Serial Baud RateThe console uses the serial port to communicate with a computer. If you areconnecting the console directly to your computer, leave the setting at 19200,the highest rate for the port. If you’re using a modem, use the highest settingyour modem can handle.Note: The baud rate setting on your console must match the serial port setting in the software on yourcomputer. If you are using WeatherLink for <strong>Vantage</strong> <strong>Pro</strong>, refer to WeatherLink help forinstructions on setting the serial port baud rate on your computer.Note: The console must be equipped with a WeatherLink data logger in order to communicate with acomputer.Serial Port Baud Rate 192001. Press + and - to select the baud rate.<strong>Vantage</strong> <strong>Pro</strong> supports baud rates of 1200, 2400, 4800, 9600, 14400, and19200.2. You have completed the console setup. To exit Setup Mode, press andhold DONE until the current weather screen appears.
3. Using Your Weather StationClear All CommandAfter you have completed the above setup procedures and have exited theSetup Mode, please use the Clear All command before putting your weatherstation into service.Note: The Clear All command clears all stored high and low weather data including monthly andyearly highs and lows and clears the alarm settings.1. Press the WIND key on the console.2. Press the 2ND key, then press and hold the CLEAR key for at least sixseconds.3. Release the CLEAR key when you see the following message displayedat the bottom of the console’s screen: “CLEARING NOW”.Current Weather ModeThe Current Weather Mode displays the current data readings from your station,select units of measure, and also to calibrate, set or clear weather variables.You can see up to ten weather variables on the screen at the sametime, as well as the time and date, the moon and forecast icons, a forecastor special message from your station, and a graph of the currently selectedvariable. A few variables are always visible on the console screen whilemost variables shared their location with one or more other variables. Youcan select any variable not currently on the screen to display it.Selecting Weather VariablesSelect a weather variable to display it’s data on the screen if it isn’t alreadyvisible or to graph the variable in the Current Weather Mode screen.Weather variables are selected via the console command keys:• If the variable is printed on a key, just press the key to select thevariable.• If the variable is printed on the console housing, first press andrelease the 2ND key, then quickly press the key below the variable toselect it.Note: After pressing the 2ND key, the screen displays the 2ND icon for threeseconds. Command key secondary functions are enabled during this time. Thekeys return to normal operation after the icon disappears.2 ND• You can also select any variable currently displayed on the LCDscreen using the +, - , navigation keys. Push + to move upthe screen. Push - to move down the screen. Push < to move left andpush > to move right.• The console places a graph icon on the screen to indicatethe currently selected variable.
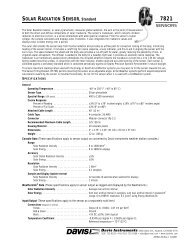
Last 24 hrsVertical Scale:Every 1hrX10Current Weather ModeWINDNTEMP OUTFTEMP INFNWNEWEWINDNWWNNEETEMP OUTFHUM OUTpmBAROMETERhPaSWMPHSSEMPHSWSESTEMP INFDAILY RAINHUM INRAINFHEAT INDEXYEARinSTATION NO.1inWind Speed and DirectionPress WIND to select wind speed. Wind speed may be displayedin miles per hour (mph), kilometers per hour (km/h),meters per second (m/s), and knots (knots). The 10 minuteCHILLWINDaverage wind speed will be displayed in the ticker. (See item 12, “WeatherTicker”, on the Inside Front Cover)A solid arrow within the compass rose indicates the currentwind direction. Arrow caps indicate up to six different 10-minute dominant wind directions to provide a history of thedominant wind directions for the past hour.Press WIND a second time to display the wind direction indegrees instead of the wind speed. Each additional WINDkey press toggles the display between wind speed and wind direction indegrees.Outside and Inside TemperaturePress the TEMP key to select outside temperature. Temperaturemay be displayed in degrees Fahrenheit (ºF) or Centigrade(ºC).Press the TEMP key again to select inside temperature.HEATTEMP
3. Using Your Weather StationHUM INHUM OUTBAROMETERhPaWINDNWWNNEETEMP OUTFHUM OUTpmBAROMETERhPaDEW POINTFSWLast 24 hrsMPHSESEvery 1 hrTEMP INFHUM INFHEAT INDEXDAILY RAINRAINYEARVertical Scale:X10inSTATION NO.1Humidity, Pressure, Dew Point, & WindChillinCHILLFHumidityPress the HUM key to select outside humidity. Pressing theHUM key a second time selects inside humidity. Humidity isdisplayed in percent relative humidity.Wind ChillPress the 2ND key then press the CHILL key to selectWind Chill. Wind Chill is displayed in either degreesFahrenheit (ºF) or Centigrade (ºC).DEW PTHUMCHILLWIND2 ND DEW PTNote: The console uses the ten-minute average wind speed to calculate wind chill.Dew PointPress the 2ND key then press the DEW PT key toselect Dew Point. Dew Point is displayed in eitherdegrees Fahrenheit (ºF) or Centigrade (ºC).HUM2 ND ETBarometric PressurePress the BAR key to select barometric pressure. Barometricpressure may be displayed in inches (in), millimeters(mm), millibars (mb) or hectoPascals (hPa).BARPressure TrendThe pressure trend arrow indicates the current barometric trend,measured over the last 3 hours. The pressure trend requires threehours of data in order to be calculated so you won’t see it right awayon a new station. The pressure trend is always indicated on the consolescreen, as long as required data is available.
Current Weather ModeWINDNWNNEpmTEMP OUTHUM OUTBAROMETERWEFhPaSWLast 24 hrsMPHSEvery 1SEhrTEMP INFUVindexTHSWFINDEXVertical Scale:X10DAILY RAINinSTATION NO.1RAINYEARinFHEAT INDEXUVindexTHSWFINDEXDaily Rain, Rain Storm, Rain Year, Rain Month, & Rain RateUV (Ultraviolet Radiation)Press the UV key to display the current UV Index. Pressagain to see MEDS. See “Apparent Temperatures” onpage 45.SUNUVNote: Requires a UV sensor. (See “Optional Sensors” on page 2)Heat IndexPress the 2ND key then press HEAT to display theHeat Index. See “Apparent Temperatures” onpage 45.HEATTEMPTHSW Index2 ND HEAT2 ND TEMPAfter you have selected the Heat Index, pressthe 2ND key then press HEAT again to selectthe Temperature Humidity Sun Wind (THSW) Index. The THSW Index isonly available on stations equipped with a solar radiation sensor. See“Apparent Temperatures” on page 45.The Heat Index and the THSW Index appear in the same place on thescreen and are displayed in degrees Fahrenheit (ºF) or Centigrade (ºC).
NWSWLast 24 hrsVertical Scale:MPHEvery 1NESEhrX10FFinpmhPainFHEAT INDEX3. Using Your Weather StationRAIN STORMRAINYEARDaily Rain, RainStorm, RainYear, RainMonth, & RainRateWIND NWESinTEMP OUT HUM OUT BAROMETERTEMP INHUM INDAILY RAINRAIN YEARSTATION NO.1RAINinMOinDAILY RAINRAIN RATEinin/hrRain RateRAIN DAYPress the RAINYR key to display the current rain rate.RAINYRRain Rate may be displayed as either inches per hour (in/hr) or millimeters per hour (mm/hr). Rain Rate will show zero and theumbrella icon will not appear until 0.02 in (.508mm) of rain falls within a 15–minute period.Month-to-date precipitationRAIN DAYPress the RAINYR again to select the month-to-date precipitationrecord. Monthly rain displays the precipitationRAINYRaccumulated since the calendar month began. Month-to-date precipitation isdisplayed in inches (in) or millimeters (mm).Year-to-date precipitationRAIN DAYPress the RAINYR key a third time to display the year-todateprecipitation record. Yearly rain displays the precipi-RAINYRtation accumulated since the 1st of the month you’ve chosen in Setup Mode(See “Screen 13: Rain Season” on page 19.) Year-to-date precipitation isdisplayed in inches (in) or millimeters (mm).Note: The “Year-to-date” and “Month-to-date” registers record precipitation accumulation for one yearand one month respectively; however, you may start each counting period whenever you wish.Daily RainPress and release the 2ND key, then press theRAINDAY key. Daily Rain displays the rain accumulatedsince 12 midnight. Any rain accumulated in the last 24 hours will bedisplayed in the ticker.Rain StormRain Storm displays the rain total of the last rainevent. It takes two rain clicks to begin a storm eventand 24 hours without rain to end a storm event.LAMPS2 NDLAMPS2 NDRAIN DAYRAINYRRAIN DAYRAINYRPress and release the 2ND key, then press the RAINDAY key. Rain Stormwill only increment after 0.02 in (.508mm) rain. Rain accumulation may bedisplayed as either millimeters (mm) or inches (in).
Current Weather ModeSUNWINDNWNNEYEAR GRAPHpmW/m 2TEMP OUTHUM OUTBAROMETERWEFhPaSWLast 24 hrsMPHSESEvery 1 hrTEMP INFHUM INFHEAT INDEXETYEARVertical Scale:X10DAILY RAINinSTATION NO.1RAINYEARinmmETETMOmmmmSolar Radiation, Current ET, ET Month & ET YearSolar RadiationLAMPS SUNPress and release the 2ND key, then press the 2 ND UVSUN key to display the current solar radiationreading. Solar radiation is displayed as Watts per square meter (W/m 2 ).Note: Requires a solar radiation sensor. (See “Optional Sensors” on page 2)Current Evapotranspiration (ET)Press and release the 2ND key, then press the ETkey to display the current evapotranspiration reading.ETBAR2 ND FORECASTMonthly Evapotranspiration (ET)Press the 2ND key then press the ET key, then repeat this key sequenceagain to display Monthly ET.Yearly Evapotranspiration (ET)Press the 2ND key then press the ET key, then repeat this key sequence twomore times to display the ET reading since January 1st of the current year.Note: Requires a solar radiation sensor. (See “Optional Sensors” on page 2)Displaying the ForecastYour console generates a weather forecast based on the barometric reading& trend, wind speed & direction, rainfall, temperature, humidity, latitude &longitude, and time of year. Included in the forecast is of a prediction of thesky condition (sunny, cloudy, etc.) and changes in precipitation, temperature,wind direction or wind speed.Press the 2ND key then press the FORECASTkey to display the forecast.Note: The forecast is updated once an hour, on the hour.2 NDTIME
Current Weather ModeMetric Rain Collector SettingsUse the following procedures to set up your <strong>Vantage</strong> <strong>Pro</strong> station to displayrain data in millimeter. See “Rain” on page 47 for more information.Note: <strong>Vantage</strong> <strong>Pro</strong> stations measure rain in 0.01 inch increments and also store rain data in inchunits. When you select metric units for rain data, the logged data is converted from inches tomillimeters at the time it is displayed.<strong>Console</strong> Setup: Rain Collector Settings1. Enter Setup Mode by pressing DONE and - at the same time.2. Press DONE repeatedly until you see the Rain Collector setup screen.The rain collector should be set to 0.01 inch.3. If necessary, press + or - to change the setting to 0.01”.The rain collector tipping bucket is calibrated at the factory to measure0.01” of rain with each tip. The 0.1mm and 0.2 mm settings will notprovide accurate rain measurements.4. Exit Setup Mode by pressing and holding DONE until the CurrentWeather screen appears.To Display Rain in Metric Units on the <strong>Console</strong>1. Press the RAINYR key to display the current rain rate.Selecting Metric units for one rain variable will also setall the other rain variables to Metric units.2. Press and release the 2ND key.3. Press the UNITS key once.The units used to display Rain data will toggle betweeninches and millimeters each time you repeat this keysequence.RAIN DAYRAINYRLAMPS2 NDUNITSGRAPHTo Display Rain in Metric Units in WeatherLinkRefer to WeatherLink Help for instructions required to set the rain collector to0.01” and to select millimeters as the unit for rain.Calibrating, Setting, and Clearing VariablesTo fine-tune your station, you can calibrate most of the weather variables.For example, if your outside temperature seems consistently too high or toolow, you can enter an offset to correct the deviation.
3. Using Your Weather StationCalibrating Temperature And HumidityYou can calibrate inside and outside temperature, inside and outside humidity,as well as any extra temperature or humidity sensors you have transmittingto <strong>Vantage</strong> <strong>Pro</strong>.1. Select the variable to be calibrated.See “Selecting Weather Variables” on page 20.2. Press and release 2ND, then press and hold SET.After a moment, the variable you’ve selected will begin to blink. Keepholding the SET key until the Calibration Offset message appears in theticker.Note: The ticker displays the current calibration offset.3. Press + and - to add to or subtract from the temperature offset value.Inside and outside temperature are calibrated in 0.1 °F or 0.1 °Cincrements, up to a maximum offset of +12.7 (°F or °C) and a minimumoffset of -12.8 (°F or °C). The variable will change value and the ticker willshow the offset you’ve entered.4. When you are finished, press DONE to exit calibration.Calibrate Wind Direction ReadingYou can use this procedure to correct your the anemometer reading. This isuseful if the anemometer does not point North in your installation.1. Check the current direction of the wind vane on the anemometer.Compare it to the wind direction reading on the console. If the wind vaneis pointing south, for instance, the wind direction reading on the screenshould be 180°.• If the wind direction reading is greater than 180°, subtract 180 fromthe reading and subtract the amount of the offset from the winddirection reading.• If the wind direction reading is less than 180°, subtract the readingfrom 180 and add the amount of the offset to the wind directionreading.2. Press WIND as necessary to display the wind direction in degrees.3. Press and release 2ND, then press and hold SET.The wind direction variable will begin to blink.4. Continue holding the key until the CAL message appears in the ticker.Note: The ticker displays the current wind direction calibration value.5. Press < or > to select digits in the anemometer’s current reading.6. Press + and - to add to or subtract from the anemometer reading.7. Repeat steps 4 and 5 until you have entered the offset value from Step 1.8. When you are finished, press DONE to exit calibration.
Current Weather ModeCalibrating Barometric PressureNote: Before calibrating the barometric pressure, be sure the station is set to the correct elevation.1. Press BAR to select barometric pressure.2. Press and release 2ND, then press and hold SET.The pressure variable will blink.3. Continue holding the key until the ticker reads “set barometer...”.4. Press < or > to select digits in the variable.5. Press + and - to add to or subtract from the digit’s value.6. When you are finished, press DONE to exit calibration.Setting Weather VariablesTo set a weather variable’s value:1. Select the variable you wish to change.2. Press and release 2ND, then press and hold SET.The variable will blink.3. Keep holding the key until all digits are lit and only one digit is blinking.4. Press < or > to select digits in the value.5. Press + and - to add to or subtract from the selected digit.6. When you are finished, press DONE to exit.You can set values for the following weather variables:Daily rainThis sets the daily rain total. Monthly and yearly rain totals are updated.Monthly rainThis sets the current months total rain. Does not affect yearly rain total.Yearly rainThe sets the current year’s rain total.Daily ETThis sets the daily ET total. Monthly and yearly ET totals are updated.Monthly ETThis sets the current month’s ET. Does not affect yearly total.Yearly ETThis sets the current year’s total ET.
3. Using Your Weather StationClearing Weather VariablesTo clear a single weather variable:1. Select the weather variable.See “Selecting Weather Variables” on page 20.2. Press and release 2ND, then press and hold CLEAR.The variable you’ve chosen will blink. Keep holding the key until the valuechanges to zero or, in the case of the barometer, the raw barometer value.Clear All CommandThis command clears all stored high and low weather data including monthlyand yearly highs and lows and clears alarm settings all at once:1. Press the WIND key on the console.2. Press the 2ND key, then press and hold the CLEAR key for at least sixseconds.3. Release the CLEAR key when you see the following message displayedat the bottom of the console’s screen: “CLEARING NOW”.You can clear the following weather variables:BarometerClearing the barometer value clears (a) any pressure offset used to calibratethe station, and (b) the elevation entry.Daily rainClearing the daily rain value will be reflected in the daily rain total, the last 15minutes of rain, the last three hours of rain sent to the forecast algorithm, theumbrella icon, and the monthly and yearly rain totals.Clear the daily rain total to correct if your station accidentally recorded rainwhen the ISS was installed.Monthly rainClears the monthly rain total. Does not affect yearly rain total.Yearly rainClears the yearly rain total.WindClears the wind direction calibration.Daily ETClears daily ET and subtracts the old daily ET total from the monthly andyearly ET totals.
Highs and Lows ModeMonthly ETClears the current monthly ET total. Does not affect †he yearly ET total.Yearly ETClears the current yearly ET total.Highs and Lows ModeThe <strong>Vantage</strong> <strong>Pro</strong> records highs and lows for many weather conditions overthree different periods: days, months, and years. Except for Yearly Rainfall,all high and low registers are cleared automatically at the end of eachperiod. \For example, daily highs are cleared at midnight, monthly highs are clearedat month–end midnight, yearly highs are cleared at year–end midnight. Youmay enter the month that you would like the Yearly Rainfall accumulation toclear. The Yearly Rainfall will clear on the first day of the month you choose.TABLE 3-2: WEATHER DATA HIGHS AND LOWSWeather Variable High LowDay,Time & Month Year Additional InformationDateOutside Temperature Yes Yes Yes Yes YesInside Temperature Yes Yes Yes Yes Yes*Outside Humidity Yes Yes Yes Yes Yes*Inside Humidity Yes Yes Yes Yes Yes*Barometer Yes Yes Yes Yes Yes*Heat Index Yes Yes Yes Yes*Temp/Hum/Wind/Sun(THSW) IndexYes Yes Yes Yes* requires solar radiation sensorWind Chill Yes Yes Yes Yes*Wind Speed Yes Yes Yes Yes Includes directionRainfall Rate Yes Yes Yes YesDaily Rain Total Total TotalUV Index Yes Yes Yes Yes* requires UV sensorSolar Radiation Yes Yes Yes Yes* requires solar radiation sensorDew Point Yes Yes Yes Yes Yes*Evapotranspiration Total Total Total requires solar radiation sensorSoil Moisture Yes Yes Yes Yes Yes* requires soil moisture sensorLeaf Wetness Yes Yes Yes Yes Yes* requires leaf wetness sensor* Only stores the yearly high for the current year.
3. Using Your Weather StationViewing Highs and Lows1. Press the HI/LOW key to enter the Highs and Lows mode.The DAY and HIGHS icons light up and the station displays the highs forall visible fields.2. Press the + and - keys to scroll between Day Highs, Day Lows, MonthHighs, Month Lows, Year Highs and Year Lows.The HIGH or LOW icon, as well the DAY, MONTH or YEAR icon will lightto show you which High/Low screen you’ve selected. See “Graph & Hi/Low Mode Settings” on the inside of the front cover.3. Press the < and > keys to scroll back and forth through the last 24 days.Pressing the < key moves you to the previous day’s highs. Each time youpress the < key, the date moves back another day. The 24 dots in thegraph field also represent each of the last 24 days; the right-most dot istoday. As you move backward and forward the flashing dot changes toshow what day you’re looking at.4. Use the console keys to select a different weather variable.The console’s time display will the show the time of the selected variable’shigh or low.5. When you are finished, press DONE to exit the Highs and Lows mode.The console screen will switch to the Current Weather mode.Alarm ModeThe <strong>Vantage</strong> <strong>Pro</strong> features more than 30 alarms that can be programmed tosound whenever a reading exceeds a set value. With the exception of barometricpressure and time, all alarms sound when a reading reaches thealarm threshold. For example, if the high outside temperature alarm thresholdis set at 65 ºF, the alarm will sound when the temperature rises to 65.0ºF.When an alarm condition exists, the audible alarm sounds, the alarm iconblinks repeatedly, and an alarm description appears in the ticker at thebottom of the screen. The alarm sounds for a maximum two minutes if theconsole is battery-powered, but the icon will continue to blink and themessage will stay in the ticker until you clear the alarm or the conditionclears. If you’re using the AC adapter, the alarm will continue sounding aslong as the condition exists.The alarm will sound again for each new alarm. If more than one alarm isactive, the description for each active alarm cycles onto the screen everyfour seconds. A “+” symbol appears at the end of the alarm text if more thanone alarm is tripped.Low alarms work the same way. For example, if the wind chill threshold isset for 30 ºF, the alarm condition begins when the temperature drops to 30 ºand will continue until the temperature rises above 30º.
Alarm ModeThree Special AlarmsET (Evapotranspiration)ET is updated only once an hour, on the hour. If during a given hour the ETValue exceeds the alarm threshold, the ET alarm sounds at the end of thathour. This is true for daily, monthly, and yearly ET alarms. You must have theoptional Solar Radiation Sensor to use this alarm. See “Evapotranspiration(ET)” on page 50 for a description of this variable.Barometric PressureThe <strong>Vantage</strong> <strong>Pro</strong> allows you to set two barometric pressure alarms: a “rise”alarm and a “fall” alarm. You may select any rate of change per three hoursbetween 0.00 and 0.99 Hg; the alarm will sound if the rate of change (ineither direction) exceeds your threshold you set.TimeThe time alarm is a standard “alarm clock” alarm. It will sound at the timeyou’ve set. Make sure you choose am or pm, if you’re in 12-hour mode. It willsound for one minute.Setting Alarms1. To view or set the high alarm thresholds, press 2ND then press theALARM key enter the Alarm Mode.The screen shows the current high alarm thresholds. The ALARM andHIGHS icons also appear.2. To view or set the low alarm thresholds, first press 2ND then press theALARM key enter the Alarm Mode. Then press the HI/LOW key todisplay the low alarm threshold settings.The ALARM and LOWS icons appear. See “Graph & Hi/Low ModeSettings” on the inside of the front cover.3. Press the < and > keys to select one of the variables displayed on thescreen or use the console keys to select any weather variable.4. Press 2ND then press SET to change the selected variable’s alarmsetting.The right-most digit in the alarm threshold will begin blinking.5. Press the < and > keys to select digits in the threshold value.6. Press the + and - keys to change the digit’s value up and down.7. When you are finished changing the alarm setting, press the DONE key.8. Repeat steps 3 through 7 to change additional alarm settings.9. When you are finished, press DONE to exit Alarm Mode.
3. Using Your Weather StationSetting the Time Alarm1. Press 2ND then press the ALARM key to enter the alarm mode.The ALARM and HIGHS icons appear.2. Press Time, then press 2ND, and then press SET.The time field will begin blinking.3. Press < and > to select hours, minutes, or am/pm.4. Press the + and - keys to change the digit’s value up and down.5. When you are finished, press DONE to exit Alarm Mode.Clearing Alarm Settings1. Press 2ND then press the ALARM key to enter the alarm mode.The ALARM and HIGHS icons will appear.2. Select the alarm setting you wish to clear.3. Press 2ND, then press and hold CLEAR until the setting changes to alldashes.You have cleared the alarm setting.4. When you are finished, press DONE to exit Alarm Mode.Silencing Alarms1. Press DONE to silence an alarm.TABLE 3-3: VANTAGE PRO STATION ALARMSVariableBarometric Pressure TrendEvapotranspirationHumidity, InsideHumidity, OutsideDew PointLeaf WetnessRainStormRain RateSoil MoistureSolar RadiationInside TemperatureAlarmsStorm Warning - uses trend value rising rateStorm Clearing - uses trend value falling rateET Alarm - uses total ET for the dayHigh and LowHigh and LowHigh and LowHigh and LowFlash Flood Alarm - uses current 15 minute rainfall total24 Hour Rain Alarm - uses current 24 hour rainfall totalStorm Alarm - uses current storm rainfall totalHighHigh and LowHighHigh and Low
Graph ModeTABLE 3-3: VANTAGE PRO STATION ALARMS (CONTINUED)VariableOutside TemperatureExtra TemperatureHeat Index TemperatureTHSW Index TemperatureWind Chill TemperatureUV Radiation IndexUV Radiation MEDWind SpeedTime & DateAlarmsHigh and LowHigh and LowHighHighLowHighHigh -- uses the current total if variable has been resetHighYes - the alarm sounds for 1 minute.Graph ModeThe <strong>Vantage</strong> <strong>Pro</strong> console includes a powerful Graph Mode that allows you toview over 100 graphs of different kinds right on the screen. - all without connectingto a personal computer.See Table “<strong>Vantage</strong> <strong>Pro</strong> <strong>Console</strong> Graphs” on page 36 for a list of theavailable graphs.Viewing GraphsAlthough the graphs available may vary for each weather variable, you displaythe graphs in the same way:1. Press Graph to enter GraphamGRAPHMode.TEMP OUTFOnly the date, graph, graphicon, and selected variableare visible.Last 24 hrsEvery 1 hrThe rest of the screen will beblank.Vertical Scale: 22. Select a variable to graph.Values for the each of the last 24 hours are displayed in the graph, eachhour represented by a dot. The dot at right end of the graph is the valuefor the current hour. You’ll notice that the dot is blinking.3. Press the < key and the second dot from the right will start blink.The screen displays the new dot’s value. The time display will show youwhat hour of the last 24 you’re looking at.4. Press the < and > keys to view the variable’s values for each of the last 24hours. The console also display the maximum and minimumtemperatures recorded in the last 24 hours.
3. Using Your Weather Station5. Press the + and - keys to shift the graph’s time span.If you press the - key, thegraph will shift from the last24 hours to the last 24 days.Now each dot representsthe high recorded on theday shown in the date field.To see the lows recorded inthe last 24 days, press theHI/LOW key. Press the keys to movebetween days.HIGHSLast 24 days Every 1 dayVertical Scale: 5GRAPHTEMP OUTIf you press the - key again the graph will shift to show the highs of thelast 24 months. As before, use the < and > keys to move betweenmonths. Press the HI/LOW key to shift between the highs and lows.If you press the - key again, the graph will shift one more time to showthe highs of the last 24 years! Use the HI/LOW key to shift between highsand lows.Note: The console beeps when you’ve reached the first or last possible value or time span for thegraph.Note: Since the console only graphs data collected by your station, the graphs can only show datacollected since your station was first installed.FView graphs of all other variables the same way:1. Enter graph mode.2. Select the variable you want to view.3. Use the < and > keys to select different variables.4. Press the + key to shorten the time range.5. Press the - key to lengthen the time range.6. Press HI/LOW to shift between highs and lows.7. Press DONE to exit.TABLE 3-4: VANTAGE PRO CONSOLE GRAPHSWeather VariableAvailable Graphs aCurrent1 Min10 Min15 MinHourlyDailyMonthlyYearlyBarometric Pressure C C C H,L H,LEvapotranspiration (ET) b T T T T THumidity, Inside C C H,L H,LHumidity, Outside C C H,L H,L
Graph ModeTABLE 3-4: VANTAGE PRO CONSOLE GRAPHS (CONTINUED)Weather VariableAvailable Graphs aCurrent1 Min10 Min15 MinHourlyDailyMonthlyYearlyDew Point C C H,L H,LLeaf Wetness c C C H,L HRain T T T T T TStorm 1Rain Rate H H H H H HSoil Moisture C C H,L H,LSolar Radiation b A A H HInside Temperature C C H,L H,LOutside Temperature C C H,L H,L H,LHeat Index Temperature C C H HTemp/Hum/Sun/Wind (THSW) IndexTemperature b C C H HWind Chill Temperature L L L LUV Radiation Index d A A H HUV Radiation MED (MinimalErythemal Dose) d T T TWind Speed A A AH H H HDirection of High Wind Speed Y Y Y YDominant Wind Direction A A A Aa.A = Average, H = Highs, L = Lows, T = Totals, Y = Yes, C = Current reading at the end of each periodb.Requires solar radiation sensorc.Requires Wireless Leaf & Soil Moisture/Temperature Stationd.Requires UV sensor
3. Using Your Weather Station
7528%/(6+227,1*0$,17(1$1&(<strong>Vantage</strong> <strong>Pro</strong> Troubleshooting GuideWhile your <strong>Vantage</strong> <strong>Pro</strong> weather station is designed to provide years of trouble-freeoperation, occasional problems may arise. If you are having a problemwith your station, please consult this troubleshooting guide beforecalling the factory. You may be able to quickly solve the problem yourself. Ifyou need help, please contact <strong>Davis</strong> Technical Support, page 43.Note: Refer to the ISS Installation <strong>Manual</strong> for additional troubleshooting information.TABLE 4-1: TROUBLESHOOTING GUIDEDisplay<strong>Pro</strong>blemDisplay is blankDisplay shows dashes inplace of weather data<strong>Console</strong> is sluggish or doesnot work at low temperaturesDisplay “locks up”SolutionUnit is not receiving power. Check the power adapter connectionsand/or replace batteries.ISS not plugged in (cabled station). See ISS manual.Sensors not transmitting (wireless station). See ISS (or other transmitter)manual.<strong>Console</strong> not receiving (wireless station) - See “Troubleshooting Reception<strong>Pro</strong>blems” on page 41.A reading has exceeded the limits indicated in the specifications table.Calibration numbers may be causing readings to exceed display limits.Check calibration number and adjust if necessary.The console and display may not work below 32º F (0ºC). Use anExternal Temperature sensor in low-temperature locations.If the console “locks up”, reset the console by removing AC and batterypower then restoring power. If this occurs frequently in an ACpoweredconsole, plug the AC power-adapter into a surge suppressor.
4. Troubleshooting & MaintenanceTABLE 4-1: TROUBLESHOOTING GUIDE<strong>Pro</strong>blemOutside temperature sensorreading seems too highSolutionCheck calibration number and adjust if necessary. ISS or temp sensormay need to be relocated. See ISS or other transmitter manual.TemperatureInside temperature sensorreading seems too highOutside temperature seemstoo lowMove the console out of direct sunlight. Make sure that the consoleor sensor is not in contact with an exterior wall that heats up in sunlightor when outside temperature rises. Make sure the console orsensor is not near a heater or other internal heat source (lamps, appliances,etc.). Check calibration number and adjust if necessary.Check calibration number and adjust if necessary. Sprinklers maybe hitting the ISS radiation shield. Relocate. See ISS manual.Inside temperature sensorreading seems too lowMake sure the console or other temperature sensor is not in contactwith an exterior wall that cools down when outside temperaturedrops. Make sure the console or other temperature sensor is notnear an air conditioning vent. Check calibration number and adjustif necessary.Rain Dew Heat Chill Wind Direction Wind Speed HumidityInside humidity seems toohigh or too lowWind speed reading seemstoo high or too low.Wind speed reads 0 either allthe time or intermittentlyWind direction reading isdashed outWind direction always saysNorthWind chill reading seems toohigh or too lowHeat Index reading seemstoo high or too lowDew Point reading seemstoo high or too lowNo rain readingsMake sure the console is not near a humidifier or de-humidifier.Check calibration number and adjust if necessary. If inside humidityis low, and inside temperature is too high, see “inside temp” above.For low readings, remove the wind cups and check for friction sources.Check ISS location. Is it sheltered from the wind? See ISS manualfor additional wind speed troubleshooting informationThe problem may be with the anemometer. Test anemometer byspinning wind cups. Check fields one-b and two-b on diagnosticscreen. May require call to tech support.Wireless model - check reception. See Reception <strong>Pro</strong>blems below.Cabled model - cable may be faulty.If these steps do not reveal the problem, the anemometer may befaulty. Call the factory for return authorization.Usually an ISS problem, especially if outside temperature is dashedout as well. See the ISS manual for troubleshooting informationCheck calibration numbers for temperature. Remember, wind chilldepends on temperature and wind speed. Make sure they’re working.Check calibration numbers for temperature. Remember, the heat indexdepends on temperature and outside humidity. Make surethey’re working.Check calibration numbers for temperature. Remember, dew pointdepends on temperature and outside humidity. Make sure they’reworking.Make sure cable-tie is removed from rain collector. See ISS manual.If you are using wireless sensors from a Weather Monitor II orWeather Wizard III, set the station type to SensorLink
<strong>Vantage</strong> <strong>Pro</strong> Troubleshooting GuideTABLE 4-1: TROUBLESHOOTING GUIDETime<strong>Pro</strong>blemIncorrect times for sunriseand sunsetSolutionCheck your latitude and longitude settings. Sunrise and sunsettimes are calculated from the console latitude and longitude settingsTroubleshooting Reception <strong>Pro</strong>blemsWhile we have tested the Wireless <strong>Vantage</strong> <strong>Pro</strong> radio extensively, each siteand each installation presents its own issues and challenges. Obstructions,particularly metal, will often cut down your station’s reception distance. Besure to test reception between the console and ISS, in the locations youintend to install them, or before permanently mounting your ISS or othertransmitter(s).You can quickly see the console’s reception status by looking at the lowerright corner of the screen:• An “X” flashes for every data packet received by the console.• An “R” flashes when the console is trying to re-establish a lostconnection.• An “L” flashes when the signal has been lost.• When no data packets have been received for 10 minutes, theconsole dashes-out any missing sensor readingsCheck <strong>Console</strong> ReceptionEnter Setup mode by pressing DONE, then pressing -. Wait a few momentswhile the console lists all the stations transmitting within range. If the consoledetects your transmitter, check the following:• Is the ID you’re receiving configured in the console?See Table “Maximum Number of Transmitters” on page 12.• Is the correct station type set?See “Maximum Number of Transmitters” on page 12.• Use the diagnostic screen to obtain useful signal strength information.See “<strong>Console</strong> Diagnostic Screen” on page 42• Adjust the console and ISS antennas to be parallel to each other.• Try turning on the Gain.See “Diagnostic Screen Commands” on page 42.• Reduce the distance between the ISS and the console.Move the console closer to the ISS, but make sure you’re not standingdirectly beneath it. Do you receive a signal?Check the ISSRefer to the ISS Installation <strong>Manual</strong> for instructions on how to check the ISSfor potential transmission problems.
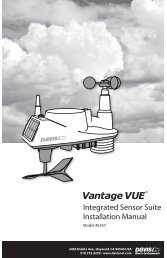
4. Troubleshooting & Maintenance<strong>Console</strong> Diagnostic ScreenIn addition to logging weather data, the console continuously monitors thestation’s radio reception. The signal You may find this information very helpful,especially when you are choosing locations for your console and ISS.Note: Radio transmission data is cleared each day at midnight.Diagnostic Screen Commands• Press and hold the TEMP key, then press the TIME key to display thediagnostic screen.• Press the DONE key to exit the diagnostic screen.• Press the STATION key to display signal statistics for the nextinstalled transmitter ID.• Press the HI/LOW key to toggle Gain on and off. The message in theticker indicates the current Gain status. The Receiver Gain settingprovides some control over the receiver sensitivity. If you’re havingtrouble with reception, try turning the Gain on.Diagnostic Screen Features3 4 51 2am614Last 24 days Every 1 dayVertical Scale: 1 0 STATION NO. 5798101113121. (a) Time of day or (b) number of times the reed switch was seen closedwhen sampled. The reed switch closes once each rotation. Use the WINDkey to toggle between readings.2. (a) Date or (b) number of times the reed switch was seen open whensampled. The anemometer counts rotations. The reed switch is part of theanemometer mechanism. WIND key toggles display.3. (a) Number of CRC errors or (b) 8 bit timer value of next reception. CRCis an error checking protocol. Toggle display with CHILL.4. Number of missed data packets.5. Percentage of scheduled data packets received.6. Total number of packets received.7. (a) Number of times the console resynchronized with the transmitter or (b)maximum number of packets missed in a row without losing synchronization.Toggle using the TEMP key.
<strong>Console</strong> Maintenance8. Number of times the console lost communications with the transmitter formore than 10 minutes.9. Current number of consecutive misses. The counter increments when theconsole is synchronized but the packet is not.10. Longest streak of consecutive packets received.11. Current streak of consecutive packets received.12. Current console battery voltage13. Receiver Gain Status14. Graph of last 24 days’ percentage of scheduled ISS data packets.<strong>Console</strong> Firmware VersionsIn some cases the problem may be that your console firmware doesn’t supportwhat you are trying to do. Use this command to determine the firmwarerevision level in your console. You can find more information on <strong>Vantage</strong> <strong>Pro</strong>console firmware versions and changes in the Weather Software Supportsection of our website. See “Contacting <strong>Davis</strong> Technical Support” onpage 44 for information.Press and hold the DONE key then press the + key to display the consolefirmware version in the ticker at the bottom of the screen.<strong>Console</strong> MaintenanceChanging BatteriesUse this procedure to change console batteries without loosing any storedweather data or console configuration settings.1. Plug in the AC adapter2. Enter Setup Mode by pressing the DONE and - keys.Entering Setup Mode makes sure the station isn’t writing any data tomemory when you remove power.3. Remove the battery cover located on the back of the console by pressingdown on the two latches at the top of the cover4. Place the console face down on a flat, firm surface.5. Insert a fingertip between the two exposed batteries then press the middlebattery down toward the notch (toward the “hidden” battery). This willrelieve tension on the first battery and allow you to remove it
4. Troubleshooting & MaintenanceContacting <strong>Davis</strong> Technical SupportIf you have any questions, or encounter problems installing or operating your<strong>Vantage</strong> <strong>Pro</strong> weather station, please contact <strong>Davis</strong> Technical Support. We’llbe glad to help.Note: Please do not return items for repair without prior authorization.(510) 732-7814 – Monday – Friday, 7:00 a.m. – 5:30 p.m. Pacific Time. Weare unable to accept collect calls.(510) 670-0589 – Technical Support Fax.support@davisnet.com – E-mail to Technical Support.info@davisnet.com – General e-mail.www.davisnet.com – <strong>Davis</strong> <strong>Instruments</strong> web site. See the Weather Supportsection for copies of user manuals, product specifications, application notes,and information on software updates. Watch for FAQs and other updates.Subscribe to the e-newsletter.et.comOne Year Limited WarrantyFor details on our warranty policy, please refer to the Maintenance, Service,and Repair Information brochure included with your station.
$33(1',;$:($7+(5'$7$Refer to this appendix to learn more about the weather variables that aremeasured, displayed, and logged by your <strong>Vantage</strong> <strong>Pro</strong> Station.Note: Some weather variables require optional sensors. See “Optional Sensors” starting on page 2.WindThe anemometer measures wind speed and direction, and is part of the IntegratedSensor Suite (ISS). The console also calculates a 10-minute averagewind speed and 10-minute dominant wind direction. The 10-minute averagewind speed is displayed in the console ticker whenever wind has beenselected on the console. The last six 10-minute dominant wind directions areincluded in the compass rose wind display.TemperatureThe ISS houses the outside temperature sensor in a vented and shieldedenclosure that minimizes the solar radiation induced temperature error. Theconsole houses the inside temperature sensor. Additional temperature sensorsare available for wireless stations and can be used to measure up toeight locations.Apparent Temperatures<strong>Vantage</strong> <strong>Pro</strong> calculates three apparent temperature readings: wind chill,Heat Index, and the Temperature/Humidity/Sun/Wind (THSW) Index.Apparent temperatures use additional weather data to calculate what ahuman body perceives the temperature to be in those conditions.Wind chillWind chill takes into account how the speed of the wind affects our perceptionof the air temperature. Our bodies warm the surrounding air moleculesby transferring heat from the skin. If there’s no air movement, this insulatinglayer of warm air molecules stays next to the body and offers some protectionfrom cooler air molecules. However, wind sweeps that comfy warm airsurrounding the body away. The faster the wind blows, the faster heat is carriedaway and the colder you feel.Heat IndexThe Heat Index uses temperature and the relative humidity to determinehow hot the air actually “feels.” When humidity is low, the apparent temperaturewill be lower than the air temperature, since perspiration evaporatesrapidly to cool the body. However, when humidity is high (i.e., the air is more
Appendix A: Weather Datasaturated with water vapor) the apparent temperature “feels” higher than theactual air temperature, because perspiration evaporates more slowly.Note: <strong>Vantage</strong> <strong>Pro</strong> measures Heat Index only when the air temperature is above 57° F (14° C),because it’s insignificant at lower temperatures. (Below 57°, Heat Index = the air temperature.)The Heat Index is not calculated above 135° F (52° C).Temperature/Humidity/Sun/Wind (THSW) IndexThe THSW Index uses humidity and temperature like the Head Index, butalso includes the heating effects of sunshine and the cooling effects of wind(like wind chill) to calculate an apparent temperature of what it “feels” like outin the sun. The THSW Index requires a solar radiation sensor.HumidityHumidity itself simply refers to the amount of water vapor in the air. However,the amount of water vapor that the air can contain varies with air temperatureand pressure. Relative humidity takes into account these factors andoffers a humidity reading which reflects the amount of water vapor in the airas a percentage of the amount the air is capable of holding. Relative humidity,therefore, is not actually a measure of the amount of water vapor in theair, but a ratio of the air’s water vapor content to its capacity. When we usethe term humidity in the manual and on the screen, we mean relative humidity.It is important to realize that relative humidity changes with temperature,pressure, and water vapor content. A parcel of air with a capacity for 10 g ofwater vapor which contains 4 g of water vapor, the relative humidity would be40%. Adding 2 g more water vapor (for a total of 6 g) would change thehumidity to 60%. If that same parcel of air is then warmed so that it has acapacity for 20 g of water vapor, the relative humidity drops to 30% eventhough water vapor content does not change.Relative humidity is an important factor in determining the amount ofevaporation from plants and wet surfaces since warm air with low humidityhas a large capacity to absorb extra water vapor.Dew PointDew point is the temperature to which air must be cooled for saturation(100% relative humidity) to occur, providing there is no change in watervapor content. The dew point is an important measurement used to predictthe formation of dew, frost, and fog. If dew point and temperature are closetogether in the late afternoon when the air begins to turn colder, fog is likelyduring the night. Dew point is also a good indicator of the air’s actual watervapor content, unlike relative humidity, which takes the air’s temperature intoaccount. High dew point indicates high water vapor content; low dew pointindicates low water vapor content. In addition a high dew point indicates abetter chance of rain and severe thunderstorms.
RainRainYou can also use dew point to predict the minimum overnight temperature.<strong>Pro</strong>vided no new fronts are expected overnight and the afternoon RelativeHumidity ≥ 50%, the afternoon’s dew point gives you an idea of whatminimum temperature to expect overnight, since the air cannot get colderthan the dew point anytime.<strong>Vantage</strong> <strong>Pro</strong> incorporates a tipping-bucket rain collector in the ISS that measures0.01” for each tip of the bucket. Your station also logs rain data in inchunits. If you select millimeters for the rain measurement unit, your station stilllogs rain data in inches but will convert the logged totals from inches to millimetersat the time it is displayed. Converting the logged rain totals reducespossible conversion losses to a minimum.Four separate variables track rain totals: “rain storm”, “daily rain”, “monthlyrain”, and “yearly rain”. Rain rate calculations are based on the interval oftime between each bucket tip, which is each 0.01” rainfall increment.Barometric PressureThe weight of the air that makes up our atmosphere exerts a pressure on thesurface of the earth. This pressure is known as atmospheric pressure. Generally,the more air above an area, the higher the atmospheric pressure, this,in turn, means that atmospheric pressure changes with altitude. For example,atmospheric pressure is greater at sea-level than on a mountaintop. Tocompensate for this difference and facilitate comparison between locationswith different altitudes, atmospheric pressure is generally adjusted to theequivalent sea-level pressure. This adjusted pressure is known as barometricpressure. In reality, the <strong>Vantage</strong> <strong>Pro</strong> measures atmospheric pressure.When you enter your location’s altitude in Setup Mode, the <strong>Vantage</strong> <strong>Pro</strong>stores the necessary offset value to consistently translate atmospheric pressureinto barometric pressure.Barometric pressure also changes with local weather conditions, makingbarometric pressure an extremely important and useful weather forecastingtool. High pressure zones are generally associated with fair weather whilelow pressure zones are generally associated with poor weather. Forforecasting purposes, however, the absolute barometric pressure value isgenerally less important than the change in barometric pressure. In general,rising pressure indicates improving weather conditions while falling pressureindicates deteriorating weather conditions.Solar RadiationWhat we call “current solar radiation” is technically known as Global SolarRadiation, a measure of the intensity of the sun’s radiation reaching a horizontalsurface. This irradiance includes both the direct component from thesun and the reflected component from the rest of the sky. The solar radiation
Appendix A: Weather Datareading gives a measure of the amount of solar radiation hitting the solarradiation sensor at any given time, expressed in Watts /sq. meter (W/m 2 ).Solar radiation requires the solar radiation sensor.UV (Ultra Violet) RadiationEnergy from the sun reaches the earth as visible, infrared, and ultraviolet(UV) rays. Exposure to UV rays can cause numerous health problems, suchas sunburn, skin cancer, skin aging, and cataracts, and can suppress theimmune system. The <strong>Vantage</strong> <strong>Pro</strong> can help analyze the changing levels ofUV radiation and can advise of situations where exposure is particularlyunacceptable. UV radiation requires the UV radiation sensor. The <strong>Vantage</strong><strong>Pro</strong> displays UV readings in two scales: MEDs and UV Index.CAUTION: Your station’s UV readings do not take into account UV reflected off snow, sand, or water,which can significantly increase your exposure. Nor do your UV readings take into accountthe dangers of prolonged UV exposure. The readings do not suggest that any amount ofexposure is safe or healthful. Do not use the <strong>Vantage</strong> <strong>Pro</strong> to determine the amount of UV radiationto which you expose yourself. Scientific evidence suggests that UV exposure should beavoided and that even low UV doses can be harmful.UV MEDsMED stands for Minimum Erythemal Dose, defined as the amount of sunlightexposure necessary to induce a barely perceptible redness of the skin within24 hours after sun exposure. In other words, exposure to 1 MED will result ina reddening of the skin. Because different skin types burn at different rates,1 MED for persons with very dark skin is different from 1 MED for personswith very light skin.Both the U.S. Environmental <strong>Pro</strong>tection Agency (EPA) and EnvironmentCanada have developed skin type categories correlating characteristics ofskin with rates of sunburn. See “EPA SKIN PHOTOTYPES” and “ENVIRONMENTCANADA SKIN TYPES AND REACTION TO THE SUN” for a description of skin types.TABLE A-1: EPA SKIN PHOTOTYPESSkin Phototype Skin color Tanning & Sunburn history1 - Never tans,always burns2 - Sometimes tans, usuallyburns3 - Usually tans,sometimes burns4 - Always tans;rarely burnsPale or milky white; alabasterVery light brown; sometimesfrecklesLight tan; brown, or olive;distinctly pigmentedBrown, dark brown, or blackDevelops red sunburn; painful swelling, skinpeelsUsually burns, pinkish or red coloring appears;can gradually develop light brown tanRarely burns; shows moderately rapid tanningresponseRarely burns; shows very rapid tanning response
UV (Ultra Violet) RadiationTable A-2: ENVIRONMENT CANADA SKIN TYPES AND REACTION TO THE SUN aSkin Type Skin Color History of Tanning & SunburningI White Always burns easily, never tansII White Always burns easily, tans minimallyIII Light Brown Burns moderately, tans graduallyIV Moderate Brown Burns minimally, tans wellV Dark Brown Burns rarely, tans profuselyVI Black Never burns, deep pigmentationa. Developed by T. B. Fitzpatrick of the Harvard Medical School. More aboutthe Fitzpatrick Skin Types is available in: Fitzpatrick TB. Editorial: the validityand practicality of sun-reactive skin types I through VI. Arch Dermatol1988; 124:869-8711ISkin Phototype (EPA)23Some burnUV Dose thatCauses SunburnAll BurnIIIIIIVVSkin Type (Environment Canada)4VI20 40 60 80 100 120 mJ/cm 2UV Index1 2 3 4 5 6UV Dose (MEDs)UV Dose and Sunburn - Use this plot to estimate the MED dose leading to sunburn. A person with Type II (EnvironmentCanada) skin type might choose 0.75 MED as the maximum for the day; in contrast, a person with TypeV (Environment Canada) Skin Type might consider 2.5 MEDs a reasonable dose for the day. NOTE: the <strong>Vantage</strong><strong>Pro</strong> assumes a Fitzpatrick (Environment Canada) Skin Type of II.<strong>Vantage</strong> <strong>Pro</strong> can also display UV Index, an intensity measurement firstdefined by Environment Canada and since been adopted by the WorldMeteorological Organization. UV Index assigns a number between 0 and 16to the current UV intensity. The US EPA categorizes the Index values asshown in 2. The lower the number, the lower the danger of sunburn. TheIndex value published by the U.S. National Weather Service is a forecast of
Appendix A: Weather Datathe next day’s noontime UV intensity. The Index values displayed by the<strong>Vantage</strong> <strong>Pro</strong> are real-time measurements.TABLE A-3: UV INDEXIndex ValuesExposure CategoryEvapotranspiration (ET)Evapotranspiration (ET) is a measurement of the amount of water vaporreturned to the air in a given area. It combines the amount of water vaporreturned through evaporation (from wet vegetation surfaces and the stomaof leaves) with the amount of water vapor returned through transpiration(exhaling of moisture through plant skin) to arrive at a total. Effectively, ET isthe opposite of rainfall, and it is expressed in the same units of measure(Inches, millimeters).The <strong>Vantage</strong> <strong>Pro</strong> uses air temperature, relative humidity, average windspeed, and solar radiation data to estimate ET, which is calculated once anhour on the hour. ET requires the optional solar radiation sensor.Leaf WetnessLeaf wetness (see “Optional Sensors” on page 2) provides an indication ofwhether the surface of foliage in the area is wet or dry by indicating how wetthe surface of the sensor is. The leaf wetness reading ranges from 0 (dry) to15. Leaf wetness requires an optional Leaf & Soil Moisture/TemperatureStation and is only available for Wireless <strong>Vantage</strong> <strong>Pro</strong> Stations.Soil MoistureTime0 - 2 Minimal3 - 4 Low5 - 6 Moderate7 - 9 High10+ Very HighSoil Moisture, as the name suggests, is a measure of the moisture content ofthe soil. Soil moisture is measured on a scale of 0 to 200 centibars, and canhelp choose times to water crops. The soil moisture sensor measures thevacuum created in the soil by the lack of moisture. A high soil moisture readingindicates dryer soil; a lower soil moisture reading means wetter soil. SoilMoisture requires an optional Leaf & Soil Moisture/Temperature Station orSoil Moisture Station and is only available for Wireless <strong>Vantage</strong> <strong>Pro</strong> Stations.A built-in clock and calendar track the time and date. The console automaticallyadjusts for daylight savings time and for leap years.
$33(1',;%6 3(&,),&$7,216See complete specifications for your <strong>Vantage</strong> <strong>Pro</strong> Station at our website:www.davisnet.com<strong>Console</strong> Specifications<strong>Console</strong> Operating Temperature . . . . . . . . . . +14° to +140°F (-10° to +60°C)Display Temperature . . . . . . . . . . . . . . . . . . . +32° to +140°F (0° to +60°C)Non-operating Temperature. . . . . . . . . . . . . . -5° to +158°F (-20° to +70°C)<strong>Console</strong> Current Draw . . . . . . . . . . . . . . . . . Wireless: 0.67 mA average, 15 mA peak, (add 80 mAfor display lamps, add 0.125 mA for each transmitterstation received by console) at 4 to 6 VDCCabled: 10 mA (average), 15 mA (peak) (+80 mA forilluminated display) at 4 to 6 VDCPower Adapter. . . . . . . . . . . . . . . . . . . . . . . . 5 VDC, 200 mABattery Backup . . . . . . . . . . . . . . . . . . . . . . . 3 C-cellsBattery Life (no AC power) . . . . . . . . . . . . . . Wireless: up to 1 year;Cabled: 1 month (approximately)Connectors . . . . . . . . . . . . . . . . . . . . . . . . . . Modular RJ-11Housing Material . . . . . . . . . . . . . . . . . . . . . . UV-resistant ABS plastic<strong>Console</strong> Display Type . . . . . . . . . . . . . . . . . . LCD TransflectiveDisplay Backlight . . . . . . . . . . . . . . . . . . . . . . 4 LEDsDimensions:<strong>Console</strong> (with antenna) . . . . . . . . . . . . . 10.375" x 6.125" x 1.5" (264 mm x 156 mm x 38 mm)<strong>Console</strong> (no antenna) . . . . . . . . . . . . . . 9.625" x 6.125" x 1.5" (244 mm x 156 mm x 38 mm)Display . . . . . . . . . . . . . . . . . . . . . . . . . 5.94" x 3.375" (151 mm x 86 mm)Weight (with batteries). . . . . . . . . . . . . . . . . . 1.88 lbs. (.85 kg)Wireless Transmission SpecificationsTransmit/Receive Frequency . . . . . . . . . . . . . US Models: 916.5 MHzOverseas Models: 868.35 MHz<strong>Davis</strong>Talk ID Codes Available . . . . . . . . . . 8Output Power . . . . . . . . . . . . . . . . . . . . . . . . 916.5 MHz: FCC-certified low power, less than 1mW, no license required868.35 MHz: CE-certified, less than 10 mW, nolicense requiredRangeLine of Sight . . . . . . . . . . . . . . . . . . . . . up to 400 feet (120 m)Through Walls . . . . . . . . . . . . . . . . . . . 75 to 150 feet (23 to 46 m)
Appendix B: Specifications<strong>Console</strong> Data Display SpecificationsHistorical Data . . . . . . . . . . . . . . . . . . . . . . . . Includes the past 24 values listed unless otherwisenoted; all can be cleared and all totals resetDaily Data . . . . . . . . . . . . . . . . . . . . . . . . . . . Includes the earliest time of occurrence of highs andlows; period begins/ends at 12:00 amMonthly Data . . . . . . . . . . . . . . . . . . . . . . . . . Period begins/ends at 12:00 am on the first of themonthYearly Data . . . . . . . . . . . . . . . . . . . . . . . . . . Period begins/ends at 12:00 am on the first ofJanuary unless otherwise notedCurrent Data . . . . . . . . . . . . . . . . . . . . . . . . . Current data appears in the right most column in theconsole graph and represents the latest value withinthe last period on the graph; totals can be set or resetGraph Time Interval . . . . . . . . . . . . . . . . . . . 1 min., 10 min., 15 min., 1 hour, 1 day, 1 month, 1year (user-selectable, availability depends uponvariable selected)Graph Time Span. . . . . . . . . . . . . . . . . . . . . . 24 Intervals + Current Interval (see Graph Intervalsto determine time span)Graph Variable Span (Vertical Scale) . . . . . . . Automatic (varies depending upon data range);Maximum and Minimum value in range appear intickerAlarm Indication . . . . . . . . . . . . . . . . . . . . . . . Alarms sound for only 2 minutes (time alarm isalways 1 minute) if operating on battery power. Alarmmessage is displayed in ticker as long as threshold ismet or exceeded. Alarms can be silenced (but notcleared) by pressing the DONE key.Update Interval . . . . . . . . . . . . . . . . . . . . . . . Varies with sensor - see individual sensor specsAlso varies with <strong>Davis</strong>Talk transmitter ID code -#1=shortest, #8=longestForecast:Variables Used . . . . . . . . . . . . . . . . . . . Barometric Reading & Trend, Wind Speed &Direction, Rainfall, Temperature, Humidity, Latitude& Longitude, Time of YearUpdate Interval . . . . . . . . . . . . . . . . . . . 1 hourDisplay Format . . . . . . . . . . . . . . . . . . . Icons on top center of display; detailed message inticker at bottomVariables Predicted . . . . . . . . . . . . . . . . Sky Condition, Precipitation, Temperature Changes,Wind Direction and Speed Changes
Weather Data SpecificationsWeather Data SpecificationsBarometricPressure aNote: These specifications include optional sensors that may not beinstalled in your <strong>Vantage</strong> <strong>Pro</strong> Station.TABLE 3-1: WEATHER DATA SPECIFICATIONSVariable Required Sensors Resolution RangeBarometric Trend(3 hour)Evapotranspiration(ET)Included in <strong>Console</strong>ISS or Temp/HumStation & Solar0.01” Hg; 0.1 mm;0.1 hPa; 0.1 mbChange RatesRapidly: ≥.06” Hg;1.5 mm Hg; 2 hPa;2mbSlowly: ≥.02” Hg;0.5 mm Hg; 0.7 hPa;0.7 mb0.01”; 0.25 mm26” to 32” Hg; 660 to810 mm; 880 to1080 hPa; 880 to1080 mb5 Arrow Positions:Rising RapidlyRising SlowlySteadyFalling SlowlyFalling RapidlyDaily to 99.99”;999.9mmMonthly & Yearly to199.99”; 1999.9mmNominal Accuracy(+/-)0.03” Hg; 0.8 mmHg; 1.0 hPa; 1.0 mbgreater of 5% or0.01”; 0.25 mmInside Humidity Included in <strong>Console</strong> 1% 10 to 90% 5% RHOutside HumidityExtra HumidityDew Point (overall)Frost/Dew Point atHigh HumidityISS or Temp/HumStationISS or Temp/HumStationISS or Temp/HumStationISS or Temp/HumStation1% 0 to 100%1% 0 to 100%1°F; 1°C1°F; 1°C-105° to +130°F; -76° to +54°C-105° to +130°F; -76° to +54°C3% RH; 4% above90%3% RH; 4% above90%3°F; 1.5°C2°F; 1°CLeaf Wetness Leaf & Soil Station 1 0 to 15 0.5Soil MoistureDaily & StormRainfallMonthly & YearlyRainfallLeaf & Soil Station orSoil Moisture StationRain Collector1 cb 0 to 200 cb0.01”; 0.25 mm to 99.99”; 999.9 mm0.01”; 0.25 mm(1 mm at totals over2000 mm)Rain Rate 0.01”; 0.25 mm (to 199.99”;19,999 mmto 100”/hr;1999.9 mm/hrgreater of 4% or1tip,greater of 4% or 1 tipgreater of 5% or0.04”/hr; 1 mm/hrSolar Radiation Solar sensor 1 W/m 2 0 to 1800 W/m 2 5% of full scaleInsideTemperatureIncluded in <strong>Console</strong>0.1°F; 0.1°C+32° to +140°F; 0 to+60°C1°F; 0.5°C
Appendix B: SpecificationsOutsideTemperature bExtra TemperatureHeat IndexTemp-Hum-Sun-Wind index(THSW)TimeISS, Temp Station orTemp Hum StationISS, Temp Station,Temp Hum Station,Leaf Soil Station orSoil StationISS or Temp/HumStationISS & SolarRadiation0.1°F; 0.1°C1°F; 1°C1°F; 1°C1°F; 1°C-40 to +150°F; -40°to +65°C-40 to +150°F-40° to +65°C-40 to +135°F;-40° to +57°C-90 to +135°F;-68° to +64°C1°F; 0.5°C1°F (0.5°C)3°F (1.5°C)4°F (2°C)1 min 24 hours 8 sec/monIncluded in <strong>Console</strong>Date 1 day month/day 8 sec/monUV Index0.1 Index 0 to 16 5% of full scaleUV DoseUV Radiation 0.1 MED < 20, 1MED > 200 to 199 MEDs 5%Wind DirectionAnemometer1° 0 to 360° 7°Compass Rose 22.5° 16 compass pts 0.3 compass ptWind Speed (largecups)Wind Speed (smallcups)TABLE 3-1: WEATHER DATA SPECIFICATIONSVariable Required Sensors Resolution Range1 mph; 1 kt; 0.5 m/s;1 km/h1 mph; 1 kt; 0.5 m/s;1 km/hWind Chill ISS 1°F; 1°C2 to 150 mph;2 to 130 kts3 to 241 km/h,1 to 68 m/s3 to 175 mph;3 to 150 kts1.5 to 79 m/s5 to 282 km/h-120° to +130°F-84° to +54°CNominal Accuracy(+/-)greater of2 mph/kts;1 m/s; 3 km/hor 5%greater of3mph; 3 kts;1 m/s; 5km/hor 5%2° F;1°Ca Barometric pressure readings are standardized to sea level. The range displayed is for the standardized value.The console can be set to standardize readings within an elevation range of -1500 to +12,500 (-460 to + 3810m); however, the console screen limits selection and display of lower elevation to -999’ when using feet aselevation unit.b Solar radiation induced error for standard radiation shield: +4°F (2°C) at solar noon; for fan-aspirated radiationshield: +0.6°F (0.3°C) at solar noon (insolation = 1040 W/m 2 , avg. wind speed ≤ 2 mph (1 m/s), reference: RMYoung Model 43408 Fan-Aspirated Radiation Shield).
FCC Part 15 Class B Registration WarningThis equipment has been tested and found to comply with the limits for a Class B digital device, pursuantto Part 15 of the FCC Rules. These limits are designed to provide reasonable protectionagainst harmful interference in a residential installation. This equipment generates, uses, and canradiate radio frequency energy and, if not installed and used in accordance with the instructions,may cause harmful interference to radio communications.However, there is no guarantee that interference will not occur in a particular installation. If thisequipment does cause harmful interference to radio or television reception, which can be determinedby turning the equipment on and off, the user is encouraged to try to correct the interferenceby one or more of the following measures:• Reorient or relocate the receiving antenna.• Increase the separation between the equipment and receiver.• Connect the equipment into an outlet on a circuit different from that to which the receiver isconnected.• Consult the dealer or an experienced radio/TV technician for help.Changes or modification not expressly approved in writing by <strong>Davis</strong> <strong>Instruments</strong> may void the warrantyand void the user's authority to operate this equipment.
9DQWDJH3UR&RQVROH,FRQV<strong>Console</strong> icons indicate weather conditions and special functions.ForecastMostly Clear Partly Cloudy Mostly Cloudy Rain Likely SnowMoon PhaseIndicates the weather forecast for the next 12 hours.New Moon First Quarter Full Moon Last Quarter New MoonShows the current moon phase. Sequence shown for NorthernHemisphere. Reverse sequence for the Southern Hemisphere.Alarm BellFlashes when an alarm is triggered. Also indicates whenthe console is in Alarm Mode.GraphAppears next to the currently selected weather variable.Also indicates the graphed variable on most screens.Second FunctionAppears when you press 2ND key. Indicates that consolekey secondary functions are enabled.2 NDRainAppears when the console is currently detecting rain.Barometric Pressure TrendArrows show direction of pressure change for last threehours.3465 Diablo Avenue, Hayward, CA 94545-2778 U.S.A.510-732-9229 • Fax: 510-732-9188E-mail: info@davisnet.com • www.davisnet.com