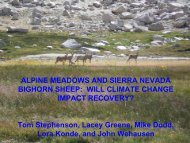
mammoth mountain ski area's response to global warming
mammoth mountain ski area's response to global warming
mammoth mountain ski area's response to global warming

Create successful ePaper yourself
Turn your PDF publications into a flip-book with our unique Google optimized e-Paper software.
Years 68-81How Real is the Threat?68-69 69-70 70-71 71-72 72-73 73-74 74-75 75-76 76-77 77-78 78-79 79-80 80-81 81-82Preseason 5.0 22.0 60.0 22.0 4.0 45.0 15.0 27.0 4.0 6.0 6.0 23.0 4.0OctNov 38.0 9.0 57.1 13.0 26.0 29.5 94.0Dec 86.0 41.0 109.0 139.8 64.5 45.0 58.5 14.5 98.0 51.5 56.0 19.0 29.5Jan 0.0 78.0 29.0 32.2 84.9 87.5 26.0 13.5 26.0 95.5 102.5 100.0 71.5 130.5Feb 156.0 30.5 19.5 11.0 103.0 9.0 101.0 54.0 27.0 97.0 96.0 133.5 17.5 28.5Mar 36.0 46.0 24.0 1.0 43.0 82.0 90.0 50.0 37.0 85.5 78.0 66.5 98.0 139.0Apr 24.0 27.0 14.0 53.5 10.0 38.0 75.0 38.5 0.0 78.5 11.5 38.0 15.0 74.5May 0.0 4.0 0.0 1.0 11.5 26.5 5.0 6.5Jun 0.0 1.0 0.0Jul 0.0SeasonTotal 345.0 244.5 255.5 268.5 370.5 306.5 378.5 197.5 94.0 487.5 386.5 444.5 230.0 502.5**Snowfall His<strong>to</strong>ry based on MMSA Ski Patrol measurement