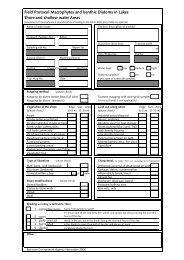
PLEENLGBcameras; recording <strong>of</strong> abundance andspecies in littoral z<strong>on</strong>e <strong>of</strong> the lakeaugmented with emergents readilyidentifiable at distance; believed to betransect using grapnel from boatfields observati<strong>on</strong>s: occurrence <strong>of</strong>submerged and emergent sensitiveangiosperm taxa; plant survey(Braun-Blanquet, 1964)mapping <strong>of</strong> the species <strong>of</strong> the wholelake, rake method, distributi<strong>on</strong> depth.vegetati<strong>on</strong> is sampled with a rake,1000 sample points, cover estimatedby eye in eight classes per species,Charophytes and mosses are alsosampled, but determined at genusleveltransect survey with grapnel;transects using a double headed rake;believed to be transect with grapnelBALTICplant compositi<strong>on</strong>, presence<strong>of</strong> indicator species,diversity <strong>of</strong> plantcommunitiesspecies compositi<strong>on</strong>, speciesdiversity, coverage anddistributi<strong>on</strong> depth PVI(percent volume infested)CENTRALspecies compositi<strong>on</strong> ,Tensley scale per speciesavailablespecies list, number <strong>of</strong>speciescol<strong>on</strong>isati<strong>on</strong> index, index<strong>of</strong> the age <strong>of</strong> ecosystem,synanthropisati<strong>on</strong> index,area covered by particularplant communitiesrelative abundance, depthdistributi<strong>on</strong>, density (shootsper m2*, PVI)total covered area,submerged macrophytes,Tansley scalerelative abundance, ranked1-4, abundance usingDAFOR scaleBEPLNLDENLESIEshore-based, rake (littoral); grid, boat, type specific speciesgrapnel (whole lake)(abundance weighted),disturbance indicators,growth formsPlant survey (Braun-Blanquet, 1964). presence <strong>of</strong> indicatorspecies, diversity <strong>of</strong> plantcommunities.Tansley scale sampling <strong>on</strong> 50 metertransects, including charophytestransect method with boat andrake/grab; mapping <strong>of</strong> ecologicallyhomogenous secti<strong>on</strong>s <strong>of</strong> the wholelittoral z<strong>on</strong>e New method for WFD,method <strong>of</strong> mapping (Kohler, 1978);aquatic spermatophyta, pteridophyta,characeae, bryophyta, rake (Jensen,1977, Engel and Nichols, 1994,Karttunen and Toiv<strong>on</strong>en, 1995)Tansley, Charophytes are alsosampled, but determined at genuslevelspecies, tansley scalemapping specificcompositi<strong>on</strong>Tansley scaleMEDITERRANEANmanual sample collecti<strong>on</strong> and grabber species abundancesamplersNORDICshoreline examinati<strong>on</strong>s and sampling frequency <strong>of</strong> occurrence,at 6m intervals al<strong>on</strong>g transects from indicator taxa, group ratiosshoreline using rake and underwatercameras.cover/ frequency (Tansley);aquatic vegetati<strong>on</strong>, shorevegetati<strong>on</strong>col<strong>on</strong>isati<strong>on</strong> index, index <strong>of</strong>the age <strong>of</strong> ecosystem,synanthropisati<strong>on</strong> index,area covered by particularplant community,abundance.abundance, tansley scaleabundance(semiquantative),abundance in differentsoundings (Kohler, 1978)5 point scale according toBraun-Blanquetcover <strong>of</strong> growth forms areestimated% coverabundance, weight <strong>of</strong>discrete samples60
NO qualitativ method species number, ALS relative abundance, areacoverageNOSEplants recorded using aqua scope andcollected by dredging from boat,whole-lake investigati<strong>on</strong> with respectto species richness, quantitativeestimate <strong>of</strong> the percentage coveragefor randomly selected squares al<strong>on</strong>g<strong>on</strong>e transect.species richness, indicatorscoresIE inshore transects using rake frequency <strong>of</strong> occurrence,indicator taxa, group ratiosrelative abundanceabundance <strong>of</strong> the species isscored by ascale(1=rare,2=scattered,3=comm<strong>on</strong>, 4=locallydominant and 5=dominant)area coverage - expertopini<strong>on</strong>percentage coverrelative abundanceBENTHIC INVERTEBRATES21. The percentage <strong>of</strong> lakes for which benthic invertebrates are sampled within theGIGs is for part most below 40%, with excepti<strong>on</strong> <strong>of</strong> AT and CE (Fig. 21).Benthic invertebratesper GIG%9080706050403020100Al AT BA CE EC ME NOFigure 21. Percentage <strong>of</strong> lakes sampled for benthic invertebrates in the GIGs.22. Sampling frequency is variable between GIGs, the most comm<strong>on</strong> frequencies are1 or 2-6 times per year, but EC countries sample a few lakes 7-12 times per year, andthe BA, AT and AL include a combinati<strong>on</strong> <strong>of</strong> different sampling frequencies (Fig.22). Sampling occurs mostly in spring and summer but in the AL and NO GIGs it isperformed most <strong>of</strong>ten in the Autumn (Fig. 23).61
- Page 1 and 2:
Institute for Environment and Susta
- Page 3 and 4:
CONTENTSBackground and purpose of t
- Page 5 and 6:
Background and purpose of the docum
- Page 7 and 8:
States and candidate countries. Inf
- Page 9 and 10: classification, each of these being
- Page 11 and 12: BIOLOGICAL QUALITY ELEMENT: PHYTOPL
- Page 13 and 14: indicators, species lists, frequenc
- Page 15 and 16: 53. The identification and enumerat
- Page 17 and 18: 64. In general, this technique is t
- Page 19 and 20: RIVER BIOLOGICAL QUALITY ELEMENT: F
- Page 21 and 22: 84. The development of specific sta
- Page 23 and 24: practice guides for identification
- Page 25 and 26: 100. The information received from
- Page 27 and 28: Evaluation of the suitability of cu
- Page 29 and 30: group should update its primary fin
- Page 31 and 32: ReferencesAFNOR (Association Franç
- Page 33 and 34: EN ISO 8689-2 Water quality - Biolo
- Page 35 and 36: Lazaridou-Dimitriadou, M., C. Kouko
- Page 37 and 38: Shannon, C.E. and W. Weaver, 1949.
- Page 39: Annex I: Composition of the Geograp
- Page 43 and 44: Annex III: River biological assessm
- Page 45 and 46: Annex IV: Analysis of lake biologic
- Page 47 and 48: Number of sampling stations10080%60
- Page 49 and 50: IT 90% acetone spectrophotometricPT
- Page 51 and 52: 10. The sampling depth and volume s
- Page 53 and 54: PTESFIIE5667-2/98 Romanianstandardi
- Page 55 and 56: Sampling stations%1008060402001 2-1
- Page 57 and 58: MACROPHYTES16. The aquatic Macrophy
- Page 59: Plants sampled per GIG1008060%40Eme
- Page 63 and 64: indicators, species lists, frequenc
- Page 65 and 66: 26. The sampling frequency is varia
- Page 67: CEN/TC 230/WG 2/ TG 4 N28, 2 nd wor
- Page 70 and 71: programs are based only on the diat
- Page 72 and 73: 21. Some countries like France, Est
- Page 74 and 75: Table 1. European methods for monit
- Page 76 and 77: countries also covers Non-EU Member
- Page 78 and 79: 49. The Danish Stream Fauna Index i
- Page 80 and 81: Hungary58. Since 2002 a modificatio
- Page 82 and 83: Acidification Index, based on the s
- Page 84 and 85: Identification is predominantly to
- Page 86 and 87: size of the net range between 250 t
- Page 88 and 89: water bug genus (Aphelocheirus) and
- Page 90 and 91: Table 5. Common abundance classific
- Page 92 and 93: 108. Process Assessment focuses on
- Page 94 and 95: Austria120. MuLFA: Ecological Integ
- Page 96 and 97: Sweden126. Swedish fish Index: Appe
- Page 98 and 99: ut comparisons have been made with
- Page 100 and 101: seasons for sampling are summer and
- Page 102 and 103: 102
- Page 104 and 105: Consultation open to ECOSTAT &inter
- Page 106 and 107: Table 1. List of European standards
- Page 108 and 109: 108
- Page 110 and 111:
development of typologySweden Yes,
- Page 112 and 113:
one or other option depends on the
- Page 114 and 115:
114
- Page 116 and 117:
• An integrated holistic evaluati
- Page 118 and 119:
• Phytoplankton: Yes; Clorophyll
- Page 120 and 121:
• Macroalgae: No• Benthic inver
- Page 122 and 123:
• Macrophytes: No• Macroalgae:
- Page 124:
Mission of the JRCThe mission of th


![Accommodation booking form [PDF]](https://img.yumpu.com/39471785/1/184x260/accommodation-booking-form-pdf.jpg?quality=85)