position of minorities in vojvodina province - Departamentul de ...
position of minorities in vojvodina province - Departamentul de ...
position of minorities in vojvodina province - Departamentul de ...

You also want an ePaper? Increase the reach of your titles
YUMPU automatically turns print PDFs into web optimized ePapers that Google loves.
Geogaphica Timisiensis, vol. 18, nr.1-2, 2009 (pp. 19-36) ●POSITION OF MINORITIES IN VOJVODINA PROVINCEBranislav S. DJURDJEVAndjelija IVKOV-DŽIGURSKIAleksandra DRAGINUniversity <strong>of</strong> Novi Sad,Faculty <strong>of</strong> Sciences,Department <strong>of</strong> Geography, Tourism and Hotel ManagementAbstract: The paper discusses the <strong>position</strong> <strong>of</strong> <strong>m<strong>in</strong>orities</strong> <strong>in</strong> Vojvod<strong>in</strong>a Prov<strong>in</strong>ce (Northern part <strong>of</strong>Serbia Republic). Strengthen<strong>in</strong>g <strong>of</strong> ethnic awareness and process <strong>of</strong> <strong>de</strong>mocratization has contributedto a broa<strong>de</strong>r list <strong>of</strong> nationalities appear<strong>in</strong>g with each new census. However, the changes <strong>in</strong> numberand share <strong>of</strong> certa<strong>in</strong> nations are evi<strong>de</strong>nt. The <strong>position</strong> <strong>of</strong> nations has been analyzed on the basis <strong>of</strong>their representation <strong>in</strong> the school system and the data <strong>of</strong> the unemployed accord<strong>in</strong>g to theirnationalities. The ma<strong>in</strong> sources used were the census results, current data, as well as the results <strong>of</strong> thequestionnaires.Rezumat: Articolul prez<strong>in</strong>tă poziţia m<strong>in</strong>orităţilor în Prov<strong>in</strong>cia Vojvod<strong>in</strong>a (nordul Republicii Serbia).Întărirea conşti<strong>in</strong>ţei entice şi procesul <strong>de</strong>mocratizării au contribuit la lărgirea listei m<strong>in</strong>orităţilor <strong>de</strong> laun recensământ la altul. Modificările în pon<strong>de</strong>rea unor m<strong>in</strong>orităţi sunt evi<strong>de</strong>nte. Poziţia naţiunilor afost analizată pe baza reprezentării în sistemul şcolar şi a datelor <strong>de</strong>spre structura etnică a şomerilor.Pr<strong>in</strong>cipalele surse au fost: recensăm<strong>in</strong>tele, înregistrările curente şi chestionarele.Key words: Vojvod<strong>in</strong>a Prov<strong>in</strong>ce, Serbia, ethnic structure, national <strong>m<strong>in</strong>orities</strong>, <strong>de</strong>mographictransitionCuv<strong>in</strong>te cheie: Prov<strong>in</strong>cia Vojvod<strong>in</strong>a, structură etnică, m<strong>in</strong>orităţi naţionale, tranziţie <strong>de</strong>mograficăDur<strong>in</strong>g the last three centuries the Vojvod<strong>in</strong>a Prov<strong>in</strong>ce has changed several masters,like Turks, Austrians, Hungarians, Yugoslavs, and Serbs. Each <strong>of</strong> them were fulfill<strong>in</strong>g thisarea with their own or loyal nationality. Ethnic complexity <strong>of</strong> the Serbian Prov<strong>in</strong>ce <strong>of</strong>Vojvod<strong>in</strong>a is observed through a large number <strong>of</strong> nationalities, the number <strong>of</strong> people, andtheir share <strong>in</strong> the total population, and what is more important <strong>in</strong> their distribution andmutual relations. Similar ethnic variety <strong>in</strong> Europe can only be encountered <strong>in</strong> the area <strong>of</strong>Caucasus.Ethnic heterogeneity is evi<strong>de</strong>nt on municipal and settlement level, thus the symmetry<strong>in</strong> spatial distribution <strong>of</strong> certa<strong>in</strong> nationalities is difficult to ascerta<strong>in</strong> for most <strong>of</strong> thembecause there are no “ethnic cores” likewise <strong>in</strong> other parts <strong>of</strong> the world, where nations live<strong>in</strong> ethnically “pure” settlements. Industrial centres, settlements <strong>in</strong> their vic<strong>in</strong>ity as well asthe settlements near the state and prov<strong>in</strong>cial bor<strong>de</strong>rs have ethnically the most heterogeneouspopulation.The <strong>de</strong>velopment <strong>of</strong> the ethnic structure <strong>in</strong> the area <strong>of</strong> the present Vojvod<strong>in</strong>a <strong>in</strong> theperiod between the 1921 and 2001 censuses may be divi<strong>de</strong>d <strong>in</strong>to several phases. The first
● Position <strong>of</strong> <strong>m<strong>in</strong>orities</strong> <strong>in</strong> Vojvod<strong>in</strong>a Prov<strong>in</strong>ce20one was connected with the period <strong>of</strong> Austrian-Hungarian dom<strong>in</strong>ation by the year 1918. Itsma<strong>in</strong> feature was the <strong>in</strong>crease <strong>in</strong> the absolute number <strong>of</strong> all ethnic groups.In the period between 1899 and 1913 the territory <strong>of</strong> the present Vojvod<strong>in</strong>a,predom<strong>in</strong>antly the Banat region was subjected to large emigrations. It has been estimatedthat between 100,000 and 150,000 people emigrated from this territory, ma<strong>in</strong>ly to theUnited States and other transatlantic countries. More than a half <strong>of</strong> the emigrants wereGermans, whereas the members <strong>of</strong> other ethnic communities participated less frequently <strong>in</strong>the emigration process.After the First World War (1914-1918), the population <strong>of</strong> all ethnic groups<strong>in</strong>creased, with the exception <strong>of</strong> Germans and Hungarians, s<strong>in</strong>ce there was a largeemigration <strong>of</strong> state <strong>of</strong>ficials and bra<strong>in</strong>power to their countries <strong>of</strong> orig<strong>in</strong>. Extreme <strong>in</strong>crease <strong>in</strong>number was registered with Croats, as the result <strong>of</strong> the fact that Bunjevci started <strong>de</strong>clar<strong>in</strong>gas Croats, i.e. they converted <strong>in</strong>to Croats.The Second World War brought large consequences to the ethnic structure <strong>of</strong> thepopulation <strong>of</strong> Vojvod<strong>in</strong>a Prov<strong>in</strong>ce (Ivkov, 2005). New Yugoslav legislation accusedGermans for collaboration with the Nazi army and <strong>in</strong> accordance with the <strong>de</strong>cision <strong>of</strong>communistic government (from November 21, 1944) all their properties were taken away(except from Germans who participated <strong>in</strong> anti-Nazi movement dur<strong>in</strong>g the war). Accord<strong>in</strong>gto 1948 census only 29589 Germans lived <strong>in</strong> Vojvod<strong>in</strong>a Prov<strong>in</strong>ce which was only 8.8% <strong>of</strong>their number <strong>in</strong> 1921 census (Djurdjev, 1986; Djurdjev 1994).1. CENSUS DATA COLLECTION ABOUT NATIONALITIES IN 20 THCENTURYThe first population census <strong>in</strong> the former K<strong>in</strong>gdom <strong>of</strong> Serbs, Croats and Slovenes,on January 31 st , 1921, did not <strong>in</strong>clu<strong>de</strong> the question about nationality. Ethnic structure wasreconstructed on the basis <strong>of</strong> mother tongue and religion.The results extracted three groups:a) Nations (Serbs or Croats, Slovenes, Czechs, Ruthenians, Little Russians, Polish,Russians, Hungarians, Germans, Arnauts, Turks, Romanians, Italians, English,French)b) others andc) unknownThe data on the number <strong>of</strong> Macedonians and Montenegr<strong>in</strong>s were not possible to obta<strong>in</strong>because neither those two nationalities existed at that time, nor the Macedonian languagewas <strong>of</strong>ficially recognized.The 1931 census first <strong>in</strong>troduced the questions about the mother tongue, religion andnationality. Everyone could freely <strong>de</strong>clare their nationalities and mother tongues. S<strong>in</strong>ce theK<strong>in</strong>gdom <strong>of</strong> Serbs, Croats and Slovenes changed its name <strong>in</strong>to the K<strong>in</strong>gdom <strong>of</strong> Yugoslavia<strong>in</strong> 1929, the country’s policy grouped all the Yugoslav nationalities from the publishedresults un<strong>de</strong>r the title Yugoslav nationalities, speak<strong>in</strong>g Yugoslav language, for nationalitiesoutsi<strong>de</strong> the group the precise data on nationality were given.After the Second World War, the republics were formed associated with one ma<strong>in</strong>nationality, except for Bosnia and Herzegov<strong>in</strong>a and Croatia. Constitutive nation togetherwith Croats <strong>in</strong> Croatia were also Serbs. In Bosnia and Herzegov<strong>in</strong>a, apart from Serbs and20
● Position <strong>of</strong> <strong>m<strong>in</strong>orities</strong> <strong>in</strong> Vojvod<strong>in</strong>a Prov<strong>in</strong>ce24Table 2 Population <strong>of</strong> Vojvod<strong>in</strong>a accord<strong>in</strong>g to national and ethnic belong<strong>in</strong>g, <strong>in</strong>1991 and 2002Structura populaţiei Vojvod<strong>in</strong>ei conform aparteneţei entice şi naţionale,în 1991 şi 2002NationalityCensus 1991 Census 2002Number % Number %Total 2,013,889 100.0 2,031,992 100.0Serbs 1,143,723 56.8 1,321,807 65.0Montenegr<strong>in</strong>s 44,838 2.2 35,513 1.7Yugoslavs 174,295 8.7 49,881 2.5Albanians 2,556 0.1 1,695 0.1Bosniaks - - 417 0.0Bulgarians 2,363 0.1 1,658 0.1Bunjevci 21,434 1.1 19,766 1.0Vlachs 132 0.0 101 0.0Goranci - - 606 0.0Hungarians 339,491 16.9 290,207 14.3Macedonians 17,472 0.9 11785 0.6Moslems 5,851 0.3 3,634 0.2Germans 3,873 0.2 3,154 0.2Romas 24366 1.2 29,057 1.4Romanians 38809 1.9 30,419 1.5Russian 1,019 0.1 940 0.0Ruthenians 17,652 0.9 15,626 0.8Slovaks 63,545 3.2 56,637 2.8Slovenians 2,730 0.1 2,005 0.1Ukra<strong>in</strong>ians 4,565 0.2 4,635 0.2Croats 74,808 3.7 56,546 2.8Czechs 1,844 0.1 1,648 0.1Others 5,100 0.3 5,311 0.3Un<strong>de</strong>clared and un<strong>de</strong>ci<strong>de</strong>d 5,427 0.3 55,016 2.7Regional belong<strong>in</strong>g 2,503 0.1 10,154 0.5Unknown 15,493 0.8 23,774 1.2Source: Census data for 1991 and 2002. Fe<strong>de</strong>ral (s<strong>in</strong>ce 2002 census, Republic) Office <strong>of</strong>Statistic, Belgra<strong>de</strong>24
Branislav ĐURĐEV, Andjelija IVKOV-DŽIGURSKI, Aleksandra DRAGIN ● 252. CHANGES IN THE SHARE OF NATIONALITIES IN TOTALPOPULATIONDur<strong>in</strong>g the post war period and up to the 1960s, the number <strong>of</strong> almost all ethnicgroups was <strong>in</strong>creas<strong>in</strong>g due to the high natural growth rate. Slightly more dynamic <strong>in</strong>creasewas recor<strong>de</strong>d among Serbs and Montenegr<strong>in</strong>s s<strong>in</strong>ce most <strong>of</strong> the population that arrived toVojvod<strong>in</strong>a dur<strong>in</strong>g the colonization period were <strong>of</strong> the same orig<strong>in</strong> com<strong>in</strong>g from other parts<strong>of</strong> the former SFRY. However, as soon as that period en<strong>de</strong>d there was the <strong>de</strong>crease <strong>of</strong>natural growth, which led to <strong>de</strong>crease <strong>in</strong> number <strong>of</strong> most <strong>of</strong> the ethnic groups <strong>in</strong> Vojvod<strong>in</strong>a.Serbs recor<strong>de</strong>d <strong>in</strong>crease even <strong>in</strong> this period, which was the result <strong>of</strong> assimilation an<strong>de</strong>migration, whereas the <strong>in</strong>crease recor<strong>de</strong>d with Montenegr<strong>in</strong>s was the result <strong>of</strong> theircont<strong>in</strong>uous immigration.Ethnic heterogeneousness is the consequence <strong>of</strong> a large number <strong>of</strong> mixed marriagesand a large number <strong>of</strong> those who <strong>de</strong>clared as Yugoslavs, which f<strong>in</strong>ally led them to the<strong>position</strong> <strong>of</strong> the third largest group <strong>in</strong> 1981.The beg<strong>in</strong>n<strong>in</strong>g <strong>of</strong> 1990s announced new significant changes <strong>in</strong> the ethnic structure <strong>of</strong>the population <strong>in</strong> Vojvod<strong>in</strong>a. Nationalism was flourish<strong>in</strong>g <strong>in</strong> the former republics <strong>of</strong> SFRYwhich resulted <strong>in</strong> migrations <strong>of</strong> Yugoslav nations to their home countries.One third <strong>of</strong> the forced migrants found their refuge <strong>in</strong> Vojvod<strong>in</strong>a. Consequently,such exodus <strong>of</strong> the population, which has never been recor<strong>de</strong>d <strong>in</strong> the history <strong>of</strong> this area,had to reflect to the ethnic structure <strong>of</strong> Vojvod<strong>in</strong>a.The reasons were numerous, the emigration <strong>of</strong> Croats and their re-<strong>de</strong>claration asBunjevci and Sokci, as well as the immigration <strong>of</strong> Serbs from Croatia and Bosnia andHerzegov<strong>in</strong>a. With the burst out <strong>of</strong> the war <strong>in</strong> the former SFRY, such processes reachedtheir peaks. Masses <strong>of</strong> Serbian refugees found refuge <strong>in</strong> Vojvod<strong>in</strong>a, whereas a number <strong>of</strong>national <strong>m<strong>in</strong>orities</strong> left Vojvod<strong>in</strong>a Prov<strong>in</strong>ce. However, the reasons for their immigrationwere not merely political but also economic, due to difficult liv<strong>in</strong>g conditions un<strong>de</strong>r<strong>in</strong>ternational economic sanctions to FR Yugoslavia. For that reason a part <strong>of</strong> domesticSerbian population also left Vojvod<strong>in</strong>a Prov<strong>in</strong>ce.Altogether, it led to certa<strong>in</strong> changes <strong>in</strong> the ethnic structure <strong>of</strong> Vojvod<strong>in</strong>a. Althoughthe ethnic variety has been preserved to a great extent, both the number <strong>of</strong> certa<strong>in</strong> nationsand their share <strong>in</strong> the total population <strong>of</strong> Vojvod<strong>in</strong>a have changed.Accord<strong>in</strong>g to the 1948 census data, four nations formed majorities <strong>in</strong> most <strong>of</strong> themunicipalities <strong>in</strong> Vojvod<strong>in</strong>a. Apart from Serbs other three nations form<strong>in</strong>g majorities were:Hungarians, Slovaks and Romanians. Serbs formed a majority <strong>in</strong> six municipalities:Sombor, Kula, Vrbas, Apat<strong>in</strong>, Bač and Plandište. In twenty-seven municipalities Serbsformed an absolute majority. Hungarians formed an absolute majority <strong>in</strong> n<strong>in</strong>emunicipalities.On the basis <strong>of</strong> the 2002 census data, first the <strong>in</strong>crease <strong>of</strong> 9% <strong>in</strong> Serbian populationwas noticeable, then the <strong>de</strong>crease <strong>of</strong> 1% <strong>in</strong> Croatian population (<strong>in</strong> part due to immigrationprocess and <strong>in</strong> part to their <strong>de</strong>claration as Bunjevci and Šokci). More <strong>de</strong>tailed analysis <strong>of</strong>the results <strong>of</strong> the latest 2002 census po<strong>in</strong>ts out the <strong>de</strong>crease <strong>of</strong> the share <strong>of</strong> othernationalities. Thus, there has been a significant <strong>de</strong>crease <strong>of</strong> 2.5% <strong>in</strong> Hungarian population,whereas among other nations (Slovaks, Ruthenians and Romanians) the <strong>de</strong>crease has beenabout 0.5%.
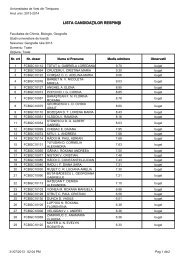
● Position <strong>of</strong> <strong>m<strong>in</strong>orities</strong> <strong>in</strong> Vojvod<strong>in</strong>a Prov<strong>in</strong>ce26Interest<strong>in</strong>gly enough there was the <strong>de</strong>crease <strong>of</strong> the share <strong>of</strong> those <strong>de</strong>clar<strong>in</strong>gthemselves as Yugoslavs. Accord<strong>in</strong>g to the 1991 census, it was recor<strong>de</strong>d that their sharewas 8.7% <strong>of</strong> the total population <strong>in</strong> Vojvod<strong>in</strong>a. The latest census data show that thepercentage lowered to 2.5%. This phenomenon might have been expected, because fall<strong>in</strong>gapart <strong>of</strong> the former SFRY, <strong>in</strong>itiated that most <strong>of</strong> those who used to <strong>de</strong>clare as Yugoslavs(ma<strong>in</strong>ly from mixed marriages) <strong>de</strong>ci<strong>de</strong>d upon the nation <strong>of</strong> either parent (Ivkov, 2006a).In comparison to 1948 census data, the 2002 census data recor<strong>de</strong>d m<strong>in</strong>imal changes<strong>in</strong> the national majority. Only the share <strong>of</strong> the national majority changed, with theexception <strong>of</strong> Alibunar <strong>in</strong> which Romanians formed a relative national majority <strong>in</strong> 1948, but<strong>in</strong> 2002 Serbs formed an absolute national majority. At the same time, it was the onlymunicipality <strong>in</strong> which Romanians formed a national majority <strong>in</strong> 1948. Furthermore,Hungarians “lost” Temer<strong>in</strong> where Serbs form an absolute majority today (fig. 1).Fig. 1a. Population share <strong>of</strong> the largest nationality <strong>in</strong> the municipalities <strong>of</strong>Vojvod<strong>in</strong>a accord<strong>in</strong>g to the 1948 census dataPon<strong>de</strong>rea celei mai numeroase naţionaităţi în municipalităţile Prov<strong>in</strong>ciei Vojvod<strong>in</strong>a,conform recensământului d<strong>in</strong> 194826
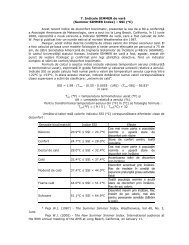
Branislav ĐURĐEV, Andjelija IVKOV-DŽIGURSKI, Aleksandra DRAGIN ● 27Fig. 1b Population share <strong>of</strong> the largest nationality <strong>in</strong> the municipalities <strong>of</strong>Vojvod<strong>in</strong>a accord<strong>in</strong>g to the 2002 census dataPon<strong>de</strong>rea celei mai numeroase naţionaităţi în municipalităţile Prov<strong>in</strong>ciei Vojvod<strong>in</strong>a,conform recensământului d<strong>in</strong> 20023. GENDER STRUCTURE OF ETHNIC GROUPSThe analysis <strong>of</strong> the census data <strong>in</strong> 1991 and 2002 reveals the dom<strong>in</strong>ance <strong>of</strong> femalepopulation whose share accord<strong>in</strong>g to the 1991 census data was 51.3% and to the 2002census data it was 51.5% (table 3).Accord<strong>in</strong>g to the 1991 census data the surplus <strong>of</strong> the male population was recor<strong>de</strong>dwith Albanians, Moslems, Montenegr<strong>in</strong>s and Roma, whereas with other nations the surplus<strong>of</strong> female population was registered, especially with Croats and Yugoslavs.The 2002 census <strong>in</strong>dicated that the surplus <strong>of</strong> male population was recor<strong>de</strong>d as <strong>in</strong> theprevious census with Moslems, Roma, Montenegr<strong>in</strong>s and Albanians especially (64.2%). Ifthe results are compared, it is evi<strong>de</strong>nt that only with Montenegr<strong>in</strong>s and Roma (Ivkov,Drag<strong>in</strong>, Kovačević, 2007) there was and <strong>in</strong>crease <strong>in</strong> the share <strong>of</strong> male population comparedto female <strong>in</strong> 2002, <strong>of</strong> 0.7% and 0.2% respectively.The surplus <strong>of</strong> male population with those ethnic groups is expla<strong>in</strong>ed by selectivemigrations.As far as female population is concerned, the highest share <strong>of</strong> females <strong>in</strong> 2002 wasrecor<strong>de</strong>d with Croats (56.6%), then followed Yugoslavs (52.9%), and Hungarians (52.7%).
● Position <strong>of</strong> <strong>m<strong>in</strong>orities</strong> <strong>in</strong> Vojvod<strong>in</strong>a Prov<strong>in</strong>ce28The similar situation was recor<strong>de</strong>d <strong>in</strong> the 1991 census, when the share <strong>of</strong> female populationwas slightly smaller: Croats (53.9%), Yugoslavs (52.8%) and Hungarians (54.2%).Table 3 Gen<strong>de</strong>r structure <strong>of</strong> the most frequent ethnic groups <strong>in</strong> Vojvod<strong>in</strong>a(censuses 1991 and 2002)Structura pe genuri a celor mai importante grupuri entice d<strong>in</strong> Vojvod<strong>in</strong>a(recensăm<strong>in</strong>tele 1991 şi 2002)Males and females ratioCensus 1991 Census 2002EthnicgroupsAbsolute Relative (%) Absolute Relative (%)male female mal female male female mal femaleeeSerbs 563,317 580,406 49.3 50.7 646,404 675,403 48.9 51.1Montenegr<strong>in</strong>s 23,738 21,100 52.9 47.1 19,047 16,466 53.6 46.4Yugoslavs 82,263 92,032 47.2 52.8 23,475 26,406 47.1 52.9Alban<strong>in</strong>as 1,678 878 65.5 34.4 1,088 607 64.2 35.8Hungarians 161,632 177,859 47.6 52.4 137,145 153,062 47.3 52.7Moslems 3,111 2,740 53.2 46.8 1,847 1,787 50.8 49.2Romas 12,411 11,955 50.9 49.1 14,855 14,202 51.1 48.9Romanians 18,940 19,869 48.8 51.2 14,658 15,761 48.2 51.8Slovaks 30,688 32,857 48.3 51.7 27,151 29,486 47.9 52.1Croats 34,521 40,287 46.1 53.9 24,527 32,019 43.4 56.6Others 48,432 53,175 47.7 52.3 74,745 81,851 47.7 52.3Vojvod<strong>in</strong>a 980,731 1,033,15 48.7 51.3 984,942 1,047,05 48.5 51.580Source: Fe<strong>de</strong>ral <strong>of</strong> Statistics, Population census 1991, book 5: gen<strong>de</strong>r and age accord<strong>in</strong>gto ethnic belong<strong>in</strong>g, Fe<strong>de</strong>ral Office <strong>of</strong> Statistics, Belgra<strong>de</strong> 1993 and Population,households and flats census <strong>in</strong> 2002, Religion, mother tongue, and national or ethnicbelong<strong>in</strong>g accord<strong>in</strong>g to age and gen<strong>de</strong>r, Book 3 , Belgra<strong>de</strong> 2003The balanced gen<strong>de</strong>r structure was recor<strong>de</strong>d with Serbs, which was expected due tothe fact that as the largest ethnic group on the territory <strong>of</strong> Vojvod<strong>in</strong>a, they rarely got<strong>in</strong>fluenced by outsi<strong>de</strong> factors (Ivkov, 2006a).4. REPRESENTATION OF MINORITIES IN THE SCHOOL SYSTEMPrimary education <strong>in</strong> mother tongues <strong>of</strong> national <strong>m<strong>in</strong>orities</strong> is conducted if there areat least 15 stu<strong>de</strong>nts who enrolled the first gra<strong>de</strong>, but there is the option for the school toopen the m<strong>in</strong>ority gra<strong>de</strong> for even the smaller number <strong>of</strong> stu<strong>de</strong>nts. On the other hand for them<strong>in</strong>ority stu<strong>de</strong>nts attend<strong>in</strong>g the school programme <strong>in</strong> Serbian, there is a course <strong>of</strong> mothertongue along with the elements <strong>of</strong> national culture with<strong>in</strong> the elective group <strong>of</strong> courses, twoclasses per week, <strong>in</strong> case the pupils or parents are <strong>in</strong>terested <strong>in</strong> the course.Hungarians. Primary education <strong>in</strong> Hungarian was conducted <strong>in</strong> 29 municipalities,113 educational units, i.e. 83 primary schools and 35 subsidiary units <strong>in</strong> the 1997/199828
Branislav ĐURĐEV, Andjelija IVKOV-DŽIGURSKI, Aleksandra DRAGIN ● 29school year. At that time, the application <strong>of</strong> at least five stu<strong>de</strong>nts was required to start theteach<strong>in</strong>g process <strong>in</strong> Hungarian language.The total number <strong>of</strong> Hungarian stu<strong>de</strong>nts <strong>in</strong> primary education was 27,140, out <strong>of</strong>which 21,496 or 79.2% were educated <strong>in</strong> their mother tongue. The rema<strong>in</strong><strong>in</strong>g 5,633 or20.8% pupils were educated <strong>in</strong> Serbian language, but they were provi<strong>de</strong>d with an electivecourse <strong>in</strong> Hungarian language with elements <strong>of</strong> national culture twice a week. 1,732Hungarian stu<strong>de</strong>nts out <strong>of</strong> those 5,633 atten<strong>de</strong>d the course.9,502 Hungarian stu<strong>de</strong>nts atten<strong>de</strong>d secondary education <strong>in</strong> the same year. 6,575 out<strong>of</strong> the total number <strong>of</strong> Hungarian stu<strong>de</strong>nts or 69.2% <strong>of</strong> them were educated <strong>in</strong> their mothertongue.Hungarian stu<strong>de</strong>nts received education <strong>in</strong> their mother tongue at three highereducation <strong>in</strong>stitutions: Advanced School for Teachers <strong>in</strong> Novi Sad and Subotica, andAdvanced Technical School <strong>in</strong> Subotica. At university level, the educational process <strong>in</strong>Hungarian language was conducted at the Faculty <strong>of</strong> Philosophy, Faculty <strong>of</strong> Economics,Faculty for Teachers, and the Aca<strong>de</strong>my <strong>of</strong> Arts (Ivkov, 2006). Hungarian stu<strong>de</strong>nts make9.0% (579) <strong>of</strong> the total number <strong>of</strong> higher education stu<strong>de</strong>nts, out <strong>of</strong> that 579 stu<strong>de</strong>nts, 264stu<strong>de</strong>nts attend lectures <strong>in</strong> Serbian, and 315 <strong>in</strong> Hungarian. 1,703 Hungarian stu<strong>de</strong>nts or6.4% <strong>of</strong> the total number <strong>of</strong> university stu<strong>de</strong>nts <strong>in</strong> Vojvod<strong>in</strong>a atten<strong>de</strong>d university education.Out <strong>of</strong> that number, 1,703 stu<strong>de</strong>nts atten<strong>de</strong>d lectures <strong>in</strong> Serbian and 411 <strong>in</strong> Hungarianlanguage.Slovaks. Parallel to the use <strong>of</strong> Serbian language and alphabet, there is <strong>of</strong>ficiallyacknowledged use <strong>of</strong> Slovakian language and alphabet <strong>in</strong> the municipalities <strong>of</strong> Alibunar,Bač, Bačka Palanka, Bačka Topola, Bački Petrovac, Beoč<strong>in</strong>, Zrenjan<strong>in</strong>, Kovačica, Odžaci,Plandište, Stara Pazova, Šid and the town <strong>of</strong> Novi Sad (Ivkov, 2006).In the school year 1997/1998, educational process <strong>in</strong> Slovakian language wasconducted <strong>in</strong> 12 municipalities, 17 primary schools and 2 subsidiary units with the totalnumber <strong>of</strong> 3,909 stu<strong>de</strong>nts <strong>in</strong> 185 gra<strong>de</strong>s. The educational process <strong>in</strong> mother tonguecomprised 73.5% <strong>of</strong> the total number <strong>of</strong> Slovak stu<strong>de</strong>nts <strong>in</strong> primary education. Bil<strong>in</strong>gualeducation <strong>in</strong> Serbian and Slovak languages was conducted <strong>in</strong> two municipalities, i.e. twoprimary schools with 115 stu<strong>de</strong>nts <strong>in</strong> 5 gra<strong>de</strong>d. For other 707 stu<strong>de</strong>nts who were educated<strong>in</strong> Serbian language, there was an elective course <strong>in</strong> Slovak language with elements <strong>of</strong>national culture twice a week <strong>in</strong> the school year 1998/1999.1,861 stu<strong>de</strong>nts <strong>of</strong> Slovak nationality atten<strong>de</strong>d secondary schools <strong>in</strong> the school year1997/1998, out <strong>of</strong> which 390 stu<strong>de</strong>nts or 21.0% were educated <strong>in</strong> their mother tongue. Theeducational process <strong>in</strong> Slovak language was organized <strong>in</strong> two secondary schools (grammarschools <strong>in</strong> Bački Petrovac and Kovačica), precisely <strong>in</strong> 13 gra<strong>de</strong>s. The learn<strong>in</strong>g <strong>of</strong> mothertongue with elements <strong>of</strong> national culture was organized for 221 stu<strong>de</strong>nts <strong>of</strong> Slovaknationality who were educated <strong>in</strong> Serbian language <strong>in</strong> seven secondary schools.In the school year 1997/1998, <strong>in</strong>stitutions <strong>of</strong> higher education were atten<strong>de</strong>d by 92stu<strong>de</strong>nts <strong>of</strong> Slovak nationality or 1.1% <strong>of</strong> the total number <strong>of</strong> university stu<strong>de</strong>nts. Out <strong>of</strong>that number 30 stu<strong>de</strong>nts were educated <strong>in</strong> their mother tongue (Department <strong>of</strong> Slovaklanguage at the Faculty <strong>of</strong> Philosophy <strong>in</strong> Novi Sad). The subsidiary <strong>of</strong> Teachers’ Facultyfrom Sombor has been opened <strong>in</strong> Bački Petrovac, where the stu<strong>de</strong>nts atten<strong>de</strong>d lectures <strong>in</strong>Slovak language and prepare for teach<strong>in</strong>g hobs <strong>in</strong> Slovak language.
Branislav ĐURĐEV, Andjelija IVKOV-DŽIGURSKI, Aleksandra DRAGIN ● 31There are 8,236 books <strong>in</strong> Ruthen<strong>in</strong>an language <strong>in</strong> the libraries <strong>of</strong> municipalities <strong>of</strong>Bačka Topola, Vrbas, Žabalj, Kula, Šid and the town <strong>of</strong> Novi Sad (Ivkov, 2006).Roma. The largest number <strong>of</strong> Roma stu<strong>de</strong>nts received education <strong>in</strong> Serbian,Hungarian, Slovak and Ruthenian language. Elective Romany language teach<strong>in</strong>g wasorganized <strong>in</strong> two primary schools (Tovariševo and Obrovac). In 2000 an ABC book <strong>in</strong>Romany language was published.Ukra<strong>in</strong>ians. For 117 stu<strong>de</strong>nts <strong>in</strong> five primary schools <strong>in</strong> the municipalities <strong>of</strong> Vrbasand Kula the educational process was conducted <strong>in</strong> Ukra<strong>in</strong>ian with elements <strong>of</strong> nationalculture. S<strong>in</strong>ce 1998, there has been a summer school for preserv<strong>in</strong>g the Ukra<strong>in</strong>ian language<strong>in</strong>ten<strong>de</strong>d for children <strong>of</strong> Ukra<strong>in</strong>ian orig<strong>in</strong>.Croats, Bunjevci. Croatian language is <strong>of</strong>ficially used <strong>in</strong> the municipality <strong>of</strong>Subotica. Dur<strong>in</strong>g the 19 th century, a number <strong>of</strong> young Bunjevci population was educated <strong>in</strong>monastery’s public school <strong>of</strong> the Sisters <strong>of</strong> the Community <strong>of</strong> Our Lady.5. UNEMPLOYED PERSONS ACCORDING TO NATIONALITYAt present, labour market is not trac<strong>in</strong>g the national structure <strong>of</strong> the unemployed.Every unemployed person fills <strong>in</strong> a form with some <strong>in</strong>formation required, among whichnationality <strong>de</strong>claration is <strong>de</strong>man<strong>de</strong>d, but still the data have not been processed <strong>in</strong> the total.The data on national belong<strong>in</strong>g <strong>of</strong> the unemployed have not been published <strong>in</strong> any form onthe basis <strong>of</strong> the censuses after the Second World War. The national structure analysis <strong>of</strong> theunemployed is based on the data from the unpublished reports <strong>of</strong> Labour Market. Amongthe unemployed the lead<strong>in</strong>g <strong>position</strong> is occupied by Serbs (59.1 %), and then followHungarians (14.8 %), Yugoslavs (6.8 %), Roma (4.4 %), Slovaks (2.6 %), Croats (2.4 %),Montenegr<strong>in</strong>s (1.8 %) etc. Ethnic structure <strong>of</strong> the unemployed complies with the ethnicstructure <strong>of</strong> the total population. For example, Croats had the share <strong>of</strong> 2.8% <strong>in</strong> the totalpopulation and 2.3% <strong>in</strong> the unemployed <strong>in</strong> 2002. The second largest ethnic group,Hungarians had the share <strong>of</strong> 14.3% <strong>in</strong> the total population and 14.8% <strong>in</strong> the unemployed.The <strong>de</strong>viation was observed with the Roma group who had the share <strong>of</strong> 1.4% <strong>in</strong> the totalpopulation <strong>of</strong> Vojvod<strong>in</strong>a and 4.4% <strong>in</strong> the unemployed. However, it should be consi<strong>de</strong>redthat the education <strong>of</strong> Roma is on a lower level <strong>in</strong> comparison to other ethnic groups (table4).The Central Serbia is an ethnically homogenous territory, with Serbs hav<strong>in</strong>g theshare <strong>of</strong> 89.5% <strong>in</strong> the total population. Therefore, the analysis <strong>of</strong> ethnic structure <strong>of</strong> theunemployed is unnecessary.The analysis <strong>of</strong> unemployment <strong>in</strong> the municipalities <strong>of</strong> Vojvod<strong>in</strong>a (Ivkov,Kovačević, Drag<strong>in</strong>, Djurdjev, Ivanović, 2007), accord<strong>in</strong>g to variations <strong>in</strong> their ethnicstructure (Ivkov, Romelić, Lazić, Drag<strong>in</strong>, Ivanović, 2007), may <strong>in</strong>dicate possiblediscrim<strong>in</strong>ation <strong>in</strong> employment procedure. The analysis by counties 1 and municipalities <strong>of</strong>Vojvod<strong>in</strong>a shows that <strong>in</strong> the period 2000-2002 the highest <strong>in</strong>crease <strong>in</strong> unemployment wasrecor<strong>de</strong>d <strong>in</strong> Srem (table 5). The <strong>in</strong><strong>de</strong>x value <strong>of</strong> 134.18 assigned this county the lead<strong>in</strong>g<strong>position</strong>, then followed Severno-banatski (<strong>in</strong><strong>de</strong>x 128.3), Zapadno-bački (<strong>in</strong><strong>de</strong>x 124.6), etc.1 The territory <strong>of</strong> Vojvod<strong>in</strong>e comprises seven adm<strong>in</strong>istrative units, counties: Severno-bački(Subotica), Zapadno-bački (Sombor), Južno-bački (Novi Sad), Severno-banatski (Kik<strong>in</strong>da),Srednje-banatski (Zrenjan<strong>in</strong>), Južno-banatski (Pančevo), Sremski (Sremska Mitrovica).
● Position <strong>of</strong> <strong>m<strong>in</strong>orities</strong> <strong>in</strong> Vojvod<strong>in</strong>a Prov<strong>in</strong>ce32Table 4 Total population and unemployed persons accord<strong>in</strong>g to nationality, <strong>in</strong>Vojvod<strong>in</strong>a 2002Populaţia totală şi şomerii pe naţionalităţi, în Vojvod<strong>in</strong>a2002Nationality Unemploye % Total %dSerbs 86,894 59.1 1,321,80 65.07Montenegr<strong>in</strong>s 2,629 1.8 35,513 1.7Yugoslavs 10,042 6.8 49,881 2.5Albanians 296 0.2 1,695 0.1Bulgarians 59 0.0 1,658 0.1Hungarians 21,861 14.8 290,207 14.3Macedonians 2,264 1.5 11,785 0.6Moslems 669 0.4 3,634 0.2Germans 864 0.6 3,154 0.2Romas 6,415 4.4 29,057 1.4Romanians 2,154 1.5 30,419 1.5Russians 44 0.0 940 0.0Ruthenians 1,342 0.9 15,626 0.8Slovaks 3,808 2.6 56,637 2.8Slovenians 979 0.7 2,005 0.1Ukra<strong>in</strong>ians 353 0.2 4,635 0.2Croats 3,552 2.4 56,646 2.8Czechs 112 0.1 1,648 0.1Greeks 68 0.0 - -Danes 201 0.1 - -Italians 38 0.0 - -Jews 73 0.0 - -Polish 67 0.0 - -Others 258 0.2 5,311 0.3Un<strong>de</strong>clared and un<strong>de</strong>ci<strong>de</strong>d 1,718 1.2 55,016 2.7Regional belong<strong>in</strong>g 352 0.2 10,154 0.5Total 147,117 100.02,031,992100.0Source: data on unemployed from annual reports <strong>of</strong> the Republic Office for Labour MarketEmployment - Novi Sad. The reports are not published; national structure <strong>of</strong> the totalpopulation: Announcement 252, 2002:2Note: The segment up to the total number <strong>of</strong> the unemployed is <strong>of</strong> unknown nationality.With<strong>in</strong> the Srem County the highest <strong>in</strong>crease <strong>in</strong> the unemployment was <strong>in</strong> themunicipality <strong>of</strong> Irig (127.0) which was significantly higher than the mean value forVojvod<strong>in</strong>a (118.9). Dom<strong>in</strong>at<strong>in</strong>g nationality <strong>in</strong> the municipality <strong>of</strong> Ruma as well as <strong>in</strong> Irig is32
Branislav ĐURĐEV, Andjelija IVKOV-DŽIGURSKI, Aleksandra DRAGIN ● 33Serbian. In Ruma its share was 86.6% <strong>in</strong> the total population, and <strong>in</strong> Irig 79.5%. InSeverno-banatski County, the number <strong>of</strong> the unemployed <strong>in</strong>creased significantly <strong>in</strong> themunicipality <strong>of</strong> Čoka. The <strong>in</strong><strong>de</strong>x value <strong>of</strong> 121.55 <strong>in</strong>dicated the largest <strong>in</strong>crease <strong>in</strong>unemployment <strong>in</strong> relation to all other municipalities <strong>in</strong> Vojvod<strong>in</strong>a. The municipality <strong>of</strong>Čoka has ethnically heterogeneous structure. The two largest ethnic groups, Hungarians(51.6 %) and Serbs (37.6 %) make 89.2% <strong>of</strong> the total population. Conclusions about ethnicdiscrim<strong>in</strong>ation <strong>in</strong> the employment process must not be ma<strong>de</strong> upon this data, e.g. Hungarianshave the share 86.5% <strong>in</strong> the municipality <strong>of</strong> Kanjiža, which is also <strong>in</strong> Severno-banatskiCounty, but the <strong>in</strong>crease <strong>in</strong> the number <strong>of</strong> the unemployed was among the lowest) 113.5 <strong>in</strong>Vojvod<strong>in</strong>a. In Zapadno-bački County, the highest <strong>in</strong>crease <strong>of</strong> the unemployed was recor<strong>de</strong>d<strong>in</strong> the municipality <strong>of</strong> Sombor (<strong>in</strong><strong>de</strong>x 132.7), the town <strong>of</strong> heterogeneous ethnic structure.Table 5 The unemployed <strong>in</strong> AP Vojvod<strong>in</strong>a by municipalities, 31 st October 2002Şomerii în Prov<strong>in</strong>cia Autonomă Vojvod<strong>in</strong>a, la 31 <strong>de</strong>cembrie 2002TheTheregion<strong>in</strong><strong>de</strong>x region<strong>in</strong><strong>de</strong>xunemployedunemployedmunicipality2002/2000 municipality2002/20002000 20022000 2002Subotica 15,759 17,673 112.1 Severno-banatski 18,776 24,083 128.3B.Palanka 3,622 4,577 126.4 Zrenjan<strong>in</strong> 15,783 16,945 107.4Mali Iđoš 1,706 1,800 105.5 Sečanj 1,852 2,341 126.4Severno-bački 21,087 24,050 114.1 Žitište 2,292 2,551 111.3Sombor 10,152 13,473 132.7 Novi Bečej 2,894 3,607 124.6Apat<strong>in</strong> 4,064 4,680 115.2 Nova Crnja 2,222 2,518 113.3Odžaci 4,854 5,525 113.8 Srednje-banatski 25,043 27,962 111.7Kula 5,879 7,399 125.9 Pančevo 17,539 19,840 113.1Zapadno-bački 24,949 31,077 124.6 Alibunar 1,857 2,404 129.5Novi Sad 29,948 35,273 117.8 Kovačica 3,520 4,195 119.2B. Petrovac 1,962 1,821 92.8 Kov<strong>in</strong> 3,557 3,750 105.4Beoč<strong>in</strong> 1,784 2,385 133.7 Opovo 1,524 2,032 133.3Žabalj 4,725 5,255 111.2 Vršac 5,850 7,222 123.5Stari Bečej 4,240 4,244 100.1 Bela Crkva 2,620 3,153 120.3Srbobran 2,825 3,046 107.8 Plandište 1,937 1,749 90.3Titel 1,823 2,213 121.4 Južno-banatski 38,404 44,345 115.5Temer<strong>in</strong> 2,598 3,400 130.9 Sr. Mitrovica 9,526 12,254 128.6Bačka Palanka 8,210 9,609 117.0 Irig 1,456 1,849 127.0Bač 2,699 2,577 95.5 Inđija 6,514 8,487 130.3Vrbas 7,400 6,839 92.4 Peć<strong>in</strong>ci 2,109 2,718 128.9Južno-bački 68,214 76,662 112.4 Ruma 5,972 8,664 145.1Kik<strong>in</strong>da 7,881 10,064 127.7 Stara Pazova 5,795 7,787 134.4Ada 2,060 2,571 124.8 Šid 3,589 5,153 143.6Čoka 1,160 2,106 181.6 Sremski okrug 34,961 46,912 134.2Senta 3,299 4,055 122.9Kanjiža 3,077 3,493 113.5 Total 231,434 275,091 118.9N. Kneževac 1,299 1,794 138.1Source: for the year 2000 (on December, 31 st 2000): Municicpalities <strong>in</strong> Serbia <strong>in</strong> 2001,Republic Statistisal and Information Office. Belgra<strong>de</strong>, March 2002, pp. 117, 118; for theyear 2002 (on October, 31 st 2002): Tabular survey <strong>of</strong> employment, methods <strong>of</strong> employmentand unemployment <strong>in</strong> AP Vojvod<strong>in</strong>a, October 2002, Republic Labour Office - Novi Sad,
● Position <strong>of</strong> <strong>m<strong>in</strong>orities</strong> <strong>in</strong> Vojvod<strong>in</strong>a Prov<strong>in</strong>ce34November 2002, table 6The <strong>de</strong>crease <strong>in</strong> the number <strong>of</strong> the unemployed occurred <strong>in</strong> the municipalities <strong>of</strong>ethnic diversity. For <strong>in</strong>stance, the number <strong>of</strong> the unemployed <strong>de</strong>creased <strong>in</strong> the municipality<strong>of</strong> Bački Petrovac, Južno-bački County (<strong>in</strong><strong>de</strong>x 92.4) <strong>in</strong> the period 2000-2002. Slovaksform a majority (66.4%) <strong>in</strong> this municipality. Then, the <strong>de</strong>crease <strong>in</strong> the number <strong>of</strong> theunemployed was also recor<strong>de</strong>d <strong>in</strong> the municipality <strong>of</strong> Bač (<strong>in</strong><strong>de</strong>x 95.5) and Vrbas (<strong>in</strong><strong>de</strong>x92.4), both <strong>of</strong> heterogeneous ethnic structure. F<strong>in</strong>ally, the number <strong>of</strong> the unemployed<strong>de</strong>creased <strong>in</strong> the municipality <strong>of</strong> Plandište Južno-banatski County (<strong>in</strong><strong>de</strong>x 90.3), also <strong>of</strong>heterogeneous ethnic structure (table 5).6. CONCLUSIONNational and l<strong>in</strong>guistic structure <strong>of</strong> the population is one <strong>of</strong> the <strong>in</strong>dicators <strong>of</strong> varieties<strong>in</strong> the world. The differences are traced back to ethnic and historical features <strong>of</strong> thepopulation. As the result <strong>of</strong> major historical events which resulted <strong>in</strong> frequent migrations,Vojvod<strong>in</strong>a is still one <strong>of</strong> ethnically most heterogeneous areas <strong>in</strong> the world. Ethnicheterogeneousness became observable right after the Turks were forced to leave, when theAustrian Empire commenced the large colonisations to economically reactivate the areawhich was almost abandoned. Afterwards, the rulers <strong>of</strong> the Prov<strong>in</strong>ce were constantlychang<strong>in</strong>g but they were persistent <strong>in</strong> populat<strong>in</strong>g the Prov<strong>in</strong>ce with their own people.The data on the status <strong>of</strong> <strong>m<strong>in</strong>orities</strong> <strong>in</strong> the school system and the data on theunemployed accord<strong>in</strong>g to their nationality po<strong>in</strong>t out that there is the cont<strong>in</strong>uity <strong>of</strong> normativebetterment <strong>of</strong> the status <strong>of</strong> <strong>m<strong>in</strong>orities</strong>. Unfortunately, the events <strong>in</strong> the last <strong>de</strong>ca<strong>de</strong> <strong>of</strong> the20 th century <strong>in</strong>itiated the process <strong>of</strong> ethnic homogenization <strong>in</strong> all the countries emerged onthe territory <strong>of</strong> the Former Yugoslavia.In Vojvod<strong>in</strong>a, the people live peacefully together. The beg<strong>in</strong>n<strong>in</strong>g <strong>of</strong> the 1990sannounced the new significant changes <strong>in</strong> the ethnicity <strong>of</strong> the population <strong>in</strong> Vojvod<strong>in</strong>a,which <strong>in</strong>fluenced certa<strong>in</strong> changes <strong>in</strong> the ethnic structure. Although ethnic variety has beenma<strong>in</strong>ly preserved, the number <strong>of</strong> certa<strong>in</strong> nations and their share <strong>in</strong> the total population <strong>in</strong>Vojvod<strong>in</strong>a has changed.REFERENCES AND DATA SOURCESBubalo Živković Milka, Đurđev S. Branislav, Drag<strong>in</strong> Aleksandra,(2008), The age<strong>in</strong>g <strong>of</strong> Vojvod<strong>in</strong>a`s population between 1953 and 2002with reference to middle adulthood and age<strong>in</strong>g <strong>in</strong><strong>de</strong>x. GeographicaPannonica, University <strong>of</strong> Novi Sad, Faculty <strong>of</strong> Natural Science andMathematics, Department <strong>of</strong> Geography, Tourism and HotelManagement, Novi Sad, Vol. 12 (pp. 39 - 44)34
Branislav ĐURĐEV, Andjelija IVKOV-DŽIGURSKI, Aleksandra DRAGIN ● 35Djurdjev S. Branislav, (1994), Peopl<strong>in</strong>g <strong>of</strong> the Vojvod<strong>in</strong>a Prov<strong>in</strong>ce afterthe Second World War. The first regional geography conference:“Geographical Researches <strong>in</strong> the Carpathian-Danube Space”,Universitatea <strong>de</strong> Vest d<strong>in</strong> Timisoara, Facultatea <strong>de</strong> Chimie-Biologie-Geografie, <strong>Departamentul</strong> <strong>de</strong> Geografie (pp. 139 - 148)Djurdjev S. Branislav, (1995), Bor<strong>de</strong>r Effects on Household Dissolution <strong>in</strong>the Banat Region, Yugoslavia. GeoJournal, Vol. 35, No. 4 (pp. 409 -413)Djurdjev S. Branislav, Vesna Katic, Dubravka Zarkov, (1992),Prevalence <strong>of</strong> the Formal Zadruga <strong>in</strong> the Village <strong>of</strong> Vilovo,Voivod<strong>in</strong>a, Serbia. Journal <strong>of</strong> Family History, Vol. 17, No. 3 (pp. 319- 329)Djurdjev S. Branislav, (1986), Razvoj spoljnih migracija u Vojvod<strong>in</strong>i.Zbornik Matice srpske za društvene nauke, Matica srpska, Novi Sad,br. 80 (pp. 109 - 127)Djurdjev S. Branislav, (1988), Demografski preobražaj stanovništva uVojvod<strong>in</strong>i. Zbornik Matice srpske za društvene nauke, Matica srpska,Novi Sad, br. 85 (pp. 67 - 82)Djurdjev S. Branislav, (1996), Problem izbeglištva u Jugoslaviji. ZbornikMatice srpske za društvene nauke, Matica srpska, Novi Sad, br. 100(pp. 305 - 319)Djurdjev S. Branislav, Miroljub Rančić, (1995), Rast stanovništva. U:Mirjana Rašević, urednik: Razvitak stanovništva Srbije, 1950-1991,Centar za <strong>de</strong>mografska istraživanja Instituta društvenih nauka,Beograd (pp. 29 - 44)Ivkov Anđelija, (2005). Stanovništvo kao faktor razvoja turizma uVojvod<strong>in</strong>i. Doktorska disertacija. Univerzitet u Novom sadu.Prirodno-matematički fakultet u Novom Sadu, Departman zageografiju, turizam i hotelijerstvo, Novi Sad (p. 314)Ivkov Anđelija, (2006), Folklorno nasleđe u turizmu Vojvod<strong>in</strong>e. Zadužb<strong>in</strong>aAndrejević, Beograd (p. 127)Ivkov Anđelija, (2006a). Demografska slika Vojvod<strong>in</strong>e. Zadužb<strong>in</strong>aAndrejević, Beograd (p. 99)Ivkov Anđelija, Drag<strong>in</strong> Aleksandra, Kovačević Tamara, (2007),Karakteristike nupcijaliteta rumunskog stanovništva u Banatu naprimeru sela Lokve. Zbornik radova, Geografski <strong>in</strong>stitut Jovan Cvijić,Srpska aka<strong>de</strong>mija nauka i umetnosti, Beograd, Vol. 57 (pp. 175 - 183)
● Position <strong>of</strong> <strong>m<strong>in</strong>orities</strong> <strong>in</strong> Vojvod<strong>in</strong>a Prov<strong>in</strong>ce36Ivkov Anđelija, Kovačević Tamara, Drag<strong>in</strong> Aleksandra, DjurdjevBranislav, Ivanović Ljubica, (2007), Influence <strong>of</strong> tourism on theemployment <strong>in</strong> Vojvod<strong>in</strong>a. Geographica Pannonica. Faculty <strong>of</strong> NaturalScience and Mathematics, Department <strong>of</strong> Geography, Tourism andHotel Management, Novi Sad, No. 11 (pp. 54 - 58)Ivkov Anđelija, Romelić Jovan, Lazić Lazar, Drag<strong>in</strong> Aleksandra,Ivanović Ljubica, (2007), Folklorno nasleđe u turizmu Banata. Prirodnomatematičkifakultet - Departman za geografiju, turizam i hotelijerstvo(Novi Sad) i Pokraj<strong>in</strong>sko Izvršno veće - O<strong>de</strong>ljenja za kulturu (Novi Sad) (p.234)Republički zavod za statistiku, (2003), Popis stanovništva, domać<strong>in</strong>stava istanova u 2002 - Veroispovest, maternji jezik i nacionalna ili etničkapripadnost prema starosti i polu. Republički zavod za statistiku,Beograd, Vol. 3, (p. 408)Republički zavod za statistiku, (2003), Popis stanovništva, domać<strong>in</strong>stava istanova u 2002 - Nacionalna ili etnička pripadnost, podaci ponaseljima. Republički zavod za statistiku, Beograd, Vol. 1, (p. 219)Savezni zavod za statistiku, (1993), Popis stanovništva 1991. god<strong>in</strong>e - poli starost prema etničkoj pripadnosti, Savezni zavod za statistiku,Beograd, Vol. 536
![in Romanian [pdf]](https://img.yumpu.com/51065862/1/184x260/in-romanian-pdf.jpg?quality=85)