alinorm 10/33/41 - CODEX Alimentarius
alinorm 10/33/41 - CODEX Alimentarius
alinorm 10/33/41 - CODEX Alimentarius
You also want an ePaper? Increase the reach of your titles
YUMPU automatically turns print PDFs into web optimized ePapers that Google loves.
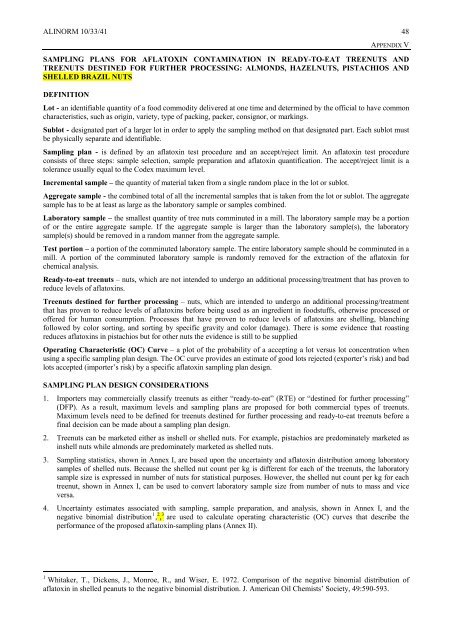
ALINORM <strong>10</strong>/<strong>33</strong>/<strong>41</strong>48APPENDIX VSAMPLING PLANS FOR AFLATOXIN CONTAMINATION IN READY-TO-EAT TREENUTS ANDTREENUTS DESTINED FOR FURTHER PROCESSING: ALMONDS, HAZELNUTS, PISTACHIOS ANDSHELLED BRAZIL NUTSDEFINITIONLot - an identifiable quantity of a food commodity delivered at one time and determined by the official to have commoncharacteristics, such as origin, variety, type of packing, packer, consignor, or markings.Sublot - designated part of a larger lot in order to apply the sampling method on that designated part. Each sublot mustbe physically separate and identifiable.Sampling plan - is defined by an aflatoxin test procedure and an accept/reject limit. An aflatoxin test procedureconsists of three steps: sample selection, sample preparation and aflatoxin quantification. The accept/reject limit is atolerance usually equal to the Codex maximum level.Incremental sample – the quantity of material taken from a single random place in the lot or sublot.Aggregate sample - the combined total of all the incremental samples that is taken from the lot or sublot. The aggregatesample has to be at least as large as the laboratory sample or samples combined.Laboratory sample – the smallest quantity of tree nuts comminuted in a mill. The laboratory sample may be a portionof or the entire aggregate sample. If the aggregate sample is larger than the laboratory sample(s), the laboratorysample(s) should be removed in a random manner from the aggregate sample.Test portion – a portion of the comminuted laboratory sample. The entire laboratory sample should be comminuted in amill. A portion of the comminuted laboratory sample is randomly removed for the extraction of the aflatoxin forchemical analysis.Ready-to-eat treenuts – nuts, which are not intended to undergo an additional processing/treatment that has proven toreduce levels of aflatoxins.Treenuts destined for further processing – nuts, which are intended to undergo an additional processing/treatmentthat has proven to reduce levels of aflatoxins before being used as an ingredient in foodstuffs, otherwise processed oroffered for human consumption. Processes that have proven to reduce levels of aflatoxins are shelling, blanchingfollowed by color sorting, and sorting by specific gravity and color (damage). There is some evidence that roastingreduces aflatoxins in pistachios but for other nuts the evidence is still to be suppliedOperating Characteristic (OC) Curve – a plot of the probability of a accepting a lot versus lot concentration whenusing a specific sampling plan design. The OC curve provides an estimate of good lots rejected (exporter’s risk) and badlots accepted (importer’s risk) by a specific aflatoxin sampling plan design.SAMPLING PLAN DESIGN CONSIDERATIONS1. Importers may commercially classify treenuts as either “ready-to-eat” (RTE) or “destined for further processing”(DFP). As a result, maximum levels and sampling plans are proposed for both commercial types of treenuts.Maximum levels need to be defined for treenuts destined for further processing and ready-to-eat treenuts before afinal decision can be made about a sampling plan design.2. Treenuts can be marketed either as inshell or shelled nuts. For example, pistachios are predominately marketed asinshell nuts while almonds are predominately marketed as shelled nuts.3. Sampling statistics, shown in Annex I, are based upon the uncertainty and aflatoxin distribution among laboratorysamples of shelled nuts. Because the shelled nut count per kg is different for each of the treenuts, the laboratorysample size is expressed in number of nuts for statistical purposes. However, the shelled nut count per kg for eachtreenut, shown in Annex I, can be used to convert laboratory sample size from number of nuts to mass and viceversa.4. Uncertainty estimates associated with sampling, sample preparation, and analysis, shown in Annex I, and thenegative binomial distribution 1 , 2 , 3 are used to calculate operating characteristic (OC) curves that describe theperformance of the proposed aflatoxin-sampling plans (Annex II).1 Whitaker, T., Dickens, J., Monroe, R., and Wiser, E. 1972. Comparison of the negative binomial distribution ofaflatoxin in shelled peanuts to the negative binomial distribution. J. American Oil Chemists’ Society, 49:590-593.


