132 CALIF0RhTTIA COOPERATIVE OCEANIC FISHERIES INVESTIGATIONSThe problem then is to account for the highernumber of each species in hauls in which they cooccurred-todetermine whether they mere obtainedin centers of heavier spawning for both species orwhether survival was better in areas of co-occurrence.If the latter were true, it would be difficult to justifyany hypothesis that postulates that competition betweenthe two species would adversely affect theirsurvival.The average numbers of larvae per positive haulare summarized by size and year in Tables 10 to 15.For each species these data are summarized in threeways : (1) for all occurrences, (2) for hauls in whichthe larvae of one species eo-occurred with those ofthe other, and (3) for hauls in which the larvae ofa species occurred alone.A semi-log plot (Figures <strong>11</strong> and 12) gives a simplemethod of illustrating changes in abundance withSARDINE LARVAE-OCCURRINGSize class (mm) 1I1951TABLE 12ALONE (NO ANCHOVY LARVAE): AVERAGE NUMBER PER POSITIVE HAUL (X lo'), SUMMARIZEDBY SIZE AND YEAR, 195140-3.3----Year1952 1953 1954 1955 I 1956 1957 1958I810 2,604 1,922 1,276 1,217 1.257 1,826 222357 2,619 2,237 1,562 1,236 2,306 1,552 505249 1,307 859 746 820 696 712 510166 503 266 346 436 201 448 465129 298 158 267 340 1 198 699 32672 212 183 199 154 198 407 22683 149 101 144 132 158 318 17148 78 192 73 78 146 286 6851 71 72 42 74 61 204 6831 48 120 33 69 54 173 2747341319.619.63.38.2--02,140.744742143.943.613.020.2_-1438,291.761564346.610.7--__--06,327.34234106.26.04.5-___04,790.758592936.49.599473889.884.862.98.7__0 15______4,751.2 5,720.250181439.238.9-_-___66,791.<strong>11</strong>393448.<strong>11</strong>2.2---__-02,704.31959 <strong>11</strong>960;li I 1,352.7i! 1 256.0Unweightedaverage~ ~ _ _ _<strong>11</strong>,580 1,059 1,377.3952228 626.9140 303.762578257389142262827.014.014.0--2529-_364428173.3136.7102.671.769.048.435.7_- 35.7:: 1 23.0:: 1 3.7__ I 23.910.1_- 0.0TABLE 13ANCHOVY LARVAE-ALL OCCURRENCES: AVERAGE NUMBER PER POSITIVE HAUL (x lo2), SUMMARIZED BY SIZE AND YEAR, 1951-60Size class (mm) I1951Year1952 1953 1954 1955 1956 1957195819591960Unweightedaverage2,2661,7681,3801,5401,4712,3562,9742,6<strong>11</strong>1.8521,5924,3963,2212,6252,5642,6373,1984,7242,7893,0092,5542,6<strong>11</strong>3,9642,8852,7323,1203,4474.0763.4323,1562,9564,1815,4763,4933,3172,8374,7915,1042,6882,4122,1737,2665.5364,2403,6242,9083,538.33,771.42,722.42,537.02,335.51,26784656137024<strong>11</strong>,18289 16764242681,9251,4189135813762,0521.5731,<strong>11</strong>27123882,8182,3061,8571,2737512,5152,0551,4518885582,2431,6801,1357644941.8091,3491,0317024072,0061,34092857839 <strong>11</strong>,854.01,391.1996.7647.9401.813574644362.912988513035.2239132844940.2237136854966.84021941005157.83121621015467.53<strong>11</strong>1771096567.027718<strong>11</strong>209291.3243154<strong>11</strong>56381.3236.<strong>11</strong>34.185.751.558.428.420.913.72312.57.8<strong>11</strong>.62123.54.44.23623.47.08.62740.52.87.4416.8<strong>11</strong>.36.81329.18.93.<strong>11</strong>037.89.93.08836.89.5<strong>11</strong>.437825.38.58.270.612,174.9 15,212.1 21,268.3 22,750.8 25,176.525,278.426,400.123,366.029,909.020,874.5--
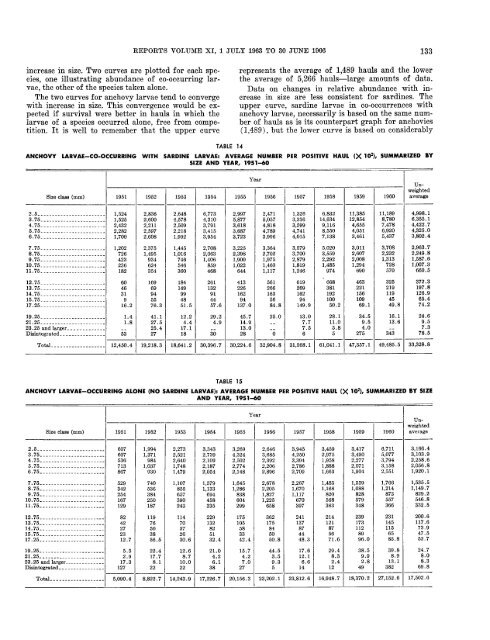
~~~~REPORTS VOLUME XI, 1 JULY 1963 TO 30 JUNE 1966 133increase in size. Two curves are plotted for each species,one illustrating abundance of eo-occurring larvae,the other of the species taken alone.The two curves for anchovy larvae tend to convergewith increase in size. This convergence would be expectedif survival were better in hauls in which thelarvae of a species occurred alone, free from competition.It is well to remember that the upper curverepresents the average of 1,489 hauls and the lowerthe average of 5,266 hauls-large amounts of data.Data on changes in relative abundance with increasein size are less consistent for sardines. Theupper curve, sardine larvae in eo-occurrences withanchovy larvae, necessarily is based on the same numberof hauls as is its counterpart graph for anchovies(1,489), but the lower curve is based on considerablyANCHOVY LARVAE-CO-OCCURRINGTABLE 14WITH SARDINE LARVAE: AVERAGE NUMBER PER POSITIVE HAUL (x 10% SUMMARIZED BySIZE AND YEAR, 1951-6019521953 1954______1955Year1956 1957 1958 I 1959 1960--Unweightedaverage2,8362,6002,2<strong>11</strong>2,5972,6082,6484,5782,5092,2181,9926,7734,3103,7913,4153,9542,9975,8773,6183,6873,7232,4715,0574,8184,7893,9961,3263,3363,5994,7414,0156,83214,6349,<strong>11</strong>68,5507,138<strong>11</strong>,38512,8544,6554,0513,46<strong>11</strong>1,1898,7807,4786,9205,4374,998.16,355.14,422.74,325.03,802.42,3751,4959346243541,4451,0167465463602,7082,0631,4068594683,2252,3981,9001,0226443,3642,7021,9751,4601,<strong>11</strong>73,5793,7002,8791,8191,2465.020 3.0<strong>11</strong>3;559 2,6072,292 2,0081.485 1.294974 6903,7082,2321,3137285702,963.72,249.81,587.61,007.3660.516969945576.3184149994851.526<strong>11</strong>32914457.641322616294137.05612661635684.861926916294149.966838<strong>11</strong>9210050.246322<strong>11</strong>5610969.1325219<strong>11</strong>94549.8372.3197.8126.965.474.241.127.525.42712.24.417.<strong>11</strong>829.24.9_-3045.714.913.02825.0_-__013.07.77.5628.<strong>11</strong>1.05.8534.59.54.027516.<strong>11</strong>3.6__34324.69.57.378.519,218.318,641.230,396.730,224.632,904.831,568.161,041.147,357.149,485.533,328.8TABLE 15ANCHOVY LARVAE-OCCURRING ALONE (NO SARDINE LARVAE): AVERAGE NUMBER PER POSITIVE HAUL (X ld), SUMMARIZED BY SIZEAND YEAR, 1951-60I-Size class (mm) I 1951I-3,269 2,6464,324 3,6852.502 2.3922;7742,1482;2062,8961,6451,286838604299IYear___I Un-1952 1953 1954 1955 I 1956 1957 1958 19591,9941,3719841,037930740536384250187<strong>11</strong>976503856.522.417.78.1222,2732,5212,6401,7481,4791,107855657390243<strong>11</strong>470372630.612.68.710.0223,3432,7392,1092,1872,0541,5791,133694458335229132825132.421.04.26.138175105583342.415.74.27.0272,6782,2051,8271,225658362175845050.844.53.59.353,9454,2503,3942,7862,7092,2671,6701,<strong>11</strong>767039724<strong>11</strong>37874448.317.612.16.6143,4592,9751,9581,8881,6631,4851,168820568363214121875671.629.48.32.4123,4173,4902,2772,07<strong>11</strong>,9041,5591,088828579348239173<strong>11</strong>28996.038.59.92.8498,822.7 14,243.9 17,226.7 20,156.3 I 23,202.1 23,812.6 16,948.7 18,370.2weighted1960 average--6,7<strong>11</strong>5,0773,7943,1582,55<strong>11</strong>,7661,21487355736623<strong>11</strong>45<strong>11</strong>56585.83,166.43,103.92,258.62,056.81,920.<strong>11</strong>,535.51,149.7829.2546.8332.5200.6<strong>11</strong>7.673.947.552.724.713.1 8.3
- Page 1 and 2:
STATE OF CALIFORNIAMARINE RESEARCH
- Page 3 and 4:
STATE OF CALIFORNIADEPARTMENT OF FI
- Page 5 and 6:
RONALD REAGAXGovcriwr of the Slate
- Page 7 and 8:
PART 1REVIEW OF ACTIVITIESJuly 1,19
- Page 9 and 10:
REPORTS YOLUAIE SI, 1 JULY 1963 TO
- Page 11 and 12:
REPORTS VOLUNE XI, 1 JULY 1963 TO 3
- Page 13 and 14:
REPORTS YOLUME SI, 1 JULY 1963 TO 3
- Page 15 and 16:
REPORTS VOLUME XI, 1 JULY 1963 TO 3
- Page 17 and 18:
REPORTS vor,uiwIi; SI, 1 JULY 1063
- Page 19 and 20:
REPORTS TOT2T71\IF: SI, 1 JUJIT 196
- Page 21 and 22:
IiEPOHTS TOLUME XI, 1 JULY 1963 TO
- Page 23 and 24:
REVIEW OF THE PELAGIC WET FISHERIES
- Page 25 and 26:
KEI'OiiTH TOLUJIE SI, 1 JULY 1963 T
- Page 27 and 28:
REPORTS VOLUME XI, 1 JULY 1963 TO 3
- Page 29 and 30:
PART IISYMPOSIUM ON ANCHOVIES, GENU
- Page 31 and 32:
OCEANIC ENVIRONMENTS OF THE GENUS E
- Page 33 and 34:
KEI'OKTS VOLIXI.: SI, 1 JULY 1963 T
- Page 35 and 36:
REPORTS VOLUME XI, 1 JULY 1963 TO 3
- Page 37 and 38:
REPORTS VOLUME XI, 1 JULY 1963 TO 3
- Page 39 and 40:
REPORTS VOLUME XI, 1 JULY 1963 TO 3
- Page 41 and 42:
~~~REPORTS VOLUME XI, 1 JULY 1963 T
- Page 43 and 44:
REPORTS VOLUME XI, 1 JULY 1963 TO 3
- Page 45 and 46:
REPORTS VOLUME SI, 1 JULY 1963 TO 3
- Page 47 and 48:
130'E 132' 134' 136' 138' 140' 142-
- Page 49 and 50:
REPORTS VOLUSIE SI, 1 JULY 1963 TO
- Page 51 and 52:
REPORTS VOLUME XI, 1 JULY 1963 TO 3
- Page 53 and 54:
REPORTS VOLUME XI, 1 JULY 1963 TO 3
- Page 55 and 56:
REPORTS VOLUME XI, 1 JULY 1963 TO 3
- Page 57 and 58:
KI3I’ORTH VOLUJIE XI, 1 JULY 1963
- Page 59 and 60:
REPORTS VOLUME XI, 1 JULY 1963 TO 3
- Page 61 and 62:
REPORTS VOLUME SI, 1 JULY 1963 TO 3
- Page 63 and 64:
REPORTS VOLUME XI, 1 JULY 1963 TO 3
- Page 65 and 66:
REPORTS VOLUIIE SI. 1 JULY 1963 TO
- Page 67 and 68:
REPORTS T’OLUME XI, 1 JULY 1963 T
- Page 69 and 70:
INFLUENCE OF SOME ENVIRONMENTAL FAC
- Page 71 and 72:
REPORTS Y‘OLUJIE XI, 1 JULY 1963
- Page 73 and 74:
REPORTS VOLUME XI, 1 JULY 1963 TO 3
- Page 75 and 76:
~table shows the values calculated
- Page 77 and 78:
ateREPORTS T-OLTJIT", SI, 1 JULl 19
- Page 79 and 80:
REPORTS POLGNE SI, 1 JU LY 1963 TO
- Page 81 and 82:
REPORTS VOLUXE XI, 1 JULY 1963 TO 3
- Page 83 and 84: REPORTS VOLUME XI, 1 JULY 1963 TO 3
- Page 85 and 86: _________--_____REPORTS VOLUJIE SI,
- Page 87 and 88: REPORTS TOLTIJIE SI, 1 JULY 1963 TO
- Page 89 and 90: -20/5-0 10-f 5-w 25-0 20-= 15-: 10-
- Page 91 and 92: REPORTS VOLUNE SI. 1 JULY 19G3 TO 3
- Page 93 and 94: REPORTS VOLUME XI, 1 JULY 1963 TO 3
- Page 95 and 96: REPORTS VOLUME XI, 1 JULY 1963 TO 3
- Page 97 and 98: REPORTS VOLURlE SI, 1 JULY 1963 TO
- Page 99 and 100: REPORTS VOLUME XI, 1 JULY 1963 TO 3
- Page 101 and 102: REPORTS VOLUME XI, 1 JULY 1963 TO 3
- Page 103 and 104: REPORTS VOLUME XI, 1 JULY 1963 TO 3
- Page 105 and 106: REPORTS VOLUME XI, 1 JULY 1963 TO 3
- Page 107 and 108: THE PREDATION OF GUANO BIRDS ON THE
- Page 109 and 110: iod and after 8 AM during the rest
- Page 111 and 112: REPORTS VOLUME XI, 1 JULY 1963 TO 3
- Page 113 and 114: REPORTS VOLUME XI, 1 JULY 1963 TO 3
- Page 115 and 116: FISH E RYThe California anchovy fis
- Page 117 and 118: ~~ ::REPORTS VOLUME XI, 1 JULY 1963
- Page 119: CO-OCCURRENCES OF SARDINE AND ANCHO
- Page 122 and 123: 120 CALIFORNIA COOPERATIVE OCEANIC
- Page 124 and 125: CALIFORNIA COOPERATIVE OCEANlC FISH
- Page 126 and 127: 124 CALIFORNIA COOPERATIVE OCEANIC
- Page 128 and 129: 126CALIFORNIB COOPERATIVE OCEANIC F
- Page 130 and 131: 128 CALIFORNIA COOPERATIVE OCEANIC
- Page 132 and 133: ~~ ~130 CALIFORNIA COOPERATIVE OCEA
- Page 136 and 137: 134 CALIFORNIA COOPERATIVE OCEANIC
- Page 138 and 139: THE ACCUMULATION OF FISH DEBRIS IN
- Page 140 and 141: 138 CALIFORNIA COOPERATIVE OCEANIC
- Page 143 and 144: PART IllSCIENTIFIC CONTRIBUTIONS
- Page 145 and 146: REPORTS VOLUME XI, 1 JULY 1963 TO 3
- Page 147 and 148: REPORTS VOLUME SI, 1 JULY 1963 TO 3
- Page 149 and 150: REPORTS VOLUME XI, 1 JULY 1963 TO 3
- Page 151 and 152: REPORTS VOLU&IE XI, 1 JULY 1963 TO
- Page 153 and 154: REPORTS VOLUME XI, 1 JULY 1963 TO 3
- Page 155 and 156: REPORTS VOLUME SI, 1 JULY 1963 TO 3
- Page 157 and 158: SUMMARY OF THERMAL CONDITIONS AND P
- Page 159 and 160: SEASONAL VARIATION OF TEMPERATURE A
- Page 161 and 162: REPORTS VOLUME SI, 1 JULY 1963 TO 3
- Page 163 and 164: including the semiannual harmonic?
- Page 165 and 166: REPORTS VOLUME XI, 1 JULY 1983 TO 3
- Page 167 and 168: REPORTS VOiLUME XI, 1 JULY 1983 TO
- Page 169: REPORTS VOLUME XI, 1 JULY 1963 TO 3
- Page 172 and 173: 170 CALIFORNIA COOPERATIVE OCWIC FI
- Page 174 and 175: 172 CALIFORNIA COOPERATIVE OCBANIC
- Page 176 and 177: 174 CALIFORNIA COOPERATIVE OCEANIC
- Page 178 and 179: 176 CALIFORNIA COOPERATIVE OCEANIC
- Page 180 and 181: 178 CALIFORNIA COOPERATIVE OCEANIC
- Page 182 and 183: 180 CALIFORNIA COOPERATIVE OCEANIC
- Page 184 and 185:
182 CALIFORNIA COOPERATIVE OCEANIC
- Page 186 and 187:
184CALIFORNIA COOPERATIVE OCEANIC F
- Page 188 and 189:
186 CALIFORNIA COOPERATIVE OCEANIC
- Page 190:
CONTENTSI. Review of Activities Pag