't'{, l( - Impact monitoring of Forest Management in Cameroon
't'{, l( - Impact monitoring of Forest Management in Cameroon
't'{, l( - Impact monitoring of Forest Management in Cameroon

You also want an ePaper? Increase the reach of your titles
YUMPU automatically turns print PDFs into web optimized ePapers that Google loves.
M<strong>in</strong>istère de I'Environnement et des Forêts, UTO Campo-Ma'anEsitimat<strong>in</strong>g elephant density and distribution <strong>in</strong> the OperationalTechnical Unit CamPo-Ma'anA manualCAMPO-MA'AN DOCUMENT NO 16Projet d'Aménagement et de conservation de la Biodiversitéde CamPo-Ma'an, CamerounF{'r} ifl'j g;@WUR#hlmmNIISWÛ'I{\!'17,'zKribi/ I2001<strong>'t'</strong>{, l( )
CAMPO.MA'A}{ DOCUMENT NO 16Estimat<strong>in</strong>g elephant density and distributionUnit Campo-Ma'an<strong>in</strong> the Operational TechnicalA manualPatricia D.B.M. BekhuisU'agen i nge n LIn wersi t.v, trtr'age n m ge nCc rapport est le résultat d'une étude exécutée dans le cadre du Programme GEF-Biodirersité Cameroun. Projetd'Aménagement et de Conservation de la Biodiversité Campo-Ma'an. un projet du MINEF.F<strong>in</strong>ancement :Maître d'æurre de cette étude :Exécution de l'étude :GEFÆlanque Mondiale (Don FEM n" TF28673CM)Gouvernement néerlandais (Don DGIS no. TF20957 NETH)Gouvernemenl camerounaisOrganisation Néerlandaise de Développement (SNV)Tropenbos International (TBI)Université de Wagen<strong>in</strong>genMINEFM<strong>in</strong>istère de I'Environnement et des ForêtsiRùTlsc5 |\iRArnN{Tropenbos InternationalWURWagen<strong>in</strong>gen Universitl- and Research CentreProjet d'Aménagement et de Consen'ation de la Biodirersité de Campo-Ma'anBekhuis. P.D.B.M. 2002. Estmat<strong>in</strong>g elephant densiq'and distribution <strong>in</strong> the Operatonal Technical Unit Campo-Ma'an: a manual. Campo-Ma'an Document No. 16. Tropenbos International / Projet Campo-Ma'an / WUR.Projet Campo-Ma'anB.P. 219- Kribi. CamerounKribiAilagen<strong>in</strong>gen, 2002
Estimqt<strong>in</strong>g Elephqnt Density ond Distribution<strong>in</strong> the UTO Compo-Mq'on,A MclnuqlPaticia D.B.M. BekhuisLatge Mammal Program <strong>in</strong> the UTO Campo-Ma'anBiodiversity Conservation and <strong>Management</strong> Pro iect Campo-Ma'anKribl 2002
Proiect Campo-Ma'an Larqe Mammal Proqram Patricia BekhuisAcknowledgnentsThe Campo-Ma'an Project, specifically f<strong>in</strong>anced by the World Bank and TropenbosInternational, supported this work. Special thanks to MINEF for lett<strong>in</strong>g this happen. To thedepartment <strong>of</strong> nature conservation and ecology <strong>of</strong> vertebrates <strong>of</strong> the University <strong>of</strong>Wagen<strong>in</strong>gen <strong>in</strong> particular Pr<strong>of</strong>l Dr. H.H.T Pr<strong>in</strong>s for his support with respect to content andmoral. Much <strong>of</strong> gratitude also goes out to the two fieldwork assistants Medjo Imocent andMenye Menye Just<strong>in</strong> Elie for their perseverance <strong>in</strong> the field and for shar<strong>in</strong>g their fieldknowledge. Big thanks for all others that supported the bush: the cooks, Obam "Dr. Ganago"Elisé, Medjo Medjo Casimir, Essola Blond<strong>in</strong>e and Ondo Daniel and the drivers, AmougouThomas, Aba'a Aba'a Louis, Mbonda Hubert and Asso'o Jean. Appreciation goes out toChristiaan v.d.Hoeven for his useful comments, the GlS-section and last but not least to thePr<strong>in</strong>cipal Technical Advisor <strong>of</strong> the Project, Mr. T<strong>in</strong>us de Kam.8.P.219 Kribi <strong>Cameroon</strong> TellFax +237 346 21 37
Proiect Campo-Ma'an Laroe Mammal Prooram Patricia BekhuisContentsAcknowledgement2lntroduction4MethodBackground for method choiceFieldworkDung counts on striP transectsh-rput <strong>of</strong> fieldwork data <strong>in</strong> cotnputerData analysesCalculat<strong>in</strong>g elephant densitYStatistics557991010t2Report<strong>in</strong>g the resultsInterpretation <strong>of</strong> resultsFormatt<strong>in</strong>g the reportL61616Protocol18References cited <strong>in</strong> manualI98.P.219 Kribi <strong>Cameroon</strong> TellFax +237 346 21 37
IntroductionIIIIIIThe purpose <strong>of</strong> the manual is to help people who lvill cont<strong>in</strong>ue the work on elephant densityand distribution <strong>in</strong> the uro- It has been written as comprehensively as possible; however,some basic knowledge <strong>of</strong> biology and statistics is presumed to fully understand it. The manualwill expla<strong>in</strong> the whole course. In chapter one the method is expla<strong>in</strong>ed, start<strong>in</strong>g with thefieldwork until the statistical analyses <strong>of</strong> the data. chapter two will he$ to <strong>in</strong>terpret the resultsand chapter three expla<strong>in</strong>s how to convert results and <strong>in</strong>terpretations <strong>in</strong>to a clear report. For aquick overview <strong>of</strong> the whole procedure read the last chapter called protocol. This chaptersummarized the work about how to get to <strong>in</strong>terpreted biological results useful for managersand other <strong>in</strong>terested parties. This manual is closely l<strong>in</strong>ked to the report on elephant densityand distribution <strong>in</strong> the southern part <strong>of</strong> National Park Campo-Ma,an (Bekhu is,2002).8.P.219 Kribi <strong>Cameroon</strong> Tel/Fax +232 346 21 37
IIIMethodBackground for method choiceKnowledge concern<strong>in</strong>g the size and density <strong>of</strong> a population is a vital prerequisite to manag<strong>in</strong>git effectively. If answers concern<strong>in</strong>g abundance could simply be obta<strong>in</strong>ed by count<strong>in</strong>g theanimals, the method would be simple. Unfortunately, count<strong>in</strong>g animals <strong>in</strong> a large forested andmounta<strong>in</strong>ous environment, Iike the Campo-Ma'an area is impossible. If direct methods i.e.count<strong>in</strong>g animals don't work, <strong>in</strong>direct observations can be the solution. One can ask a number<strong>of</strong> local hunters about the number <strong>of</strong> animals they th<strong>in</strong>k are present. This method is called thepooled-expert-op<strong>in</strong>ion-method and described by Van der Hoeven (2002). Or, as described <strong>in</strong>this report, one can do fieldwork with <strong>in</strong>direct observations; <strong>in</strong> generally this implies count<strong>in</strong>gdung. Count<strong>in</strong>g all dung <strong>in</strong> the UTO will be <strong>in</strong>accurate, expensive and will consume too muchtime. The alternative is sampled counts and extrapolation.Extranolation: add<strong>in</strong>g new values outside the extremes us<strong>in</strong>g knorvn valuesSurface <strong>of</strong> sample (on2)Surface <strong>of</strong> Park (km2)Five common used methods for sample counts are:1) mark-recapture 2) po<strong>in</strong>t sample 3) plot sample 4) strip transect and 5) l<strong>in</strong>e transect.l) With the mark-recapture method, a sample <strong>of</strong> the animal population is trapped, marked andreleased. After a while, a subsequent sample is taken to estimate the ratio <strong>of</strong> marked tounmarked animals <strong>in</strong> the population. With this data the size <strong>of</strong> the population can be estimatedbut it doesn't give reliable <strong>in</strong>formation on the distribution and/or dispersion <strong>of</strong> the population.B.P.219 Kribi <strong>Cameroon</strong> Tel/Fax +237 346 21 3Z
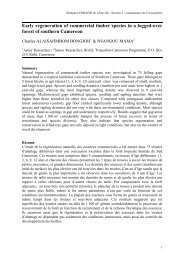
IIIIIRecaptur<strong>in</strong>g large ntammals, like elephants, is difficult and sometimes dangerous and mostprobably would give a sample that is too small for accurate results. This makes the methodtotally unsuitable to identifr elephant populations <strong>in</strong> the campo-Ma,an area.2) Po<strong>in</strong>t samples have been used near saltlicks or waterholes. The assumption is that allanimals <strong>of</strong> a target species will visit that place. The observer stays <strong>in</strong> one place and recordsevery animal visit<strong>in</strong>g the po<strong>in</strong>t. Estimates can be obta<strong>in</strong>ed with this method but double countsmight occur. Further more, like <strong>in</strong> the mark-recapture method, the method does not give<strong>in</strong>formation on the distribution and dispersion <strong>of</strong> the animals.In Central African Republic, research on elephants by direct observation at an open spot <strong>in</strong> theforest was executed. The researcher observed the elephants for 8 years from a tree hut andknew all <strong>in</strong>dividuals differently. That way double counts were avoided. In the UTo CampoMa'an the two ma<strong>in</strong> assumptions <strong>of</strong> this method can not be met, l) no particular place wasdiscovered where all elephants nreet (no saltlicks nor savannas rvith good quality food) 2)noth<strong>in</strong>g is klown about the area surface <strong>in</strong> which these elephants go round.3) Sampl<strong>in</strong>g a plot, count<strong>in</strong>g all dung with<strong>in</strong> a quadrate, has the advantage <strong>of</strong> simple estimatesdue to a constant size <strong>of</strong> the sampl<strong>in</strong>g unit. However here is the assumption that the animalsare evenly dispersed over the whole area. If this is not the case, a quadrant is likely to land <strong>in</strong>a patch <strong>of</strong> high density or a patch <strong>of</strong> low dersity. Due to different environments with<strong>in</strong> theUTO and the animals' behaviour, their distribution and thus dung distribution is probablyclumped. Therefore, plot sampl<strong>in</strong>g is likely not to be accurate at all.q e' , A sufficient long transect is more likely to cut through areas <strong>of</strong> high and low density<strong>of</strong> dung, mak<strong>in</strong>g estimates much more accurate than do quadrants.Two types <strong>of</strong> transect can be dist<strong>in</strong>guished;- 'bounded' transects also called strip transects (4)- 'unbounded' transects also called l<strong>in</strong>e transects (5)Bounded transects are transects where data is gathered with<strong>in</strong> a fixed range at both sides. Allobservations made beyond that distance are not taken <strong>in</strong>to account. Bounded transects havethe same advantage as quadrants i.e. a constant sampl<strong>in</strong>g unit size. The strip transect doesassume that all dung with<strong>in</strong> the given strip is counted; therefore the transect width should beadapted' Where as the l<strong>in</strong>e transect does assume that transects are walked with constant speed8.P.219 Kribi <strong>Cameroon</strong> Tel/Fax +237 346 21 37
IIIIIlProiect Campo-Ma'an Larqe Mammal Prooram Patricia Bekhuisand attention. Non-tra<strong>in</strong>ed locale personnel should therefore not execute the latter as theygenerally fail to be attentive for several hours.If observations are rare and every track seen needs to be <strong>in</strong>cluded <strong>in</strong> the data set <strong>in</strong> order tohave a sufficiently large sample one may use l<strong>in</strong>e transects. With l<strong>in</strong>e transects only the dungseen from the census l<strong>in</strong>e is counted and the boundary is estimated after fieldwork. Eventhough no method is perfect the l<strong>in</strong>e transect method will give most accurate estimates forcount<strong>in</strong>g rare mammals <strong>in</strong> a varyng forested area. However, if abundant throughout, likeelephant dung <strong>in</strong> our case, the strip transect method is easier and a good choice.LliStrip and l<strong>in</strong>e transect visualized,Bounded (strip) transectseen from above.Un-bounded (l<strong>in</strong>e) transectCensus l<strong>in</strong>eStrip widthFieldworkTo result <strong>in</strong>to accurate estimates, transects should represent the census area and thereforepreferably cross different habitats and different levels <strong>of</strong> hunt<strong>in</strong>g pressure. Systematicsampl<strong>in</strong>g <strong>in</strong>stead <strong>of</strong> strict randomly is therefore a better option. To make sure transects cutthrough different habitats, they should preferably be perpendicular to rivers or other largeremarkable features like hills, roads etc. However, if possible the already exist<strong>in</strong>g transectsshould be used <strong>in</strong>stead <strong>of</strong> cutt<strong>in</strong>g new transects. These are and were used by other researchers,mak<strong>in</strong>g it possible to compare data over time and between different subjects (vegetation, soil,animals etc.). The location <strong>of</strong> the exist<strong>in</strong>g transects has been visualised on a map (see ReportBekhuis 2002).8.P.219 Kribi <strong>Cameroon</strong> Tel/Fax +237 346 21 37
If new transects need to be cut make sure that transects do not become paths, s<strong>in</strong>ce this willIgive biased results. Elephants might be attracted to the transects and transects can no longerrepresent their surround<strong>in</strong>g. When <strong>in</strong> the field, transects should only be visible ôr the tra<strong>in</strong>edhuman eye and certa<strong>in</strong>ly not for the elephant.IThe number <strong>of</strong> transects you have to monitor depends on how heterogeneous the environmentIis from the po<strong>in</strong>t <strong>of</strong> view (<strong>in</strong> our case) the elephant. If the environment would be absolutelyhomogeneous theoretically one transect will do to extrapolate the results. In practice theIenvironment is never homogeneous but at the same time the capital you can spend for yourfieldwork has a limit. The rule for the number <strong>of</strong> transects you monitor is the more the betterwith<strong>in</strong> the means you have- If you want your data to be accurate make sure you cover alldifferent areas and if you want your data to be precise make sure you monitor as many aspossible.Transect lengths can vary a lot. Which transect length to take, aga<strong>in</strong> depends ma<strong>in</strong>ly onpractical reasons. If money and time are limited just a few long transects can be monitoredonce to get results, par example I time 5 transects <strong>of</strong> 20 km as done by Blom et at (npress).However much more precision and accuracy will be get by repeatedly <strong>monitor<strong>in</strong>g</strong> <strong>of</strong> severaltransects. This way the decay time <strong>of</strong> dung can for the most part be avoided (see further;calculat<strong>in</strong>g elephant densilies). A feasible transect lengtll used <strong>in</strong> former years, is 5 km. Thislength can normally be surveyed <strong>in</strong> one day.The width <strong>of</strong> the strip transects depends on the density <strong>of</strong> the forest. If undergrowth is sparsethe width might be 5 meter both side <strong>of</strong> the census l<strong>in</strong>e. But if vision is taken away,the stripwidth should become nanower. Always decide upon before start<strong>in</strong>g <strong>monitor<strong>in</strong>g</strong>, do not adapttransect width while walk<strong>in</strong>g strip transects.As said before, repetition <strong>of</strong> <strong>monitor<strong>in</strong>g</strong> results <strong>in</strong> more accurate and precise results. Repeated<strong>monitor<strong>in</strong>g</strong>, upgrades your sample size, which <strong>in</strong> turn will lead to small confidence limits <strong>of</strong>your density. Every two weeks is sufficient for a good precision <strong>of</strong> elephant densitiesestimates. If year round <strong>monitor<strong>in</strong>g</strong> is not possible then monitor from September till April,thus <strong>in</strong>clud<strong>in</strong>g the core ra<strong>in</strong>y season (September, October) and the major dry season (January,February). This way population sizes can be retrieved dur<strong>in</strong>g the different seasons and datacan be compared with data from former vears.A.P.219 Kribi <strong>Cameroon</strong> Tet/Fax+237 34621 3T
IIItIProiect Campo-Ma'an Larqe Mamrrl prooram Patricia BekhuitThe distribution <strong>of</strong> a population or species gives <strong>in</strong>formation on the area occupied by thepopulation or species. In order to obta<strong>in</strong> <strong>in</strong>formation on the distribution <strong>of</strong> the animals overtime par example through different seasons, data should preferably be gathered year round.For spatial distribution differences, data gathered should cover a large area. In both cases,spatial and time specific, sample size should be high to be significant!Dung counts on strip transectsWhile walk<strong>in</strong>g transects all dung seen will be marked and place and time noted. To assuredouble counts can not occur, one can mark dung by attach<strong>in</strong>g a red band on a nearby branchbut one can also decide to simply remove the dung from the strip transect. The red band hasthe advantage <strong>of</strong> follou'<strong>in</strong>g the dung pile over longer time, par example when parallelcollect<strong>in</strong>g data on deca1, rate. If follorv<strong>in</strong>g dung is not necessary, remov<strong>in</strong>g dung is probablythe easiest way. Before remov<strong>in</strong>g, distance on the transect (to compare possibly with otherexist<strong>in</strong>g data) and perpendicular distance from the census l<strong>in</strong>e to the middle <strong>of</strong> the dung pileshould be measured for every dung pile (set <strong>of</strong> boli). The latter to assure one only gather datawith<strong>in</strong> the beforehand fixed strip width (5 meter both side <strong>of</strong> census l<strong>in</strong>e). Distances are notrecorded <strong>of</strong> dung piles that are impossible to detect at 2 meûes range <strong>in</strong> the undergrowth asthey are assumed to have disappeared. Make sure you write your observations clearly downon waterpro<strong>of</strong> paper always mention<strong>in</strong>g date and place, so other people (or yourself) do notcome across problem decipher<strong>in</strong>g your notes. Write down what you see and not what youth<strong>in</strong>k!! If you see several dung piles, count them and write down how many you saw. It iswrong to count one and leave the other dung piles as you assume they are from the sameelephant (even if you are sure due to footpr<strong>in</strong>ts)!! Note that a dispersed dung pile is still onedung pile. Write also down if you did not see anyth<strong>in</strong>g, s<strong>in</strong>ce no observation is valuable<strong>in</strong>formation too.Input <strong>of</strong> fieldwork data <strong>in</strong> computerThe programme Excel is one <strong>of</strong> the best to file your data, s<strong>in</strong>ce easy transfers can be madetowards other computer programs and also some statistical calculation can be completed. Firstput all <strong>in</strong>formation <strong>in</strong> per dung pile thus also <strong>in</strong>clud<strong>in</strong>g extra data gathered like distance on the8.P.219 Kribi <strong>Cameroon</strong> Tel/Fax +237 346 21 37
transect (your basis file). Later on you can group dung counts per transect and time; makecolumns <strong>of</strong> date, place, number <strong>of</strong> dung (your work base file). Dur<strong>in</strong>g analysis add columnsfor density calculation.Example data <strong>in</strong>put <strong>in</strong> Excel; work base file15t10t0116t10t0131t10t01Data analysisWhen field data is collected and filed away <strong>in</strong> data sheets (excel) it is ready to be analysedand <strong>in</strong>terpreted. Thrs part is an imported part s<strong>in</strong>ce endless pages <strong>of</strong> raw field data do not helpany manager with decision tak<strong>in</strong>gs.Analys<strong>in</strong>g the data should start with calculat<strong>in</strong>g elephant densities ûom dung counts.Cal cul at<strong>in</strong>g e I ep hant de ns it i e sTo calculate the species density from dung density, <strong>in</strong>formation is needed on the production<strong>of</strong> dung per animal per day (defecation rate) and the number <strong>of</strong> days <strong>in</strong> which most <strong>of</strong> thedung disappeared (the decay time).A few researchers retrieved a defecation rate for forest elephants (Table Mt). W<strong>in</strong>g and Buss(1970) discovered defecation rates to be different for seasons <strong>in</strong> the Uganda forest. Dur<strong>in</strong>g thewet season they calculated a defecation rate <strong>of</strong> 17 whereas the dry season demonstrated adefecation rate <strong>of</strong> I I- Powell (199s) did research <strong>in</strong> the southwestern <strong>Cameroon</strong> and came upwith a defecation rate <strong>of</strong> 14,4 by follow<strong>in</strong>g a collared animal. Tchamba (Igg2) revealed a rate<strong>of</strong> 19,77 with a standard error <strong>of</strong> 0,23 while work<strong>in</strong>g <strong>in</strong> the Santchou reserve <strong>in</strong> <strong>Cameroon</strong>.For research <strong>in</strong> the Campo-Ma'an region I selected the rounded defecation rate <strong>of</strong> 14 (afterPowell) to be trustworthy.8.P.219 Kribi <strong>Cameroon</strong> Tet/Fax +237 346 21 3Tt0
IilIIIIIITable M1. Defecation rates <strong>of</strong> the African forest elephantComments19,77(SE0,23) Sanffi17Wet season, Kibale, Uganda11Dry season, Kibale, Uganda14,4South-western <strong>Cameroon</strong>Tchamba. 1992W<strong>in</strong>g & Buss, 1970W<strong>in</strong>g & Buss, 1970Powell, 1998The decay rate <strong>of</strong> the elephant dung is more complicated. Accord<strong>in</strong>g to White (1995)differences between decay rates <strong>in</strong> the dist<strong>in</strong>ct seasons surely occur and are enforced byvarious amounts <strong>of</strong> fruit <strong>in</strong> dung (fruit availability be<strong>in</strong>g season dependant) but he alsoconcluded that most elephant dung piles disappeared after 60-70 days. Evidentlydist<strong>in</strong>guish<strong>in</strong>g a fixed decay rate is very difficult and one has to except certa<strong>in</strong> variability.However <strong>in</strong> this research a fixed decay time is taken <strong>of</strong> 65 days. Dur<strong>in</strong>g the first time atransect is walked, the decay time stands for the maximum dung accumulation time(estimation <strong>of</strong> 65 da1's). If the same transect is walked for a second time after 14 days, thedung accumulation period is 14 days and not one day rnore or less. Obviously this will giveresults that are more accurate then the frst time us<strong>in</strong>g decay estimation. It is for this reasonthat repeated <strong>monitor<strong>in</strong>g</strong> <strong>of</strong> the same transects about every two weeks is advised.To estimate elephant density (number <strong>of</strong>elephant <strong>in</strong>dividuals per km2) from dung counts, thefollow<strong>in</strong>g equation is used:filephant density:fxlxwxdn:1-t-a-d:number <strong>of</strong> dung encountereddefecation rate (days- I )transect length (/crn)transect width (km)maximum dung accumulation period (days)8.P.219 Kribi <strong>Cameroon</strong> Tel/Fax +237 346 21 37il
IIIIIIIIICalculat<strong>in</strong>g elephant density frstthe formula, a correction needscould have been accumulated.Exam ple density calculation16t10t0131t10t01should be done per field trip per transect because, as seen <strong>in</strong>to be made for the different numbers <strong>of</strong> days with<strong>in</strong> dungStatisticsWhen all different elephant densities are calculated separately, statistical methods are neededto calculate the mean and the confidence limits <strong>of</strong> the elephant density and to see if significantdif[erences occtll between dif,Ferent areas or time periods. Compar<strong>in</strong>g or group<strong>in</strong>g data shouldnot be done at randomly. One can compare all the data from a specific area with all the datafrom another specific area if you would expect a difference (Dipikar island versus Southerncorridor, <strong>in</strong>side versus outside park) or compare data between different seasons (ra<strong>in</strong>y seasonversus dry season).In our case density data is normally distributed and at <strong>in</strong>terval level.To calculate means per transect or per season you have to sort out your data from your workbase file. For means per transect, data should be grouped per transect, for means per seasonsort out your data on date. V/ith<strong>in</strong> Excel this can easily be done (!data, !sort out).Simple statistics as calculat<strong>in</strong>g confidence limits should be done step by step; beware not touse the standard function <strong>in</strong> Excel for confidence <strong>in</strong>tervals s<strong>in</strong>ce it assumes the z value <strong>in</strong>stead<strong>of</strong> the t value, mak<strong>in</strong>g your <strong>in</strong>terval smaller then they should be, handy but not correct. Takethe effort <strong>of</strong> calculat<strong>in</strong>g it yourself follow<strong>in</strong>g the order given below:8.P.219 Kribi <strong>Cameroon</strong> Tet/Fax +237 346 21 3Zt2
IproiecttIIIIIIIIIIIIIICampo-Ma,an Larqe Mammal proqram patricia BekhuisExample <strong>of</strong> calculat<strong>in</strong>g confidence limitsDur<strong>in</strong>g the month October 2 transects has been walked 2 times and four densities havebeen calculated: 0,514; 0,176; 0,095; O,1gO.Value - Mean (Value- MeanDensities October ValueValue) 2o,022-0,059Variance = sum <strong>of</strong> squares / (sample size - 1)Variance <strong>of</strong> October = 0,0053 / 3 = 0,0018Standard Deviation = square root <strong>of</strong> varianceStandard Deviation <strong>of</strong> October = 0,0419Standard Error = Standard Deviation / root <strong>of</strong> sample sizeStandard Error <strong>of</strong> October = 0,0421 | 2 = 0,0209Confidence <strong>in</strong>terval = standard error x t (d.f. = 3 fl to,ozs= 3,192)Confidence <strong>in</strong>terval <strong>of</strong> October = 0,0666Upoer confidence limit = mean + confidence <strong>in</strong>tervalUpper confidence limit <strong>of</strong> October = 0,2205Lower confidence limit = mean - confidence <strong>in</strong>tervalLower confidence limit <strong>of</strong> October = 0,0872When confidence limits are calculated for densities <strong>in</strong> two different areas or for two differenttime periods, significant differences with a probability <strong>of</strong> 95o can be identified.8.P.219 Kribi <strong>Cameroon</strong> Tel/Fax +237 346 21 37l3
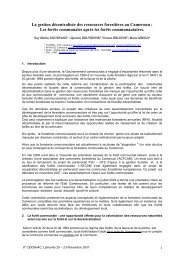
NIIItIIITo accept a significant difference with a probability <strong>of</strong> 95Yo, the mean density <strong>of</strong> group Ishould be outside the confidence limits <strong>of</strong> group 2 and the mean density <strong>of</strong> group 2 should beoutside the confidence limits <strong>of</strong> group 1 (two-sided test, t-value 0,02s).Example <strong>of</strong> two mean densities (A & B) with their confidence limits when significant differenceand when no difference can be demonstratedABSignificant differentNo significant differenceAside from calculat<strong>in</strong>g confidence limits step by step there are statistical tests to demonstrateif significant di{lerences occur. Statistical tests can be used if distribution is not normal or ifone wants to demonstrate differences between more then two groups or if one simply wants toknow the chance that there is no difference (p-value).Which statistical method to use for verifi<strong>in</strong>g if differences do or do not occur, depends on theamount <strong>of</strong> data gathered and how many groups you want to compare (if data is normallydistributed). To choose the right statistical test for differences comparison a key-table fromWhite and Edwards (2000) is <strong>in</strong>cluded below:p8.P.219 Kribi <strong>Cameroon</strong> Tel/Fax +237 346 21 37t4
lIproi""t Campo_Ma'"n L"ro" M"**"1 prooram patricia BekhuisIIIIIIIDo you have more than two samples between u'hich youwish to analyse differences ?execule an ANOVA testDo you have more than about 30pairs <strong>of</strong>measurements <strong>in</strong> yourtwosamples ?Are your measures at<strong>in</strong>terval level ?ilExecute the Marur-Whitney U testIf two areas are compared, the measures are not matched pairs. Matched pairs exist if onemeasure from one <strong>of</strong> the samples can be paired with one (and orùy one) measurement fromthe other sample.If differences are found, note at which confidence level, i.e. 95yo, 99o or 99,9yo thisdifference is found. Less than 95Yo is considered not significant.If no difference can be confirmed with at least 5% significance level us<strong>in</strong>g the right statisticaltest, the data should be grouped and a mean density calculated. While report<strong>in</strong>g a meanelephant dersity, present the standard deviation or <strong>in</strong>terval levels as well.B.P. 219 Kribi <strong>Cameroon</strong> Tel/Fax +237 346 21 37l5
IIIIItIIilllProiect Camoo-Ma'an Larqe Mammal Proqram Patricia BekhuisReport<strong>in</strong>g the resultsInterpretation <strong>of</strong> resultsWhen data is analysed, the outcome are numbers (confidence limits, probabilities) which nowhas to be <strong>in</strong>terpreted by the researcher. What do these [umbers mean, how can they be used <strong>in</strong>real life.The <strong>in</strong>formation like; for the mean density <strong>of</strong> April and October the outcome <strong>of</strong> the T-test wasp
IItIIIIProiect Campo-Ma'an Larqe Mammal Prooram Patricia BekhuisMake sure you stand beh<strong>in</strong>d the report you have r.r,ritten. Your name is on it and yourreputation depends on it. If you are not confident about your work, ask colleagues or others togive comments on your draft version before f<strong>in</strong>aliz<strong>in</strong>g it.Good luck8.P.219 Kribi <strong>Cameroon</strong> Tel/Fax +237 346 21 37t7
I),-TIIIIIIIIIProiect CamPo-Ma'anProtocolStep IPlace transects if not yet done-> See fieldwork page IStep 2Walk transects and make observations every two weeks-> See dung counts on strip transects page l0Step 3Enter all data <strong>in</strong> the cot'ttputer-> See <strong>in</strong>put <strong>of</strong> fieldu,ork data <strong>in</strong> con'puler page 10Step 4:IlIAnalyse the data-> See data analysis page I IStep 5Interpret and format the results-> See report<strong>in</strong>g the results page l7IIIIA.P.219 Kribi <strong>Cameroon</strong> Tel/Fax+237 34621 37l8
IIIttttttIIIllIIIIIIReferences cited <strong>in</strong> manualBekhuis P.D.B.M. (2002) Elephant density and Distribution <strong>in</strong> the southern part <strong>of</strong> NationalP ar k C a mp o - Ma' an. Internal repo rt Campo -Ma' an P roj ect Camero o n'Blom A., A Almasi, I.M.A. Heitkonig, J-B Kpanou, H.H.T. Pr<strong>in</strong>s (2002) A survey <strong>of</strong> the apes<strong>in</strong> the Dzanga-Ndoki National Park, Central African Republic' Journal <strong>of</strong> AfricanEcology, <strong>in</strong> Press)powell J (199S) Biologt <strong>of</strong>forest elephants <strong>in</strong> southwestern <strong>Cameroon</strong>.unpublished Ph. D. Thesis, university <strong>of</strong> cambridge, cambridge, uKTchamba M.N (1992) Defecation by the Africanforest elephont Loxodonta africana cyclotis<strong>in</strong> the Santchou Reserve, <strong>Cameroon</strong>. Mammalia 56: 155-158Van der Hoeven c.A. (2002) Assessment <strong>of</strong> mammal densities <strong>in</strong> the campo-Ma'an ra<strong>in</strong><strong>Forest</strong> by way <strong>of</strong> pooled expert Op<strong>in</strong>ion.Internal report Campo-Ma'an Project <strong>Cameroon</strong>'white L.J.T. (1995) Factors affect<strong>in</strong>g the duration <strong>of</strong> elephant dung piles <strong>in</strong> ra<strong>in</strong> forest <strong>in</strong> theLopé Reserve, Gabon African Journal <strong>of</strong> Ecology 33: 142-150\\4rite L., Edr.vards A eds.. (2000) Consen,ation reseat'ch <strong>in</strong> tlrc A"û'icatt raittforeslsI atecltnical handbook. Wildlife Conservation Society, New York.w<strong>in</strong>g, L.D. &.I.O. Buss (1970) Elephants andforest. wildlife Monogr. l9:l-92B.P. 219 Kribi <strong>Cameroon</strong> Tel/Fax +237 346 21 37l9I