Chapter 3 - New York Metropolitan Transportation Council
Chapter 3 - New York Metropolitan Transportation Council
Chapter 3 - New York Metropolitan Transportation Council

You also want an ePaper? Increase the reach of your titles
YUMPU automatically turns print PDFs into web optimized ePapers that Google loves.
Coordinated Public Transit-Human Services <strong>Transportation</strong> Plan for NYMTC Region • FinalN E W Y O R K M E T R O P O L I T A N T R A N S P O R T A T I O N C O U N C I L• L O N G I S L A N D<strong>Chapter</strong> 3. Overview of Long IslandIntroductionThe purpose of this chapter is to introduce general characteristics of the Long Island subregion(one of three subregions within the NYMTC region) and its two counties to give some context tothe information on public transportation and community transportation services that is included in<strong>Chapter</strong> 4.First, a general profile of the subregion is presented and discussed. This is followed by generalprofiles for the two counties. Each profile documents population and population growth, landarea, population density, and general demographic characteristics such as age, income andemployment. For the general profile of the subregion, tables are broken down by county. For thegeneral profile of the counties, tables are broken down by municipality. A more detailed look atthe demographic characteristics of older adults, persons with disabilities, and low incomepopulations is presented at the beginning of <strong>Chapter</strong> 5.Profile of Long IslandOverviewLong Island is the largest island adjoining the continental United States, stretching 118 miles fromMontauk in the east to the Hudson River in the west. The Long Island and Block Island soundsprovide the northern border, with the Atlantic Ocean to the east and south.An excerpt from the web site of the Long Island Index provides a detailed description of LongIsland’s interesting governance:Long Island’s governance structure, shaped over centuries, consists of 901different entities including two cities, two counties, 13 towns, 95 villages, and manyother special purpose units including water, fire, library and 127 school districts,each with its own taxing authority. Nassau County has three townships:Hempstead, North Hempstead and Oyster Bay; and two cities, Long Beach andGlen Cove. The county is made up of 126 municipal corporations including 64different villages, 56 school districts and 19 legislative districts. Suffolk County hasten townships: Huntington, Babylon, Islip, Smithtown, Brookhaven, Riverhead,Southampton, Southold, East Hampton and Shelter Island. There are 113municipal corporations, including 31 villages, 71 school districts, and 18 legislativebodies.Each town and village has an elected board that passes local legislation impacting theircommunity. In addition to the number of towns and villages, there are two Indian reservationslocated in Suffolk County, Poospatuck and Shinnecock.Page 3-1
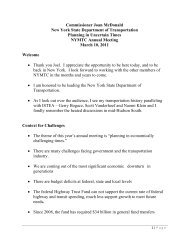
Coordinated Public Transit-Human Services <strong>Transportation</strong> Plan for NYMTC Region • FinalN E W Y O R K M E T R O P O L I T A N T R A N S P O R T A T I O N C O U N C I L• L O N G I S L A N DFigure 3-1Long Island SubregionAreaLong Island’s total area is approximately 2,800 square miles; but over 1,600 of that is water.Suffolk County is much larger than Nassau County, covering 912 square miles of land area, whilethe total land area of Nassau County is 287 square miles. Brookhaven, in Suffolk County, andHempstead, in Nassau County, are the largest towns on Long Island, covering 259 square milesand 120 square miles, respectively. Long Beach, in Nassau County, is the smallest municipalityin either of the counties, covering only two square miles of land area. Figure 3-2 below lists thetotal area and land area for the Long Island subregion.Figure 3-2Long Island Subregion Area by CountyTotal Area (Sq. Miles) Land Area (Sq. Miles)Nassau County 453 287Suffolk County 2,373 912Long Island 2,826 1,199Source: US Census (2000); figures are rounded estimatesPopulation and Population GrowthPopulation counts for Long Island date back to 1790 for Suffolk County and 1900 for NassauCounty. Combined total population for the two counties did not reach one million until after 1950.Figure 3-3 below provides detail on the population changes in both counties, and for Long Island.Page 3-2
Coordinated Public Transit-Human Services <strong>Transportation</strong> Plan for NYMTC Region • FinalN E W Y O R K M E T R O P O L I T A N T R A N S P O R T A T I O N C O U N C I L• L O N G I S L A N DFigure 3-3Long Island Population History1950 Pop. 1960 Pop. 1970 Pop. 1980 Pop. 1990 Pop.2000Pop.Nassau County 672,765 1,300,171 1,428,838 1,321,582 1,287,348 1,334,544Suffolk County 276,129 666,784 1,127,030 1,284,231 1,321,864 1,419,369Long Island 948,894 1,966,955 2,555,868 2,605,813 2,609,212 2,753,913Source: US Census; US Department of CommerceBetween 1950 and 1960, the population in Nassau County doubled and in Suffolk County, thepopulation almost tripled. Between 1960 and 1970, the population grew again, though at aslightly slower rate. After 1970, the total population in Nassau County fell slightly, from 1,428,838in 1970 to 1,321,582 in 1980, to 1,287,348 in 1990. In Suffolk County, the population increasedfrom 1,127,030 in 1970 to 1,321,864 in 1990.As of the 2000 Census, total population for the Long Island subregion was approximately 2.7million. This figure is almost evenly divided among Nassau and Suffolk counties. In NassauCounty, there were about 1.3 million people and in Suffolk County, about 1.4 million. The Townof Hempstead in Nassau County was the most populated of all the municipalities, with 755,924people. Brookhaven, in Suffolk County, was the second most populated, with almost 450,000people. Shelter Island was the least populated by far of any town or city on Long Island, with only2,228 residents.According to Census Bureau estimates, the population on Long Island grew by only 1.5 percentfrom 2000 to 2006, less than both the state average (1.7 percent) and the national average (7.2percent). Population in Nassau County decreased, but by less than one percent. The towns ofHempstead and North Hempstead in Nassau County both experienced a decrease in population.In Hempstead, the population shrank by over six percent. In Suffolk County, the population grew,but only by 3.5 percent, very similar to the growth experienced in <strong>New</strong> <strong>York</strong> City (3.3 percent).Smithtown experienced the lowest rate of growth, less than one percent, and Huntingtonexperienced the highest growth rate, almost seven percent. Figure 3-4 below shows the changein population for Long Island.Figure 3-4Long Island Subregion Population and PopulationChange by County2000 Population 2006 Population Change % ChangeNassau County 1,334,544 1,325,662 (8,882) (0.7%)Suffolk County 1,419,369 1,469,715 50,346 3.5%Long Island 2,753,913 2,795,377 41,464 1.5%Source: US Census (2000); figures are rounded estimatesThere is an important caveat to these 2006 estimates. For the following year’s estimates, NassauCounty disputed the original Census Bureau’s 2007 population findings. The county believes thatthe Census undercounted population by 50,000. Population estimates for Long Island for 2007,developed by the Nassau County Planning Department, were recently accepted by the CensusPage 3-3
Coordinated Public Transit-Human Services <strong>Transportation</strong> Plan for NYMTC Region • FinalN E W Y O R K M E T R O P O L I T A N T R A N S P O R T A T I O N C O U N C I L• L O N G I S L A N DBureau. In Nassau County, the population is estimated to be 1,353,061 and in Suffolk County,1,511,732. Data from 2006 is still used here in the analysis, since it is available by town.Population DensityAs shown in Figure 3-5, Long Island’s overall population density is approximately 2,300 personsper square mile. Nassau County is the geographically smaller of the counties and also thedensest. There are 4,650 persons per square mile in Nassau County. In contrast, there are1,556 persons per square mile in Suffolk County.Figure 3-5Long Island Subregion Population Density by County2000 Population Land Area (Sq. Mi.) Density (Persons per Sq. Mi.)Nassau County 1,334,544 287 4,650Suffolk County 1,419,369 912 1,556Long Island 2,753,913 1,199 2,297Source: US Census (2000); figures are rounded estimatesPopulation Age DistributionThe average age of Long Islanders is approximately 37 years old. Figure 3-6 shows agedistribution by county. Overall, older adults (65 and older) make up 13 percent of the totalpopulation. In Nassau County, 15 percent of residents are older, while in Suffolk County, thepercentage is only slightly lower at 12 percent. The percentage of older adults statewide is 13percent.Percentages of children under the age of 18 and adults age 18 to 64 are similarly spread.Overall, children make up 25 percent of the population on Long Island; 25 percent in NassauCounty and 26 percent in Suffolk County. By municipality, the percentage ranges from 18 to 27percent. Adults age 18 to 64 comprise 61 percent of the population of Long Island overall, 60percent in Nassau County, and 62 percent in Suffolk County. This age group makes up no lessthan 55 percent of the total population in any city or town on Long Island.Figure 3-6Long Island Subregion Age Distribution by CountyUnder 18 18 - 64 65 and OverNassau CountyPopulation 329,079 804,624 200,841Percentage 25% 60% 15%Suffolk CountyPopulation 370,081 881,730 167,558Percentage 26% 62% 12%Long IslandPopulation 699,160 1,686,354 368,399Percentage 25% 61% 13%Source: US Census (2000); figures are rounded estimatesPage 3-4
Coordinated Public Transit-Human Services <strong>Transportation</strong> Plan for NYMTC Region • FinalN E W Y O R K M E T R O P O L I T A N T R A N S P O R T A T I O N C O U N C I L• L O N G I S L A N DIncomeMedian household income in both Long Island counties is higher than both the state median($43,393) and the national median ($41,994). In Nassau County, the median household incomeis $72,030 and in Suffolk County, $65,288. 3 Consequently, just over 135,000 or only 15 percentof the households on Long Island are considered low income, which is lower than the nationalaverage of 20 percent.EmploymentUnemployment rates on Long Island have risen and fallen over the past few years, though theyare still lower than the national and state averages—3.6 percent in Nassau County and 3.8percent in Suffolk County in 2007, while the national average for the same year was 4.6 percentand the state average was 4.5 percent. When compared to other <strong>New</strong> <strong>York</strong> counties, Nassauand Suffolk counties also have among the lowest unemployment rates in the state. Of the 62counties in <strong>New</strong> <strong>York</strong>, Nassau County has the third lowest unemployment rate and SuffolkCounty, the eighth.Private sector employment on Long Island grew by nine percent between 1998 and 2007,although it decreased by two percent between 2006 and 2007. According to data obtained fromEmpire State Development, about 20 percent of workers from the Long Island subregion areemployed in Professional and Related fields, 17 percent in Administrative Support, and 15percent in Management or Business. Jobs in the Service or Sales industries each also make upmore than ten percent of the workforce. Technicians, and workers in Production, <strong>Transportation</strong>,Construction, and Farm, Fishing, and Forestry fields each make up less than ten percent of thetotal workforce from Long Island. Over the past five years, the greatest employment growth hasbeen seen in the Education and Health Services fields, growing by 17 percent and 25 percent,respectively, during the five year period.3 In 1999 dollars. In 2006, these figures are estimated at $85,994 and $76,847 in Nassau and Suffolk counties,respectively.Page 3-5
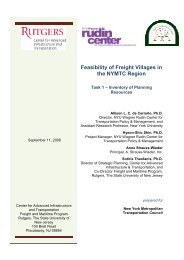
Coordinated Public Transit-Human Services <strong>Transportation</strong> Plan for NYMTC Region • FinalN E W Y O R K M E T R O P O L I T A N T R A N S P O R T A T I O N C O U N C I L• L O N G I S L A N DGeneral Profile of Nassau CountyOverviewNassau County lies on the western half of Long Island, bordered by Suffolk County to the eastand Queens County to the west. Within the county’s 287 square miles of land are the cities ofGlen Cove and Long Beach, the towns of Hempstead, North Hempstead, and Oyster Bay, andover 100 unincorporated areas. Together, the cities and towns encompass 64 villages and 53hamlets.Figure 3-7Nassau County with in the NYMTC RegionPage 3-6
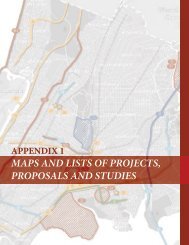
Coordinated Public Transit-Human Services <strong>Transportation</strong> Plan for NYMTC Region • FinalN E W Y O R K M E T R O P O L I T A N T R A N S P O R T A T I O N C O U N C I L• L O N G I S L A N DFigure 3-8Nassau County DetailEight major roadways serve Nassau County, running east to west. Starting on the North Shoreand going south: NY 25A, Northern Boulevard, runs from Suffolk County to the QueensboroBridge in Long Island City in Queens.NY 25, Jericho Turnpike, runs from Suffolk County over the Queensboro Bridge into Manhattan.Interstate 495, the Long Island Expressway, runs from Suffolk County into Manhattan via theMidtown Tunnel in Long Island.The Northern State Parkway runs from Suffolk County and becomes the Grand Central Parkwayas it enters Queens.NY 24, Hempstead Turnpike, runs from NY 110 in Suffolk County through the center of NassauCounty and into Jamaica Avenue in Queens Village.The Southern State Parkway runs from Suffolk County into the Cross Island and LaureltonParkways as it enters Queens.Page 3-7
Coordinated Public Transit-Human Services <strong>Transportation</strong> Plan for NYMTC Region • FinalN E W Y O R K M E T R O P O L I T A N T R A N S P O R T A T I O N C O U N C I L• L O N G I S L A N DNY 27, Sunrise Highway, begins in Suffolk County and continues into Queens and Brooklyn.Finally, Merrick Road begins at the Suffolk County line and runs west to Rockville Centre, whereit crosses NY 27, Sunrise Highway, and continues west, northwest into, Queens, terminating atHillside Avenue, in the Jamaica section of Queens.In addition, three major roadways serve Nassau County from north to south. Starting from east towest: NY 135, the Seaford Oyster Bay Expressway, runs from NY 25, Jericho Turnpike, in thenorth to Merrick Road, in the south.The Wantagh State Parkway runs from the Northern State Parkway in Westbury to Jones Beachon the Atlantic Ocean.Paralleling the Wantagh State Parkway to the west, the Meadowbrook State Parkway runs fromthe Northern State Parkway in Carle Place to Jones Beach State Park.MTA Long Island Bus and the City of Long Beach provide fixed-route bus service in NassauCounty, with several routes traveling to Queens and western Suffolk County. Daily rail service isoperated by MTA Long Island Rail Road. In addition, several demand-response alternatives areavailable to residents of Nassau County.AreaNassau County is the smaller of the two counties in the Long Island subregion, covering 287square miles of land area. The Towns of Hempstead and Oyster Bay are the largestmunicipalities in Nassau County, covering 120 and 104 square miles of land, respectively. TheCity of Long Beach, encompassing only two square miles of land, is the smallest of the NassauCounty municipalities, and also the smallest city on all of Long Island. Figure 3-9 below providesgreater detail on the area of cities and towns in Nassau County.Figure 3-9Nassau County Area by MunicipalityTotal Area (Sq. Miles) Land Area (Sq. Miles)City of Glen Cove 19 7Town of Hempstead 191 120City of Long Beach 4 2Town of North Hempstead 69 54Town of Oyster Bay 169 104Nassau County 453 287Source: US Census (2000); figures are rounded estimatesPopulation and Population GrowthPopulation records have been kept in Nassau County since 1900. At the time of the firstpopulation count in June of 1900, the population of Nassau County was just over 55,000. From1900 to 1910 and then again between 1910 and 1920, county population doubled. Between1920 and 1930, the population grew by 140 percent, from 126,120 to 303,053. From 1930 toPage 3-8
Coordinated Public Transit-Human Services <strong>Transportation</strong> Plan for NYMTC Region • FinalN E W Y O R K M E T R O P O L I T A N T R A N S P O R T A T I O N C O U N C I L• L O N G I S L A N D1940, population growth slowed to 34 percent, but then it grew by 65 percent during the nextdecade (1940-1950), and 93 percent during the decade after that (1950 to 1960). After 1960,population growth in Nassau County slowed considerably, to less than 10 percent from 1960 to1970, before the population began to decline each decade until the year 2000.Figure 3-10Nassau County Population by YearSource: US Census; US Department of CommerceAs of the 2000 Census, there were about 1.3 million people in Nassau County, an increase ofalmost four percent over the population during the previous decade. The Town of Hempstead isthe most populated of all the municipalities in Nassau County and on Long Island, with 751,102people (as of 2006), although this figure shows a six percent decline in population since 2000.North Hempstead also experienced a decline in population between 2000 and 2006, though at amuch lower rate than Hempstead. Figure 3-11 below shows the population and populationchange for each of the municipalities in Nassau County. The 2006 estimates from the USCensus Bureau are not available for Glen Cove or Long Beach.Figure 3-11Nassau County Population andPopulation Change by Municipality2000 Population 2006 Population Change % ChangeCity of Glen Cove 26,622 n/aTown of Hempstead 755,924 751,102 (4,822) (6.4%)City of Long Beach 35,462 n/aTown of North Hempstead 222,611 218,186 (4,425) (1.9%)Town of Oyster Bay 293,925 299,635 5,710 1.9%Nassau County 1,334,544 1,325,662 (8,882) (0.7%)Source: US Census (2000); figures are rounded estimatesPage 3-9
Coordinated Public Transit-Human Services <strong>Transportation</strong> Plan for NYMTC Region • FinalN E W Y O R K M E T R O P O L I T A N T R A N S P O R T A T I O N C O U N C I L• L O N G I S L A N DPopulation DensityAs shown in Figure 3-12, population density in Nassau County as of the year 2000 was 4,650persons per square mile of land area. This figure is significantly higher than persons per squaremile for both the state of <strong>New</strong> <strong>York</strong> (402 persons per square mile) and the United States (80persons per square mile). The City of Long Beach is the densest municipality in Nassau County,with more than 17,731 persons per square mile. However, at two square miles, Long Beach isalso the smallest municipality, in terms of land area, on Long Island. Hempstead is the seconddensest area in Nassau County, with 6,299 persons per square mile. The remaining cities andtowns in Nassau County have near or fewer than 4,000 persons per square mile each.Figure 3-12Nassau County Population Density by Municipality2000 Population Land Area (Sq. Mi.) Density (Persons per Sq. Mi.)City of Glen Cove 26,622 7 3,803Town of Hempstead 755,924 120 6,299City of Long Beach 35,462 2 17,731Town of North Hempstead 222,611 54 4,122Town of Oyster Bay 293,925 104 2,826Nassau County 1,334,544 287 4,650Source: US Census (2000); figures are rounded estimatesPopulation Age DistributionThe median age of Nassau County residents was 38.5 in the year 2000. This is only slightlyhigher than the median age of <strong>New</strong> <strong>York</strong>ers (35.9). In Nassau County, persons in this age group,18 – 64, made up 60 percent of the total population. Similarly, when broken down bymunicipality, persons age 18 – 64 made up between 60 and 65 percent of the total population ofeach city or town. Children under the age of 18 comprised between 20 and 25 percent of thetotal population in Nassau County, and in each city or town.Older adults, those ages 65 and older, made up 15 percent of the population of Nassau County.Glen Cove had the highest proportion of older adults, with 18 percent of its population over theage of 65. In Hempstead, 106,463 or 14 percent of residents were older; the lowest percentageamong Nassau County municipalities.Page 3-10
Coordinated Public Transit-Human Services <strong>Transportation</strong> Plan for NYMTC Region • FinalN E W Y O R K M E T R O P O L I T A N T R A N S P O R T A T I O N C O U N C I L• L O N G I S L A N DFigure 3-13Nassau County Age Distribution by MunicipalityUnder 18 18 - 64 65 and OverCity of Glen CovePopulation 5,643 16,320 4,659Percentage 21% 61% 18%Town of HempsteadPopulation 192,351 457,110 106,463Percentage 25% 60% 14%City of Long BeachPopulation 6,577 22,974 5,911Percentage 19% 65% 17%Town of North HempsteadPopulation 52,425 133,151 37,035Percentage 24% 60% 17%Town of Oyster BayPopulation 72,083 175,069 46,773Percentage 25% 60% 16%Nassau CountyPopulation 329,079 804,624 200,841Percentage 25% 60% 15%Source: US Census (2000); figures are rounded estimatesPopulation of Persons with DisabilitiesFigure 3-14 shows the percentage and density of persons with disabilities in Nassau County. Asshown, almost 15 percent of persons (over the age of five) in Nassau County reported a disabilityin the 2000 Census. Most of the municipalities in Nassau County are similar in terms of thepercentage of population with a disability, with the exception of Long Beach. Long Beach has thehighest share of residents with disabilities in Nassau County—7,172 individuals, or 20 percent.Similarly, Long Beach has the highest density of persons with disabilities – 3,586 persons withdisabilities per square mile.Figure 3-14Percentage and Density of Persons with Disabilities inNassau County, by MunicipalityLand Area(Sq. Mi.)2000PopulationTotal Personswith Disabilities(Age 5+)% ofPopulationDensity of Personswith DisabilitiesCity of Glen Cove 7 26,622 4,052 15.22% 579Town of Hempstead 120 755,924 116,208 15.37% 968City of Long Beach 2 35,462 7,172 20.22% 3,586Town of North Hempstead 54 222,611 31,375 14.09% 581Town of Oyster Bay 104 293,925 37,279 12.68% 358Nassau County 287 1,334,544 196,086 14.69% 683Source: US Census (2000); figures are rounded estimatesPage 3-11
Coordinated Public Transit-Human Services <strong>Transportation</strong> Plan for NYMTC Region • FinalN E W Y O R K M E T R O P O L I T A N T R A N S P O R T A T I O N C O U N C I L• L O N G I S L A N DIncomeIn 2006, median household income in Nassau County was $85,994. The state median income forthe same year was $51,384 and the national, $48,451. In 2000, median household income inNassau County was $72,030. Only 64,483 or 14.4 percent of households in Nassau County hadannual incomes under $25,000. In Glen Cove and Long Beach, low income households made upabout 19.6 percent of households, while Oyster Bay had the lowest proportion, with 11.75percent. Hempstead and North Hempstead fall in between those communities, withapproximately 15 and 13 percent of households considered to have low income, respectively.Statewide, 30 percent of households had low income in the year 2000.Figure 3-15Percentage and Density of Low Income Households inNassau County, by MunicipalityTotalHouseholdsLow IncomeHouseholds (< $25,000)% LowIncomeHouseholdsDensity of LowIncomeHouseholdsCity of Glen Cove 9,456 1,862 19.69% 266Town of Hempstead 247,131 37,937 15.35% 316City of Long Beach 14,938 2,929 19.61% 1,464Town of North Hempstead 76,880 10,073 13.10% 187City of Oyster Bay 99,398 11,682 11.75% 112Nassau County 447,803 64,483 14.40% 225Source: US Census (2000); figures are rounded estimatesEmploymentIn 2007, there was an average of 672,745 employees working in Nassau County. At 3.6 percentunemployment, the unemployment rate there was lower than the state (4.6) and national (4.5)rates. Of the 62 counties in <strong>New</strong> <strong>York</strong>, only two other counties, Putnam and Tompkins,experienced lower unemployment than Nassau County.Employment data estimated by occupation and industry for the year 2006, at the county level, isavailable from the U.S Census Bureau. In 2006, a large majority of Nassau County residentswere employed in either Management, Professional, and Related occupations (42 percent) orSales and Office occupations (29 percent), together making up 71 percent of the workforce.Service occupations made up a significantly smaller portion of the workforce, 14 percent, whileoccupations in Construction, Extraction, and Maintenance and Production, <strong>Transportation</strong>, andMaterial Moving each made up another seven percent of the workforce in Nassau County.Workers in Farming, Fishing, and Forestry made up less than one percent.Page 3-12
Coordinated Public Transit-Human Services <strong>Transportation</strong> Plan for NYMTC Region • FinalN E W Y O R K M E T R O P O L I T A N T R A N S P O R T A T I O N C O U N C I L• L O N G I S L A N DGeneral Profile of Suffolk CountyOverviewSuffolk County is the easternmost county in <strong>New</strong> <strong>York</strong>, bordered by the Long Island and BlockIsland sounds to the north, the Atlantic Ocean to the east and south, and Nassau County to thewest. The county is unique in that a portion of its land mass is situated on two peninsulas, theNorth Fork and the South Fork, divided by a series of bays and sounds, including Great SouthBay, Gardiners Bay, Napeague Bay, Sag Harbor Bay, Noyack Bay, Southold Bay, Shelter IslandSound, Little Peconic Bay, Great Peconic Bay, and Flanders Bay. Orient Point is theeasternmost point on the North Fork and Montauk is its counterpoint on the South Fork.Suffolk County is divided into ten towns: Babylon, Brookhaven, East Hampton, Huntington, Islip,Riverhead, Shelter Island, Smithtown, Southampton, and Southold, and each town containsnumerous villages. In addition, there are two Indian reservations in Suffolk County: Poospatuckand Shinnecock.Suffolk County is served by eight major roadways running from east to west. Each of the forks isserved by a single primary roadway. Beginning on the North Shore, NY 25A runs from Calvertonto Smithtown, co-aligns with NY 25 through Smithtown, then diverges from NY 25, west ofSmithtown and travels west into Nassau County.NY 25, the Jericho Turnpike, begins in Orient Point and travels west to Nassau County.NY 347, Nesconset Highway, is major artery that begins at the diverge with NY 454 VeteransHighway. NY 347 Nesconset Highway begins where it merges with the Northern State Parkwayand is co-aligned with NY 454. Approximately two miles east of the Northern State Parkway, NY347 diverges from NY 454 and travels northeast to merge with NY 25A in Port Jefferson Station.NY 454 Veterans Highway diverges from NY 25 in Commack and continues southeast toPatchogue. Interstate 495, the Long Island Expressway, is the major traffic artery of Long Island,it begins at CR 58, Old Country Road, in Riverhead and continues west through central SuffolkCounty into Nassau County.The Southern State Parkway runs from Heckscher State Park into Nassau County.NY 27 runs from Montauk Point and becomes CR 39 in Southampton. As CR 39 approaches theShinnecock Canal, it becomes NY 27 again which is an expressway all the way west toLindenhurst where it reverts to a major arterial and then enters Nassau County.Montauk Highway begins at Tuckahoe Road, just west of the Village of Southampton. MontaukHighway extends west to Nassau County. Between the Shinnecock Hills and Patchogue it is CR80. Between Patchogue and Oakdale it is called CR 85 and briefly merges with NY 27 inOakdale. Shortly after the merge, NY 27A diverges from NY 27 and continues west into NassauCounty.Suffolk County is served by seven major north-south arterials.Starting in the west, NY 110 runs between Huntington Harbor in the north to NY 27A in Amityvillein the south.Page 3-13
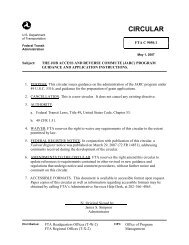
Coordinated Public Transit-Human Services <strong>Transportation</strong> Plan for NYMTC Region • FinalN E W Y O R K M E T R O P O L I T A N T R A N S P O R T A T I O N C O U N C I L• L O N G I S L A N DNY 231 runs from NY 25 in Dix Hills to NY 27A in Babylon.The Sunken Meadow State Parkway runs from Sunken Meadow State Park down to the SouthernState Parkway.Traveling one exit west on the Southern State Parkway from the Sagtikos Parkway, the RobertMoses Parkway begins and connects the Southern State Parkway to ocean beaches at RobertMoses State Park. NY 111 runs from NY 25 in Smithtown to NY 27A in Islip.CR 97-Nichols Road runs from NY 25A in Stony Brook to CR 85 Montauk Highway in Bayport.CR 83 runs from NY 25A in Mount Sinai to CR 80 Main Street in Patchogue. NY 112 runs fromNY 25A in Port Jefferson Station to CR 80 Main Street in Patchogue.CR 46-William Floyd Parkway runs from NY 25A in Shoreham to Smith Point County Park on theAtlantic Ocean.Finally, NY 114 begins in Greenport on the North Fork of Suffolk County, crosses to ShelterIsland on North Ferry, and traverses Shelter Island where it crosses over to Northaven on theSouth Fork using South Ferry. NY 114 continues southeast terminating at NY 27 in EastHampton.Suffolk County Transit (SCT) and Huntington Area Rapid Transit (HART) provide fixed-route busservice in Suffolk County. Daily rail service is operated by MTA Long Island Rail Road. Inaddition, a number of demand-response alternatives are available to residents of Suffolk County.Figure 3-16Suffolk County within the NYMTC RegionPage 3-14
Coordinated Public Transit-Human Services <strong>Transportation</strong> Plan for NYMTC Region • FinalN E W Y O R K M E T R O P O L I T A N T R A N S P O R T A T I O N C O U N C I L• L O N G I S L A N DAreaSuffolk County is much larger geographically than its neighbor to the west. From the NassauCounty border to Montauk Point, Suffolk County stretches 86 miles. With 912 square miles ofland area, Suffolk County makes up 76 percent of the land mass of Long Island. The town ofBrookhaven is the largest town in Suffolk County, encompassing 259 square miles. Both theShinnecock and Poospatuck reservations are significantly smaller than any of the municipalitiesin Suffolk County, encircling only about one square mile in land area each.Figure 3-17Suffolk County DetailFigure 3-18Suffolk County Area by MunicipalityTotal Area (Sq. Miles) Land Area (Sq. Miles)Town of Babylon 114 52Town of Brookhaven 532 259Town of East Hampton 386 74Town of Huntington 137 94Town of Islip 163 105Poospatuck Reservation 0.09 0.09Town of Riverhead 201 67Town of Shelter Island 27 12Shinnecock Reservation 1 1Town of Smithtown 111 54Town of Southampton 296 139Town of Southold 404 54Suffolk County 2,373 912Source: US Census (2000); figures are rounded estimatesPage 3-15
Coordinated Public Transit-Human Services <strong>Transportation</strong> Plan for NYMTC Region • FinalN E W Y O R K M E T R O P O L I T A N T R A N S P O R T A T I O N C O U N C I L• L O N G I S L A N DPopulation and Population GrowthThe US Census Bureau estimates the population of Suffolk County as of 2006 as 1,469,715persons. This is up about 3.5 percent from the counted 2000 population, 1,419,369. Populationfigures have been available for Suffolk County since the year 1790. Since then, population hasgrown every decade by an average of 26 percent. However, between 1950 and 1970, the Countyexperienced a huge jump in population, growing almost 145 percent between 1950 and 1960 and69 percent between 1960 and 1970. Since then, population growth has not been more than 15percent per decade, with an average growth rate of seven percent. However, this is stillsignificantly higher than the average growth rate for the state of <strong>New</strong> <strong>York</strong>, 1.7 percent.Estimates of 2006 population counts are available for five towns in Suffolk County and arepresented in Figure 3-19 below. As shown, the Town of Huntington has experienced populationgrowth higher than the county overall, while other municipalities have grown at a lower rate.Figure 3-19Suffolk County Population and Population Change byMunicipality2000Population2006Population Change % ChangeTown of Babylon 211,792 218,910 7,118 3.3%Town of Brookhaven 448,248 467,441 19,193 4.3%Town of East Hampton 19,719 n/aTown of Huntington 195,289 208,638 13,349 6.8%Town of Islip 322,612 326,506 3,894 1.2%Poospatuck Reservation 271 n/aTown of Riverhead 27,680 n/aTown of Shelter Island 2,228 n/aShinnecock Reservation 504 n/aTown of Smithtown 115,715 116,745 1,030 0.9%Town of Southampton 54,712 n/aTown of Southold 20,599 n/aSuffolk County 1,419,369 1,469,715 50,346 3.5%Source: US Census (2000); figures are rounded estimatesPage 3-16
Coordinated Public Transit-Human Services <strong>Transportation</strong> Plan for NYMTC Region • FinalN E W Y O R K M E T R O P O L I T A N T R A N S P O R T A T I O N C O U N C I L• L O N G I S L A N DPopulation DensitySuffolk County is much less densely populated than Nassau County, but still much more so thanthe state of <strong>New</strong> <strong>York</strong> as a whole. In the year 2000, there were 1,556 persons per square mile ofland area in Suffolk County, 2,297 persons per square mile on all of Long Island, and 402persons per square mile in the state of <strong>New</strong> <strong>York</strong>. The Town of Babylon was the densestmunicipality, with 4,073 persons per square mile, on 52 square miles of land. Islip and thePoospatuck Reservation each contained more than 3,000 persons per square mile; Huntingtonand Smithtown more than 2,000 persons per square mile; and Brookhaven more than 1,500persons per square mile. East Hampton, Riverhead, Shelter Island, Shinnecock Reservation,Southampton, and Southold each had less than 500 persons per square mile. Figure 3-20provides an overview of the same information.Figure 3-20Suffolk County Population Density by Municipality2000PopulationLand Area(Sq. Mi.)Density (Personsper Sq. Mi.)Town of Babylon 211,792 52 4,073Town of Brookhaven 448,248 259 1,731Town of East Hampton 19,719 74 266Town of Huntington 195,289 94 2,078Town of Islip 322,612 105 3,073Poospatuck Reservation 271 0.09 3,011Town of Riverhead 27,680 67 413Town of Shelter Island 2,228 12 186Shinnecock Reservation 504 1.31 385Town of Smithtown 115,715 54 2,143Town of Southampton 54,712 139 394Town of Southold 20,599 54 382Suffolk County 1,419,369 912 1,556Source: US Census (2000); figures are rounded estimatesPopulation Age DistributionThe median age of residents of the state of <strong>New</strong> <strong>York</strong> in the year 2000 was 35.9. In SuffolkCounty, the median age was similar, 36.5. In 2000, children under the age of 18 made up 26percent of the total population of Suffolk County and adults age 18 – 64 made up 62 percent.Older adults comprised 12 percent of the population of Suffolk County, although those resultswere somewhat skewed by outlying communities. Older adults were 29 percent of the totalpopulation on Shelter Island and 23 percent in the Town of Southold. Conversely, only sixpercent of the population of the Poospatuck Reservation was over the age of 65. Figure 3-21below provides greater detail.Page 3-17
Coordinated Public Transit-Human Services <strong>Transportation</strong> Plan for NYMTC Region • FinalN E W Y O R K M E T R O P O L I T A N T R A N S P O R T A T I O N C O U N C I L• L O N G I S L A N DFigure 3-21Suffolk County Age Distribution by MunicipalityUnder 18 18 - 64 65 and OverTown of BabylonPopulation 55,139 130,369 26,284Percentage 26% 62% 12%Town of BrookhavenPopulation 119,621 283,227 45,400Percentage 27% 63% 10%Town of East HamptonPopulation 4,188 12,260 3,271Percentage 21% 62% 17%Town of HuntingtonPopulation 49,719 120,060 25,510Percentage 25% 61% 13%Town of IslipPopulation 88,305 202,436 31,871Percentage 27% 63% 10%Poospatuck ReservationPopulation 99 156 16Percentage 37% 58% 6%Town of RiverheadPopulation 6,372 16,201 5,107Percentage 23% 59% 18%Town of Shelter IslandPopulation 404 1,186 638Percentage 18% 53% 29%Shinnecock ReservationPopulation 157 277 70Percentage 31% 55% 14%Town of SmithtownPopulation 30,091 70,072 15,552Percentage 26% 61% 13%Town of SouthamptonPopulation 11,565 34,064 9,083Percentage 21% 62% 17%Town of SoutholdPopulation 4,421 11,422 4,756Percentage 21% 55% 23%Suffolk CountyPopulation 370,081 881,730 167,558Percentage 26% 62% 12%Source: US Census (2000); figures are rounded estimatesPage 3-18
Coordinated Public Transit-Human Services <strong>Transportation</strong> Plan for NYMTC Region • FinalN E W Y O R K M E T R O P O L I T A N T R A N S P O R T A T I O N C O U N C I L• L O N G I S L A N DPopulation of Persons with DisabilitiesAs shown in Figure 3-22, there were 214,085 persons (15 percent) over the age of five with adisability in Suffolk County in the year 2000. In Babylon, Riverhead, and Shelter Island, morethan 18 percent of residents had a disability. Interestingly, Babylon and Shelter Island were alsothe municipalities with the highest and lowest densities (respectively) of persons with disabilities.In Babylon, there were 721 persons with disabilities per square mile. On Shelter Island, therewere only 43 persons with disabilities per square mile.Figure 3-22Percentage and Density of Persons with Disabilities inSuffolk County by MunicipalityLandArea(Sq. Mi.)2000PopulationTotalDisabilities(Age 5+)% ofPopulationDensity of Personswith DisabilitiesTown of Babylon 52 211,792 37,481 17.7% 721Town of Brookhaven 259 448,248 65,056 14.51% 232Town of East Hampton 74 19,719 3,716 18.84% 50Town of Huntington 94 195,289 23,475 12.02% 250Town of Islip 105 322,612 52,416 16.25% 499PoospatuckReservation 0.09 271 28 10.33% 311Town of Riverhead 67 27,680 5,335 19.27% 80Town of Shelter Island 12 2,228 520 23.34% 43ShinnecockReservation 1.31 504 70 13.89% 53Town of Smithtown 54 115,715 14,204 12.27% 263Town of Southampton 139 54,712 8,448 15.44% 61Town of Southold 54 20,599 3,336 16.99% 62Suffolk County 912 1,419,369 214,085 15.08% 235Source: US Census (2000); figures are rounded estimatesIncomeAt $86,993, median income in Suffolk County was significantly higher than both the state($51,384) and national ($48,451) medians for the year 2006. In 2000, median income wasslightly lower at $72,112, but still higher than both the state and national median incomes. In thatyear, only 15.28 percent of households in Suffolk County were considered to have low income,almost half the state figure of 30 percent. The percentage of low income households as a portionof the total population is extremely high on the Poospatuck and Shinnecock reservations; 61 and63 percent, respectively. Riverhead has the next highest share of low income households with26.21 percent. Between 20 and 25 percent of households in East Hampton, Southampton, andSouthold have low income. Huntington and Smithtown have the lowest percentage of lowincomepopulations in Suffolk County with 11.08 percent and 11.17 percent, respectively.Page 3-19
Coordinated Public Transit-Human Services <strong>Transportation</strong> Plan for NYMTC Region • FinalN E W Y O R K M E T R O P O L I T A N T R A N S P O R T A T I O N C O U N C I L• L O N G I S L A N DFigure 3-23 below provides detailed information on the percentage and density of low incomehouseholds in Suffolk County.Figure 3-23Percentage and Density of Low Income Households inSuffolk County by MunicipalityTotalHouseholdsLow IncomeHouseholds (< $25,000)% Low IncomeHouseholdsDensity of LowIncome HouseholdsTown of Babylon 69,026 11,765 17.04% 226Town of Brookhaven 146,904 22,305 15.18% 86Town of East Hampton 8,112 1,831 22.57% 25Town of Huntington 65,958 7,308 11.08% 78Town of Islip 98,973 14,511 14.66% 138Poospatuck Reservation 93 57 61.29% 633Town of Riverhead 10,773 2,824 26.21% 42Town of Shelter Island 997 213 21.36% 18Shinnecock Reservation 238 150 63.03% 115Town of Smithtown 38,503 4,302 11.17% 80Town of Southampton 21,482 4,394 20.45% 32Town of Southold 8,476 2,087 24.62% 39Suffolk County 469,535 71,747 15.28% 79Source: US Census (2000); figures are rounded estimatesEmploymentEmployment data estimated by occupation and industry for the year 2006, at the county level, isavailable from the US Census Bureau. In that year, there were 722,788 members of theworkforce living in Suffolk County. The majority of Suffolk County residents were employed ineither Management, Professional, and Related occupations (36 percent) or Sales and Officeoccupations (28 percent). Service occupations made up 16 percent of the workforce, whileoccupations in Construction, Extraction, and Maintenance and Production, <strong>Transportation</strong>, andMaterial Moving each made up another ten percent of the workforce in Suffolk County. Workersin Farming, Fishing, and Forestry made up less than one percent.By industry, the majority of the Suffolk County workforce, 24 percent, worked in Education,Health, and Social Services. The Retail sector had the second highest share, at 12 percent andProfessional, Scientific, Management, Administrative, and Waste Management Servicesindustries comprised 11 percent of professions. No other industry accounted for more than 10percent of employment of Suffolk County residents.Page 3-20