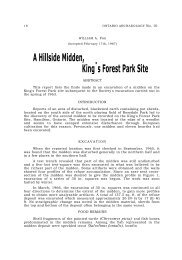
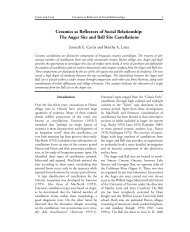
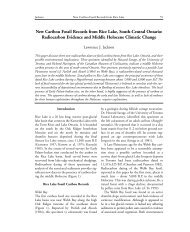
16 ONTARIO ARCHAEOLOGY NO.49FIGURE 3Calibrated pollen climate transfer curve for Michigan. Redrawn from Bernabo (1981).nabo, 1981), <strong>and</strong> Gignac Lake, <strong>Ontario</strong> (Burden etal., 1986) are sufficiently detailed to show smallclimatic fluctuations over the last 1,000 years (Fig.2). McAndrews <strong>and</strong> Boyko-Diakonow (in press)analyzed annually laminated sediments from CrawfordLake, in southern <strong>Ontario</strong>. <strong>The</strong> resulting recordextends back to AD 1000, at which time the pollenrecord is dominated by beech, maple, elm, oak <strong>and</strong>birch (Fig. 2). Hemlock is also common but itspaleoclimatic significance is unclear at this time.This mixed hardwood forest yields to a mixedpine-oak-birch forest ca AD 1400, a change whichMcAndrews <strong>and</strong> Boyko-Diakonow attribute in partto Indian clearing of the forest <strong>and</strong> to old fieldsuccession. After AD 1850, this forest in turn yieldsto European agricultural fields, which show up inthe diagram as a dramatic increase in grass <strong>and</strong>ragweed, <strong>and</strong> a decrease in oak <strong>and</strong> pine. However,beech is already in decline by AD 1200, well beforethe first appearance of maize pollen at CrawfordLake in AD 1360. This cannot be explained by theeffects of local Indian horticulture, as no other taxashow an appreciable decline at this time <strong>and</strong> herbpollen does not rise. Very large portions of thesurrounding region would have to have been affectedby man for pollen transport from long distancesto account for the changes in relativeimportance of the tree taxa. Of the five dominanttree types in the pre-1400 portion of the diagram,beech has the most southerly northern distributionlimit. It would therefore be expected to react firstto even a slight cooling of the climate. <strong>The</strong>re is littledoubt that the suddenness of the increase in oak <strong>and</strong>pine following the arrival of maize is due to forestclearance <strong>and</strong> field ab<strong>and</strong>onment (McAndrews <strong>and</strong>Boyko-Diakonow, in press). However, the failureof the forest to return to its previous beechdominatedassemblage following field ab<strong>and</strong>onmentmay be due either to ecological inertia or to aclimatic deterioration which occurred in the interim(McAndrews, 1988).<strong>The</strong> Gignac Lake diagram (Fig. 2) from AwendaProvincial Park, on the south shore of GeorgianBay, also shows the effect of Indian horticulture(Burden et al., 1986). Maize pollen appears in smallquantities in subzone 3d (the same zonation is usedin McAndrews <strong>and</strong> Boyko-Diakonow, in press).However, as with Crawford Lake, beech begins itsdecline prior to the subzone 3c/3d transition, whichrepresents the onset of local Indian horticulture.Bernabo (1981) does not discuss the possibleeffects of Indian horticulture in Michigan, but doesnote that "beech pollen undergoes a protracteddecline at each site from AD 1200 to 1600, generallyhitting its lowest levels about AD 1450" (Bernabo,1981). He further develops a calibrated pollenclimatetransfer function, <strong>and</strong> applies it to the fossilpollen data from the Marion, Heart, Jones <strong>and</strong>Twenty-seven Lakes sites (Fig. 3). <strong>The</strong> resultingpalaeotemperature curves are partially validated byinstrumental records from the early 1800s, <strong>and</strong> alsoby correlation with worldwide
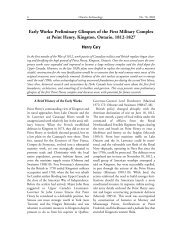
CAMPBELL & CAMPBELL: LITTLE ICE AGE 17FIGURE 4Number of <strong>Neutral</strong> sites with faunal analyses plotted through time.records of proxy data such as oxygen Isotope curvesfrom glacier ice-cores on Devon Isl<strong>and</strong>, <strong>and</strong> treeringdata from California. He concludes that "aprotracted <strong>Little</strong> <strong>Ice</strong> <strong>Age</strong> cooling took place after caAD 1200 <strong>and</strong> growing season temperatures reached1°C below the 1931-1960 mean in the 1700s." <strong>The</strong>correlation with other sites around the worldsuggests that the LIA was an essentiallysynchronous global phenomenon.Gajewski (1987) uses statistical methods to interpretthe palynology of seven lakes across the northeasternUnited States. He finds that a warm periodoccurred between AD 1000 <strong>and</strong> 1200, <strong>and</strong> a coolerperiod from AD 1450 to 1850, corresponding withLamb's (1977) dates for the LIA. For purposes ofour paper, the dates ca. AD 1450-1850 have beenadopted for the LIA; however, time lags in responseto changing conditions may have varied dependingon individual circumstances of site locations.Several authors use different dates for the LIA; this isto be expected since the change was gradual ratherthan abrupt.<strong>Neutral</strong> HorticultureDespite the growing number of plant macrofossilanalyses in <strong>Ontario</strong> (Crawford, 1987; Fecteau,1985; Ounjan, in prep.), the available data are noteasy to interpret beyond simply noting the presenceor absence of particular species. <strong>The</strong>re is little doubtthat corn, beans, <strong>and</strong> other cultigens were abundantafter at least AD 1350; the question is how importantwere they to the <strong>Neutral</strong> diet. It is difficult todetermine this from plant macrofossil data alone, asa change in the relative importance of horticulturalproduce need not affect the ratios in which thevarious crops were produced. <strong>The</strong> increase in thenumber of horticultural village sites through time(Fecteau 1985) suggests either an increased relianceon horticulture or, more likely, a populationincrease among horticulturalists. A correspondingincrease in the number of sites which have beenanalyzed for faunal material can be seen in the datapresented in this paper (Fig. 4).In the absence of any direct palaeoethnobotanicalindication of change in <strong>Neutral</strong> plant use over time,