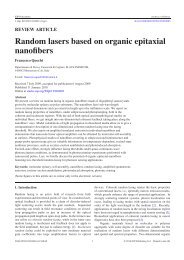
Light amplification in organic self-assembled nanoaggregates
Light amplification in organic self-assembled nanoaggregates
Light amplification in organic self-assembled nanoaggregates

Create successful ePaper yourself
Turn your PDF publications into a flip-book with our unique Google optimized e-Paper software.
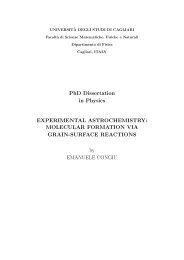
Università degli Studi di CagliariFacoltà di Scienze Matematiche, Fisiche e NaturaliDottorato di Ricerca <strong>in</strong> FisicaXVIII Ciclo (2002-2005)LIGHT AMPLIFICATION IN ORGANICSELF-ASSEMBLED NANOAGGREGATESFabrizio CordellaTutors:Prof. Giovanni BongiovanniProf. Andrea Mura
Contents1. Introduction and work plan..................................................................................................32. Organic semiconductors........................................................................................................72.1. Introduction......................................................................................................................72.2. Exited states <strong>in</strong> molecular crystals: the excitonic model.................................................92.2.1. The physical dimer...............................................................................................92.2.2. Molecular crystals..............................................................................................102.2.3. Transition dipole moments: H and J aggregates................................................122.3. <strong>Light</strong> emission properties of H aggregates.....................................................................142.3.1. Emission properties of herr<strong>in</strong>gbone molecular aggregates:a theoretical model.............................................................................................143. Self-<strong>assembled</strong> para-sexiphenyl nanofibers.......................................................................213.1. Para-sexiphenyl s<strong>in</strong>gle crystal.......................................................................................223.1.1. Optical transitions..............................................................................................233.2. Growth techniques of p-6P <strong>nanoaggregates</strong>...................................................................243.2.1. Organic Molecular Beam Epitaxy......................................................................243.2.2. Hot Wall Epitaxy................................................................................................263.3. The process of nanofiber <strong>self</strong>-assembl<strong>in</strong>g probed by atomic force microscopy............273.4. Dipole-assisted quasi-epitaxial growth..........................................................................293.5. Optical properties of <strong>self</strong>-<strong>assembled</strong> p-6P nanofibers...................................................343.5.1. Optical anisotropy..............................................................................................343.5.2. Optical waveguid<strong>in</strong>g..........................................................................................354. Experimental methods.........................................................................................................394.1. Atomic Force Microscopy..............................................................................................404.2. Spectrally- and spatially-resolved photolum<strong>in</strong>escence..................................................421
5. Random las<strong>in</strong>g and optical ga<strong>in</strong> <strong>in</strong> p-6P nanofibers.........................................................475.1. <strong>Light</strong> <strong>amplification</strong> <strong>in</strong> close-packed p-6P nanofibers....................................................485.1.1. Random las<strong>in</strong>g....................................................................................................485.1.2. Amplified Spontaneous Emission......................................................................525.1.3. Spatially-resolved las<strong>in</strong>g emission.....................................................................535.1.4. Film thickness dependence of optical response.................................................555.2. Bimolecular s<strong>in</strong>glet-s<strong>in</strong>glet annihilation process <strong>in</strong> p-6P aggregates............................575.3. <strong>Light</strong> <strong>amplification</strong> <strong>in</strong> s<strong>in</strong>gle p-6P nanofibers................................................................595.3.1. One dimensional random las<strong>in</strong>g.........................................................................605.3.2. Theoretical model for 1-D random las<strong>in</strong>g..........................................................655.3.3. Optical ga<strong>in</strong> <strong>in</strong> homogeneous nanofibers...........................................................676. Conclusions and outlook......................................................................................................756.1. Summary of the results...................................................................................................756.2. Potential application of <strong>self</strong>-<strong>assembled</strong> <strong>organic</strong> nanofibers...........................................776.2.1. Prospect for electrically pumped p-6P las<strong>in</strong>g.....................................................776.2.2. Nanofiber-based photonic sens<strong>in</strong>g.....................................................................796.3. Interplay among <strong>in</strong>termolecular excitonic coupl<strong>in</strong>g, exciton-phonon and excitonphoton<strong>in</strong>teractions <strong>in</strong> H-aggregates: an unresolved issue.............................................76Appendix B: Transfer matrix method......................................................................................81Acknowledgments.......................................................................................................................85Bibliography................................................................................................................................87Publications.................................................................................................................................932
CHAPTER 1INTRODUCTIONAND WORK PLANThe <strong>in</strong>terest <strong>in</strong> <strong>organic</strong> materials for optoelectronics and photonic applications hassignificantly <strong>in</strong>creased <strong>in</strong> recent years. Basic planar devices, like th<strong>in</strong>-film light emitt<strong>in</strong>g diodes,transistors, photovoltaic cells, lasers, and sensors have been successfully demonstrated. Amongthe emerg<strong>in</strong>g class of low-cost <strong>organic</strong> materials, conjugated oligomers are short, l<strong>in</strong>ear cha<strong>in</strong>molecules with the potential to form ordered assemblies with low trap densities and high carriermobility (up to ~ 20 cm 2 V -1 s -1 ) [1]. In many of such systems, charge transport jo<strong>in</strong>s withoutstand<strong>in</strong>g optical properties: a high absorption/emission cross section, an optical gap tunablefrom the ultraviolet to the visible, and a high emission quantum yield. <strong>Light</strong> <strong>amplification</strong> hasbeen observed <strong>in</strong> several oligomers [2], even though it is still uncerta<strong>in</strong> whether a suitablecomb<strong>in</strong>ation of transport and optical properties can lead to the realization of an all-<strong>organic</strong>electrically pumped laser.Conventional methods to grow molecular crystals can be considered as a k<strong>in</strong>d of <strong>self</strong>assembly,mediated by weak van der Waals <strong>in</strong>teractions [3]. In that way, macroscopic crystals<strong>in</strong> the centimeter length scale with atomic-scale order can be grown. Although of <strong>in</strong>terest for the3
<strong>Light</strong> <strong>amplification</strong> <strong>in</strong> <strong>organic</strong> <strong>self</strong>-<strong>assembled</strong> <strong>nanoaggregates</strong><strong>in</strong>vestigations of <strong>in</strong>tr<strong>in</strong>sic material properties, bulk systems are of limited importance for manyapplications, which require the use of flat th<strong>in</strong> films over macroscopic surfaces. In th<strong>in</strong> films,<strong>self</strong>-assembly is governed by a subtle competition between the weak <strong>in</strong>teractions amongmolecules and the <strong>in</strong>teraction with the substrate. The result<strong>in</strong>g dynamics of molecularaggregation is not only difficult to control, but also to predict, due to the <strong>in</strong>herent limitation ofcomputational methods to describe lattice configurations that may differ by as little as a fewkJ/mol. As a matter of fact, the considerable advancements made <strong>in</strong> recent years [4], have beendriven by empirical rules and material scientists’ <strong>in</strong>tuitions. Thanks to these efforts, crystall<strong>in</strong>efilm eng<strong>in</strong>eer<strong>in</strong>g typically permits to grow polycrystall<strong>in</strong>e specimens with doma<strong>in</strong>s <strong>in</strong> themicrometer scale. Microcrystall<strong>in</strong>ity is detrimental to the optical and transport performances. Inhigh quality films, mobility is actually limited by <strong>in</strong>ter-doma<strong>in</strong>s charge transport. From the po<strong>in</strong>tof view of the optical response, the high density of surface defects could result <strong>in</strong> the decreaseof the lum<strong>in</strong>escence efficiency, while large propagation losses arise from light scatter<strong>in</strong>g at thegra<strong>in</strong> doma<strong>in</strong> <strong>in</strong>terfaces [5].Recently, it has become clear that the assembly of <strong>organic</strong> films can be directed by specific<strong>in</strong>terface <strong>in</strong>teractions. In the last decade, a large number of <strong>organic</strong> molecules have been<strong>in</strong>vestigated for their ability to <strong>self</strong>-assemble <strong>in</strong> well-organized nanostructures that turned out tobe important for applications <strong>in</strong> photonics [6], optoelectronics [7] and chemical sens<strong>in</strong>g [8]. Themost studied light-emitt<strong>in</strong>g molecules for these purposes are oligomers of thiophene [9],phenylene [10], tetracene [11], and perylene-tetracarboxilic dianhydride aromatic r<strong>in</strong>gs [12].Deposition of oligophenyls and oligothiophenes on substrates featur<strong>in</strong>g strong surfacedipoles, such as mica and potassium chloride, has been shown to lead to <strong>self</strong>-assembly of highlyordered aggregates through the occurrence of a dipole <strong>in</strong>duced-dipole <strong>in</strong>teraction mechanism[13]. Needle-shaped aggregates are formed with lengths of up to 1 mm and cross-sectionaldimensions (widths and heights) of the order of 100 nm [13-15]. X-ray diffraction studies showa high degree of epitaxial alignment; the long molecular axes are nearly parallel to the substrateand perpendicular to the needle axis [16]. Upon substrate contam<strong>in</strong>ation and subsequentmodulation of the surface electric field, morphologically diverse <strong>nanoaggregates</strong> can beobta<strong>in</strong>ed, e.g., r<strong>in</strong>g-shaped structures (micror<strong>in</strong>gs) [17]. Nanoaggregates can be also transferredto other substrates more suitable for device fabrication. Encourag<strong>in</strong>g results along this directionhave been recently reported [18-20], which could allow one to imag<strong>in</strong>e mesoscale <strong>self</strong>-assemblyby us<strong>in</strong>g molecular aggregates as elementary bricks [21].L<strong>in</strong>ear <strong>nanoaggregates</strong> usually referred to as nanofibers, display a number of importantoptical properties, i.e., strong optical anisotropy, both <strong>in</strong> absorption and emission [14], opticalwaveguid<strong>in</strong>g <strong>in</strong> the visible spectrum [20,22,23], optical up-conversion [24], Raman ga<strong>in</strong>4
Chapter 1: Introduction and work plan<strong>amplification</strong> [25], nonl<strong>in</strong>ear spectral narrow<strong>in</strong>g [23,26]. Another basic photonic functionalitystill to explore is light <strong>amplification</strong>, which could further enlarge the horizon of the potentialapplications of <strong>self</strong>-<strong>assembled</strong> molecular <strong>nanoaggregates</strong> <strong>in</strong> photonics and optoelectronics.Organics are <strong>in</strong>deed excellent ga<strong>in</strong> media with emission cross section as high as 10 -15 cm 2 [27].Be<strong>in</strong>g one-dimensional <strong>self</strong>-<strong>assembled</strong> light waveguides, nanofibers actually appear ideal tosupport light <strong>amplification</strong> by stimulated emission radiation (LASER).As already stated by many Authors [28], the term "laser" represents, however, a too generalconcept to provide <strong>in</strong>sight on the complex and subtle nonl<strong>in</strong>ear optical <strong>in</strong>stabilities observed <strong>in</strong>nature when stimulated emission processes are <strong>in</strong>tr<strong>in</strong>sically l<strong>in</strong>ked to optical feedback. Inconventional lasers, this latter is provided by suitable distributed optical elements; the result<strong>in</strong>gprocess of light <strong>amplification</strong> differ considerably from the one observed <strong>in</strong> various ga<strong>in</strong> media,like <strong>in</strong><strong>organic</strong> semiconductor powders [29], rods [30] and needles [31], epitaxially grown<strong>in</strong><strong>organic</strong> semiconductor layers [32], dye <strong>in</strong>filtrated synthetic opals [33], biological tissues [34],high-ga<strong>in</strong> <strong>organic</strong> films based on polymers [33,35] and small molecules [36]. In these systemsrecurrent optical <strong>amplification</strong> is provided by random optical discont<strong>in</strong>uities of the system it<strong>self</strong>.The complex <strong>in</strong>terplay among stimulated light scatter<strong>in</strong>g, feedback and photon localization hasrecently been the subject of several theoretical and experimental studies [28,37]; coherent and<strong>in</strong>coherent random las<strong>in</strong>g are <strong>in</strong>trigu<strong>in</strong>g concepts <strong>in</strong>troduced to account for the different photonsstatistics <strong>in</strong> disordered systems. Incoherent random las<strong>in</strong>g could be thought as a generalizationof the notion of Amplified Spontaneous Emission (ASE), <strong>in</strong> presence of nonresonant feedback.In this thesis, we focus on the study of light <strong>amplification</strong> <strong>in</strong> para-sexiphenyl (p-6P)nanofibers. The process of <strong>self</strong>-assembl<strong>in</strong>g <strong>in</strong>troduces an <strong>in</strong>tr<strong>in</strong>sic degree of disorder, whichcauses light scatter<strong>in</strong>g and random feedback. We demonstrate the occurrence of “las<strong>in</strong>g”. Themajor experimental effort has been addressed to reveal coherent and <strong>in</strong>coherent random las<strong>in</strong>g,through a suitable control of nanofiber disorder, and to correlate the <strong>in</strong>herent optical response tothe aggregate morphology at the micron and submicron scales, us<strong>in</strong>g comb<strong>in</strong>ed optical andatomic force microscopy.5
<strong>Light</strong> <strong>amplification</strong> <strong>in</strong> <strong>organic</strong> <strong>self</strong>-<strong>assembled</strong> <strong>nanoaggregates</strong>The thesis is structured as follows:In chapter 2, we review the molecular exciton theory. Peculiarities of the emission properties ofmolecular aggregates are discussed.In chapter 3, we present the experimental techniques used to grow the p-6P samples studied <strong>in</strong>this work. Quasi-epitaxial growth of nanofibers on polar dielectric surfaces is discussed. Basicoptical emission properties of p-6P s<strong>in</strong>gle crystals and nanofibers are presented.In chapter 4, we briefly overview the atomic force microscope set-up used to study themorphological properties of p-6P nanofibers as well as the experimental set-up used <strong>in</strong>spectrally- and spatially- resolved photolum<strong>in</strong>escence and las<strong>in</strong>g measurements.In chapter 5, we present the experimental results of ensemble-averaged and spatially-resolvedphotolum<strong>in</strong>escence measurements on both close-packed and isolated nanofibers. Experimentalf<strong>in</strong>d<strong>in</strong>gs on random las<strong>in</strong>g and amplified spontaneous emission are discussed. The <strong>in</strong>fluence ofsample morphology on the optical response is experimentally <strong>in</strong>vestigated on the micrometerscale. The emission ga<strong>in</strong> cross section of p-6P nanofibers is assessed. A simple theoreticalapproach to model one-dimensional random waveguide light resonances <strong>in</strong> nanofibers ispresented.Chapter 6 is devoted to the summary of the results. Prospect applications of nanofibers <strong>in</strong>photonics and optoelectronics are outl<strong>in</strong>ed.6
CHAPTER 2ORGANIC MOLECULARSEMICONDUCTORS2.1. IntroductionThe name of <strong>organic</strong> semiconductors generally <strong>in</strong>dicates a wide class of materials,aggregates of carbon-based molecules of different length (oligomers and polymers). Theirelectronic and optical properties make them belong to the semiconductor category, but <strong>in</strong>sidethis class of materials an enormous multiplicity of behaviour exists, which is very difficult togeneralize.Molecular solids are composed of discrete molecules held together by weak van der Waalsforces; they are generally soft with low melt<strong>in</strong>g po<strong>in</strong>t and poor electrical conductivity. Becauseof the weak nature of the van der Waals bond<strong>in</strong>g, it is to be expected that the properties of thes<strong>in</strong>gle molecule are reta<strong>in</strong>ed <strong>in</strong> the solid state. This expectation is basically realized, eventhough the <strong>in</strong>termolecular <strong>in</strong>teractions <strong>in</strong> the crystal play an important role [38]. A study of theexcitonic and electronic properties of molecular semiconductors must therefore start with areview of the electronic properties of the <strong>in</strong>dividual molecules.7
<strong>Light</strong> <strong>amplification</strong> <strong>in</strong> <strong>organic</strong> <strong>self</strong>-<strong>assembled</strong> <strong>nanoaggregates</strong>The electronic ground state configuration of carbon atom is 1s 2 2s 2 2p 2 , with four electrons <strong>in</strong>the outer electronic levels; the two s electrons are paired and the two p electrons are unpaired.Another possible, but less stable, electronic configuration for the carbon atom can be generatedby mix<strong>in</strong>g the 2s and the 2p orbitals, creat<strong>in</strong>g a set of four equivalent degenerate orbitals, calledsp 3 hybrid orbitals. In this way, the carbon atom can make four tetrahedral bounds like <strong>in</strong>methane molecule. It is also possible that the 2s and two 2p orbitals (2p x and 2p y for example)comb<strong>in</strong>e to form three planar hybrid orbitals sp 2 . This type of hybridization is at the base of theelectronic and optical properties of <strong>organic</strong> semiconductors. The three sp 2 orbitals are coplanarand directed about 120º apart from each other; bonds formed by these orbitals are called σbonds. The 2p z orbital, unaltered by the hybridization, is perpendicular to the plane of the sp 2orbitals and can lead to the formation of the π-type bonds by overlapp<strong>in</strong>g the neighbour<strong>in</strong>g p zorbitals (Figure 2.1.a).(a)(b)Fig. 2.1. (a) Schematic representation of σ and π bonds between two carbon atoms. (b) Energy leveldiagram of the carbon atoms and of the formed molecule.The π bond establishes a delocalized electron density above and below the plane of the σbonds, with no electron density <strong>in</strong> the nodal plane, co<strong>in</strong>cid<strong>in</strong>g with the plane of the molecule.The degree to which the π-electrons cloud of one molecule is delocalized and <strong>in</strong>teracts with8
Chapter 2: Organic molecular semiconductorsthose of the neighbour molecules <strong>in</strong> the solid state represents a crucial problem to understandthe collective properties of the molecular crystals.In study<strong>in</strong>g the electronic properties of molecular solids, it will be sufficient to focus on theproperties of the π electrons. These latter <strong>in</strong>deed are <strong>in</strong> the highest-energy occupied orbitals(Figure 2.1.b) and therefore they are the most easily excitable.2.2. Exited states <strong>in</strong> molecular crystals: the excitonic model2.2.1. The physical dimerIn order to <strong>in</strong>troduce the molecular excitonic model, we first discuss a simpler system, thephysical dimer. This name is used to describe two identical molecules spatially close to eachother that do not form any chemical bond between themselves.The Hamiltonian operator for the physical dimer can be written as:H = H 1 + H 2 + V 12where H 1 is and H 2 are the Hamiltonian operators for the isolated molecules and V 12 is aperturbative term represent<strong>in</strong>g the <strong>in</strong>termolecular <strong>in</strong>teraction.Neglect<strong>in</strong>g the vibrational and sp<strong>in</strong> part, the ground state wavefunction of the dimer is:Ψ G = Ψ 1 Ψ 2where Ψ 1 and Ψ 2 are the ground state wavefunctions of the s<strong>in</strong>gle molecules.The solution of the Schröd<strong>in</strong>ger equation, <strong>in</strong> the first order perturbation theory, gives theground state energy of the dimer:E G = E 1 + E 2 + W with W = 〈Ψ 1 Ψ 2 ⎜V 12 ⎟Ψ 1 Ψ 2 〉where E 1 and E 2 are the ground state energies of the monomers and the last term W is thecoulombic b<strong>in</strong>d<strong>in</strong>g energy of the van der Waals <strong>in</strong>teraction for the pair, which is negative for thedimer and positive for the excimer.Because of the presence of term V 12 represent<strong>in</strong>g the <strong>in</strong>termolecular <strong>in</strong>teraction <strong>in</strong> theHamiltonian, the excitation energy is shared between the two molecules and the excited-statedimer wave function can be written as a l<strong>in</strong>ear comb<strong>in</strong>ation of the unperturbed states:Ψ E = c 1 Ψ ∗ ∗1 Ψ 2 + c 2 Ψ 1 Ψ 2where Ψ ∗ 1 and Ψ ∗ 2 are the equivalent excited states of the two identical molecules form<strong>in</strong>g thedimer. Solv<strong>in</strong>g the Schröd<strong>in</strong>ger equation for the excited stateH( c 1 Ψ ∗ 1 Ψ 2 + c 2 Ψ 1 Ψ ∗ 2 ) = Ε E (c 1 Ψ ∗ 1 Ψ 2 + c 2 Ψ 1 Ψ ∗ 2 )<strong>in</strong> the case of identical molecules (E * 1 = E * 2 ), the energies of the first excited states for thedimer can written as:9
<strong>Light</strong> <strong>amplification</strong> <strong>in</strong> <strong>organic</strong> <strong>self</strong>-<strong>assembled</strong> <strong>nanoaggregates</strong>E E (±) = E 1 * + E 2 + 〈Ψ 1 ∗ Ψ 2 ⎜V 12 ⎟Ψ 1 ∗ Ψ 2 〉 ± 〈Ψ 1 ∗ Ψ 2 ⎜V 12 ⎟Ψ 1 Ψ 2∗ 〉 = E 1 * + E 2 + W’ ± βThe term W’ is the coulombic energy of <strong>in</strong>teraction between the charge distribution of theexcited state of the molecule 1 and that of the ground state of the molecule two (or vice versa)and it leads to an energy shift relative to the monomer states. The last term β is the resonance<strong>in</strong>teraction energy term and it causes a splitt<strong>in</strong>g of the excited state <strong>in</strong> the dimer (Figure 2.2).The correspond<strong>in</strong>g wavefunctions for the first excited states are:Ψ Ε (±)=1 (Ψ1 ∗ Ψ 2 ± Ψ 1 Ψ 2 ∗ ).2Fig. 2.2. Splitt<strong>in</strong>g of the excited state of the dimer and energy shift relative to the monomer.The previous model has been strongly simplified by neglect<strong>in</strong>g the antisymmetrization ofthe wave functions required by the Pauli exclusion pr<strong>in</strong>ciple. This would have <strong>in</strong>troduced anexchange <strong>in</strong>teraction term that is negligible for s<strong>in</strong>glet sp<strong>in</strong> states but becomes very importantfor triplet sp<strong>in</strong> states [38,39].2.2.2. Molecular crystalsThe extension of the excited state model of the physical dimer to a molecular crystal doesnot <strong>in</strong>troduce particular difficulties. Neglect<strong>in</strong>g the vibrational and sp<strong>in</strong> part, the ground statewavefunction for a system composed by N identical non-<strong>in</strong>teract<strong>in</strong>g molecules is:ΨG=N∏n=1ψ0n10
Chapter 2: Organic molecular semiconductorsConsider<strong>in</strong>g only electrostatic <strong>in</strong>teractions, the Hamiltonian operator can be approximatedas the sum of the Hamiltonian of <strong>in</strong>dividual molecules H 0 and the term of <strong>in</strong>termolecular<strong>in</strong>teractions V between all the pairs of molecules <strong>in</strong> the solid:H = ∑ H n + ∑Vnm= H 0 + Vnn≠mThe model can be simplified consider<strong>in</strong>g a l<strong>in</strong>er unidimensional lattice with one moleculeper unit cell and impos<strong>in</strong>g periodic boundary conditions. The excited state wave function of thecrystal can be written as a l<strong>in</strong>ear comb<strong>in</strong>ation of the unperturbed states and the variationalpr<strong>in</strong>ciple allows to calculate the best possible coefficients of this comb<strong>in</strong>ation. If only thenearest-neighbours <strong>in</strong>teractions are considered, the exciton wavefunction with wavenumber k is:Ψk=1Nikld '∑eΨlN l=1where Ψ l ' are the unperturbed degenerate wavefunctions, d is lattice constant and thewavenumber k can takes the values 0, ±2π/Nd, ±4π/Nd,..., ±π/d. The eigenvalues correspond<strong>in</strong>gto these N states are:E(k) = E 0 + δω 0 + 2β cos(kd)where E 0 is the molecular electronic transition energy, β is the <strong>in</strong>teraction energy betweenneighbour<strong>in</strong>g molecules and can be positive or negative, and δω 0 = δε - δω is the energy shift(see Figure 2.3).Fig. 2.3. Energy level scheme illustrat<strong>in</strong>g the shifts of the ground and of the first excited states <strong>in</strong> thecrystal relative to the case of non <strong>in</strong>teract<strong>in</strong>g molecules (gas phase). The width of the exciton band 4⎢β⎟ is<strong>in</strong>dicated.11
<strong>Light</strong> <strong>amplification</strong> <strong>in</strong> <strong>organic</strong> <strong>self</strong>-<strong>assembled</strong> <strong>nanoaggregates</strong>The crystal excited-states described above are called Frenkel excitons or tight-b<strong>in</strong>d<strong>in</strong>gexcitons.In general, a given molecular energy level splits <strong>in</strong>to as many exciton bands as there are n<strong>in</strong>equivalent molecules per the unit cell. For example, if we consider a crystal with n = 2, thespectrum will be composed by two bands, each of one hav<strong>in</strong>g a k band states, as shown <strong>in</strong>Figure 2.4.Fig. 2.4. Splitt<strong>in</strong>g of the N-fold degenerate level <strong>in</strong>to two exciton bands, for a crystal with two<strong>in</strong>equivalent molecules per unit cell. The separation between the two bands at k=0 is def<strong>in</strong>ed as Davydovsplitt<strong>in</strong>g. With a and b is <strong>in</strong>dicated the different polarization of the transition from the ground state to thetwo Davydov bands.The separation between the two bands at k = 0 is called Davydov splitt<strong>in</strong>g and depends onthe <strong>in</strong>teraction between the translationally <strong>in</strong>equivalent molecules, whereas the k-dispersion ofeach band depends on the <strong>in</strong>teraction between equivalent molecules. The Davydov splitt<strong>in</strong>g fors<strong>in</strong>glet exciton can reach several thousand of cm -1 , while it is of the order of 10 cm -1 for tripletexcitons [38,39].2.2.3. Transition dipole moments: H and J aggregatesIn the model of the physical dimer, the resonance <strong>in</strong>teraction energy term β causes asplitt<strong>in</strong>g of the excited states. In the dipole-dipole approximation, this <strong>in</strong>teraction term can beexpressed, <strong>in</strong> the case of two molecules per unit cell, as a function of the transition dipolemoment of the isolated molecules, → µ 1 and → µ 2 :→ → → →⎛ ⎞⎛ ⎞→ → µ1⋅r µ2⋅rµ1⋅ µ⎜ ⎟⎜ ⎟2β = −⎝ ⎠⎝ ⎠3 5r r12
Chapter 2: Organic molecular semiconductorswhere→ris the position vector of the dipole of molecule 2 relatively to the molecule 1. The signof β depends on the mutual orientation of→ µ1and → µ2. The transition dipole moment of the tworesult<strong>in</strong>g Davydov components is given by the vector sum of <strong>in</strong>dividual transition moment:→M 1 →⎛ →⎜ 1 22 µ +⎝µ ⎞= ⎟ . We can dist<strong>in</strong>guish three different configuration depend<strong>in</strong>g to the relative⎠orientations of → µ 1 and 2respectively).µ → : a) Parallel; b) Head-to-tail; and c) Oblique (Figure 2.5 a, b and cIn the case of parallel transition dipole moments (Figure 2.5.a), the out-of-phaseconfiguration leads to an electronic attraction (β < 0), produc<strong>in</strong>g the E * + state. S<strong>in</strong>ce the dipolemoment M is null, the transition from the ground state to exciton state E * + is forbidden. The <strong>in</strong>phasearrangement causes repulsion (β > 0), giv<strong>in</strong>g the E * - state. In this case the dipole momentM is non-null and the transition from the ground state to exciton state E * - is dipole allowed.Therefore, for parallel dipole alignment, the lowest electronic transition is forbidden and theemission and absorption spectrum of the crystal is blue shifted with respect to the isolatedmolecules. Molecular solids that present this arrangement are called H aggregates.ParallelHead-to-tailObliqueE * E * +E * -E * -E * E * +E * -E * E * +E GV=0 V≠0(a)E GV=0 V≠0(b)E GV=0 V≠0(c)Fig. 2.5. Transitions from the ground state to the Davydov exciton bands for three different arrangementsof the molecular transition dipole moments: parallel (a), head-to-tail (b) and oblique (c). Orientation ofthe monomer dipole moments is represented by short arrows. Dipole-forbidden and allowed transitionsare depicted by dashed and cont<strong>in</strong>uous arrow respectively.When the transition dipole moments of the two molecules are arranged <strong>in</strong> the head-to-tailconfiguration (Figure 2.5.b), the <strong>in</strong>-phase orientation leads to the E * + state while the out-ofphasegives the E * - state. S<strong>in</strong>ce the dipole moment is non-vanish<strong>in</strong>g for the transition from the13
<strong>Light</strong> <strong>amplification</strong> <strong>in</strong> <strong>organic</strong> <strong>self</strong>-<strong>assembled</strong> <strong>nanoaggregates</strong>ground state to the E * + state and is null for the transition to E * - state, only the first excitonictransition is dipole allowed. Therefore, <strong>in</strong> this type of arrangement, the emission and absorptionspectrum of the crystal is red shifted with respect to the isolated molecules. Molecular solidswith this type of dipolar coupl<strong>in</strong>g are called J aggregates.In the third case of oblique transition dipole arrangement (Figure 2.5.c), the <strong>in</strong>-phaseorientation leads to the E * + state, while the out-of-phase gives the E * - state. In this case, thedipole moments for the electronic transition from the ground state to the Davydov bands areboth non-vanish<strong>in</strong>g. Therefore, both transitions are radiative.2.3. <strong>Light</strong> emission properties of H aggregatesMost of the conjugated oligomers relevant for optoelectronic applications (phenyls,thiophenes, phenylene-v<strong>in</strong>ylenes, and oligoacenes) crystallize <strong>in</strong> the so-called herr<strong>in</strong>gbone (HB)structure [40-43], <strong>in</strong> which the molecular dipoles are nearly parallel. Recent photolum<strong>in</strong>escencestudies performed on high quality s<strong>in</strong>gle crystals or films, illustrative of the <strong>in</strong>tr<strong>in</strong>sic opticalresponse of this class of compounds, show a weak pure excitonic transition, <strong>in</strong>tense vibronicbands, and quantum yields as high as several tens per cent [44-47].The follow<strong>in</strong>g paragraph is ma<strong>in</strong>ly devoted to the discussion of the fundamental radiativeemission properties of band-edge excitons <strong>in</strong> prototypical HB aggregates.2.3.1. Emission properties of herr<strong>in</strong>gbone molecular aggregates: atheoretical modelIn the last few years, F.C. Spano developed the theory on the optical properties of p<strong>in</strong>wheelaggregates (Figure 2.6.c), which are precursors of the herr<strong>in</strong>gbone lattice [48-51].The model studies the absorption and emission properties of a simplified square latticeM×M, with N = M 2 molecules of p-distyrylbenzene (DSB) <strong>in</strong> the positions (n x , n y ), (n x , n y =0,1,2,....,M-1), with lattice constant d, <strong>in</strong> the chiral and achiral configurations (Figure 1.6 d andc). The molecules are supposed to have only two states: the ground state 1 1 A g and the excitedstate 1 1 B u with electronic transition frequency ω 0-0 . This transition is coupled l<strong>in</strong>early to an<strong>in</strong>tramolecular and totally symmetric vibrational mode at frequency ω 0 . The 1 1 A g and 1 1 B unuclear potentials for a given molecule are assumed harmonic, with the same curvature but withthe m<strong>in</strong>ima shifted. The vibrational state of the electronic ground state are represented as:g m , m ,..., , , with energy h ω0m→, where m → is the number of vibrational;( 0,0) (1,0)m(M − 1, M −1)→∑nnn14
Chapter 2: Organic molecular semiconductorsquanta of the molecule→nandg is the electronic part of the ground state of the aggregate, <strong>in</strong>which all the molecules are <strong>in</strong> the state 1 A .gFig. 2.6. (a): DSB molecular structure with two possible orientations of the transition dipole moment. (b):Component of the transition dipole moments <strong>in</strong> the herr<strong>in</strong>gbone plane (x-y plane) for the two orientationof the molecule. (c): Perpendicular components of the transition dipole moment <strong>in</strong> a 2×2 p<strong>in</strong>wheel chiralaggregate. (d): 4×4 chiral type aggregate. (e): 4×4 achiral type aggregate [49].The Hamiltonian for such a system can be written as:∑ ∑ ∑∑+ +2H = ω b→b→+ ωλ ( b→+ b→)n n + J m n + ω + D+λω0 0 mn0−0r n nr n n→ →nnm nwhere ħ = 1 is taken; b +→ (b → ) is the creation (annihilation) operator for the <strong>in</strong>tramolecularnn→ → → →0→nvibrational mode on the molecule ;→nis the pure electronic state <strong>in</strong> which the molecule <strong>in</strong>→nthe site is <strong>in</strong> the excited state 11 B u , while all the others are <strong>in</strong> the ground state; D is the energyshift <strong>in</strong>duced by the van der Waals <strong>in</strong>teraction with the neighbour<strong>in</strong>g molecules <strong>in</strong> theaggregates; λ 2 is the Huang-Rhys factor, that accounts for the electro-vibrational coupl<strong>in</strong>g; J mnis the excitonic coupl<strong>in</strong>g between the molecules <strong>in</strong> the sites m →and →n .The eigenstates of H, giv<strong>in</strong>g the α-th vibrationally dressed exciton with wave vectorbe written as:→1k N −→→→2ik⋅nα ; kα; n e G G C l%, l ,..., l→n→= ∑ ∑ %n xn yx yl%, l(0,0) (1,0),...l, l(0,0) (1,0),...(0,0) (1,0) ( M−1, M−1)→k, can15
<strong>Light</strong> <strong>amplification</strong> <strong>in</strong> <strong>organic</strong> <strong>self</strong>-<strong>assembled</strong> <strong>nanoaggregates</strong>where % ( l → ) is the number of vibrational quanta <strong>in</strong> the excited (ground) state of the moleculel→n→n( n )n x<strong>in</strong> the site ; G e are the shift operator that moves the vibrational excitation to the rightn xxG yby units and up of units, respectively.→xn ,n yn yThe dipole moment operator for the transition 1 1 A g → 1 1 B u can be written as:12→ → → →⎧→⎫µ = ∑ ( µ → i + µ → j+ µ||k)⎨ g n + h. c.⎬→ xn , yn ,⎩⎭nnx+ny1nx+nyµ =± µ (1 + ( −1) ) and µ → =± µ (1 −( − 1) ) are the x and y components of the⊥yn ,transition dipole moment of the molecule <strong>in</strong> the site2⊥, where the ± sign <strong>in</strong>dicates the molecularorientation, and µ ⊥ and µ ║ are the components perpendicular and parallel to the long molecularaxis, respectively.Accord<strong>in</strong>g to the Kasha rule, the exciton recomb<strong>in</strong>ation takes place from the bottom of the→nexciton band, that is from the state α ; → k ( π d, π d)0 =0to the p-th vibrational state of theelectronic ground state, with transition energy ω .The fluorescence spectrum can be written as:SFα⎛ pω⎞0( ω)= ∑ I ⎜p 1 − ⎟ W ( ω −ωα− pω0)0p 0,1,2,...ω= ⎝ α0⎠where W ω − ωα − p ) is a symmetric l<strong>in</strong>e shape function represent<strong>in</strong>g homogeneous and( ω0 03<strong>in</strong>homogeneous broaden<strong>in</strong>g, andI pis the dimensionless <strong>in</strong>tensities of the 0-p transition:Ip1→ →= α0 ; k k g; m(0,0) ,(0,1),...µ∑ m'2|| m(0,0) , m(0,1),...2∑When the excitonic coupl<strong>in</strong>g is weak compared to the vibrational frequencyn + n( )m−n0x y; k( −1 J )
Chapter 2: Organic molecular semiconductorsThe previous equation shows that, <strong>in</strong> the free exciton limit ( λ = 0), the lowest excitonband is non emissive if µ ⊥ = 0 . The 0-0 transition (p = 0) is allowed only when µ ⊥ ≠ 0 , and ispolarized entirely <strong>in</strong> the x-y plane. Conversely, the vibronic replicas (p ≠ 0) are present <strong>in</strong> theemission spectrum if λ 2 ≠ 0, are configuration <strong>in</strong>dependent and are polarized primarily along the2 2||z axis (for µ > µ ⊥ ).The <strong>in</strong>tensity of the emission for the pure electronic transition can be written <strong>in</strong> a moregeneral form as:IF⎧⎪= ⎨∑µ + ∑µr⎪ n⎩0 2Nµ||2 2→→xn , r yn ,n0 ; k ( , )where F 0 l C α →= %∑= π π% is the generalized Franck-Condon factor, which ranges froml%(0,0)0,0 l(0,0),0,0,...2⎫⎪⎬⎭⎪22−λe <strong>in</strong> the weak exciton-phonon coupl<strong>in</strong>g to 1 <strong>in</strong> the strong coupl<strong>in</strong>g regime. I0is vanish<strong>in</strong>gfor the chiral type aggregates (fig.2.6.d), where the transition dipole moments <strong>in</strong>terferedestructively, while reach the maximum value2NF µ ⊥<strong>in</strong> the achiral type (fig.2.6.e), where the2µ2||x and y components of the transition dipole moments add <strong>in</strong> phase.Figure 1.7 shows how the <strong>in</strong>tensity of the 0-0 transition for achiral-type ( Ip≠0p≠0B0) aggregate andBAof the vibronic replicas for achiral ( ∑ I0) and chiral ( ∑ I0) aggregates changes with theexcitonic coupl<strong>in</strong>g strength [49].BI0<strong>in</strong>creases with ris<strong>in</strong>g of the excitonic coupl<strong>in</strong>g, whereas the <strong>in</strong>tensity of the vibronicreplicas is configuration <strong>in</strong>dependent and dim<strong>in</strong>ishes with <strong>in</strong>creas<strong>in</strong>g excitonic coupl<strong>in</strong>g.B0Unlike I , the <strong>in</strong>tensity of the vibron transitions is not enhanced by N.An <strong>in</strong>crease of coupl<strong>in</strong>g reduces the nuclear displacement of the emitt<strong>in</strong>g state therebyreduc<strong>in</strong>g the effective aggregate Huang-Rhys factor λ 2 . In this case, the 0-0 transition isfavoured with respect to the vibronic replicas but, on the other hand, it is weakly dipole allowedonly if µ ⊥ ≠ 0 . This effect leads to a decrease of the radiative decay rate and therefore to areduction of the lum<strong>in</strong>escence quantum yield of the crystal respect to that of the isolatedmolecules.17
<strong>Light</strong> <strong>amplification</strong> <strong>in</strong> <strong>organic</strong> <strong>self</strong>-<strong>assembled</strong> <strong>nanoaggregates</strong>BFig. 2.7. Intensity of the 0-0 transition <strong>in</strong> 4×4 achiral-type aggregate ( I 0) and of the vibronic replicas forBachiral ( ∑ I ) and chiral ( 0 ∑ I0p≠0p≠0A) aggregates as a function of excitonic coupl<strong>in</strong>g f. For each f theexcitonic coupl<strong>in</strong>gs are given J mn (f) = f J mn , where the (orientationally averaged) J mn are calculated forDSB aggregates with d = 4.8 Å [49]. The grey marked region <strong>in</strong>dicates our estimated f based onexperimental results on crystall<strong>in</strong>e p-6P.In the low exciton coupl<strong>in</strong>g regime, the emission of the herr<strong>in</strong>gbone aggregate is dom<strong>in</strong>atedby the vibronic progression while the pure electronic transition is weakly present or null ifµ ⊥ = 0 . In this case the lum<strong>in</strong>escence quantum yield of the crystal approximates the one of theisolated molecule. In general, however, any type of site defect could make the 0-0 emissionallowed also <strong>in</strong> the chiral-type aggregate [50].Comparison with experimental results confirms the conclusion of the theoretical model.Figure 2.8 shows the emission spectrum of DSB film as well as the calculated fluorescencespectrum averaged over uniform random distribution of molecular orientation <strong>in</strong> a 4×4aggregate [36]. The weak 0-0 band is found to be polarized <strong>in</strong> the aggregate x-y plane, while thestrong vibronic progression is predom<strong>in</strong>antly z-polarized. The <strong>in</strong>tensity of the 0-0 peak is foundto be variable because it depends on the distribution of molecular orientations. Thedisappearance of the pure electronic transition <strong>in</strong> some samples may simply due to thepreponderance of chiral-type aggregates <strong>in</strong> which the x-y dipole moment vanishes.18
Chapter 2: Organic molecular semiconductors0-10-20-30-0Fig. 2.8. Comparison of the experimental DSB fluorescence (filled circles) taken at 20 K with thecalculated fluorescence (solid curve), us<strong>in</strong>g µ ⊥ µ // = 0.11 [49].19
<strong>Light</strong> <strong>amplification</strong> <strong>in</strong> <strong>organic</strong> <strong>self</strong>-<strong>assembled</strong> <strong>nanoaggregates</strong>20
CHAPTER 3SELFASSEMBLEDPARA-SEXIPHENYL NANOFIBERSThe samples <strong>in</strong>vestigated <strong>in</strong> this thesis are films of <strong>self</strong>-<strong>assembled</strong> nanofibers of parasexiphenylmolecules, grown on freshly cleaved muscovite mica substrates by both OMBD andHWE techniques. In this section, we review the properties of both the p-6P molecule andcrystal, as well as the process of <strong>self</strong>-assembl<strong>in</strong>g of p-6P to form crystall<strong>in</strong>e nanostructures.21
<strong>Light</strong> <strong>amplification</strong> <strong>in</strong> <strong>organic</strong> <strong>self</strong>-<strong>assembled</strong> <strong>nanoaggregates</strong>3.1. Para-sexiphenyl s<strong>in</strong>gle crystalPara-sexiphenyl (C 36 H 26 ) is an aromatic l<strong>in</strong>ear cha<strong>in</strong> molecule consist<strong>in</strong>g of six benzener<strong>in</strong>gs (Figure 3.1). The oligomer is thermally stable up to 300-400 °C and can be synthesisedwith high grade of purity. Crystals of p-6P molecules are classified as p-type semiconductorswith remarkable optical and electronic properties, among which, a bright photolum<strong>in</strong>escence(photolum<strong>in</strong>escence quantum yield is ~ 30%) [44-47] <strong>in</strong> the blue visible range and a high holemobility (field effect mobility ~ 10 -1 cm 2 V -1 s -1 ) [52].Fig. 3.1: Para-sexiphenyl (p-6P) molecule.Para-sexiphenyl usually crystallizes <strong>in</strong> the β-phase, which has a monocl<strong>in</strong>ic unit cellbelong<strong>in</strong>g to the space group P2 1 /a, with lattice constants of a = 8.091 Å, b = 5.565 Å, c =26.264 Å, a monocl<strong>in</strong>ic angle β = 98.17° (Figure 3.2 a) [53]. The unit cell conta<strong>in</strong>s twomolecules.(a)(b)ab(c)cFig. 3.2. (a): Monocl<strong>in</strong>ic unit cell of crystall<strong>in</strong>e p-6P; a,b and c are the lattice constants. (b): Arrangementof the p-6P molecules with<strong>in</strong> the β structure; molecules form layers with thickness of 25.97 Å. (c):Projection of the molecules along their long axis show<strong>in</strong>g the herr<strong>in</strong>gbone structure with<strong>in</strong> each layer[10].In the crystal, p-6P molecules are organized <strong>in</strong> layers with thickness of 25.97 Å (Figure 3.2b). The long molecular axes are aligned form<strong>in</strong>g an angle of 73° with respect to the layer basalplane. At room temperature, the average conformation of p-6P molecules is planar [10]. Figure3.2 (c) shows the projection of the molecular planes on a s<strong>in</strong>gle layer. Nearby molecular planesare tilted by about 66° each other, form<strong>in</strong>g the typical herr<strong>in</strong>gbone structure.22
Chapter 3: Self <strong>assembled</strong> para-sexiphenyl nanofibers3.1.1 Optical transitionsPara-sexiphenyl crystals form a herr<strong>in</strong>gbone-type H aggregate with two translationally<strong>in</strong>equivalent molecules per unit cell. Accord<strong>in</strong>g to Davydov's theory (§ 2.2.2), the lowestunoccupied orbital of the p-6P molecule gives rise to two exciton states at the centre of theBrillou<strong>in</strong> zone (fig. 3.3). Tak<strong>in</strong>g <strong>in</strong>to account that the component of the molecular transitiondipole <strong>in</strong> the herr<strong>in</strong>gbone plane is null ( µ ⊥ = 0 ), the simple radiative annihilation of the lowestDavydov exciton is dipole-forbidden. However, the exciton decay with simultaneous creation ofground-state C=C stretch<strong>in</strong>g phonons is allowed and polarized along the long molecular axis ofthe p-6P molecule (§ 2.3.1).Fig. 3.3: Exciton levels energy scheme of the p-6P free molecule and crystal, with the lowest forbidden(0-0) and allowed (0-1, 0-2, 0-3) optical transitions. The arrows on the right of the exciton bands <strong>in</strong>dicatethe orientation of the molecular dipole moments for the transition to the ground state.The absorption and emission spectra of a polycrystall<strong>in</strong>e p-6P film deposited on glasssubstrate are shown <strong>in</strong> Figure 3.4 [54]. Due to the presence of structural defects, the pureelectronic transition (0-0) is detected <strong>in</strong> the emission spectrum, even though much weaker thanthe vibronic replicas (0-1, 0-2, 0-3). The photolum<strong>in</strong>escence quantum yield is as high as 30 %[44-47], suggest<strong>in</strong>g that excitons are <strong>in</strong> the weak coupl<strong>in</strong>g regime, <strong>in</strong> which the light emissionefficiency of the crystal approaches that of the isolated molecule (see Figure 2.7, § 2.3.1).23
<strong>Light</strong> <strong>amplification</strong> <strong>in</strong> <strong>organic</strong> <strong>self</strong>-<strong>assembled</strong> <strong>nanoaggregates</strong>0-10-20-30-0Fig. 3.4: Absorption and emission spectra of p-6P deposited on glass substrate [54].F<strong>in</strong>ally, it is worth stress<strong>in</strong>g that the forbidden nature of the 0-0 transition leads to a largeStokes-shift between the lowest absorption band and the lum<strong>in</strong>escence spectrum. Such opticalresponse of near-gap excitations is peculiar of H-aggregates and permits to reduce thereabsorption of the light emitted by the crystal, and thus, to lower las<strong>in</strong>g threshold.3.2. Growth techniques of p-6P <strong>nanoaggregates</strong>Th<strong>in</strong> films of p-6P are prepared by physical vapour deposition (PVD) <strong>in</strong> high vacuum (HV)and ultra high vacuum (UHV). The high thermal stability of the molecules allows thesublimation by thermal evaporation without any dissociation of the molecules. Two differentPVD techniques are employed to grow the samples studied <strong>in</strong> this thesis: Organic MolecularBeam Epitaxy (OMBE) has been used by the group of Prof. H.G. Rubahn (University ofOdense, Denmark), and Hot Wall Epitaxy (HWE) by the group of Prof. H. Sitter, (University ofL<strong>in</strong>z, Austria). In both techniques, the p-6P films are grown on muscovite mica substrates.3.2.1. Organic Molecular Beam EpitaxyFigure 3.5 shows a schematic representation of the MBE apparatus. Th<strong>in</strong> sheets of mica(thickness ~ 120µm) are cleaved <strong>in</strong> air and transferred immediately after cleavage <strong>in</strong>to a highvacuum transfer chamber (p ≈ 10 -7 mbar). A second high vacuum chamber (p ≈ 10 -8 mbar) isused for the deposition process only. The substrates are mounted on a copper plate which allowshomogeneous heat<strong>in</strong>g via a tungsten filament, and are carefully outgassed for an hour at atemperature of ~ 400K before the <strong>organic</strong> material is deposited. Para-sexiphenyl molecules aredeposited at temperature above 600K by vacuum sublimation from a Knudsen cell type oven(nozzle diameter 0.5 mm and pressure dur<strong>in</strong>g the deposition ≈ 2×10 -7 mbar) with depositionrates of (0.1 - 0.3) Å/s, and at a substrate temperature of (350-360) K. A water-cooled quartzmicrobalance system (QMS) allows to measure the deposition rate and the nom<strong>in</strong>al thickness ofthe deposited film.24
Chapter 3: Self <strong>assembled</strong> para-sexiphenyl nanofibersFig. 3.5: MBE apparatus used for epitaxy-growth of p-6P films. It is constituted by three differentsections: (i) magnetically coupled transfer unit; (ii) deposition chamber (MBE) <strong>in</strong>clud<strong>in</strong>g the Knudsensublimation cell and a quartz microbalance system (QMS); (iii) characterization section equipped with amulti-channel-plate low-energy electron diffraction apparatus (MCP-LEED). Pressure <strong>in</strong>side each unit is<strong>in</strong>dicated.The third section of the MBE apparatus is the characterization unit <strong>in</strong> UHV (p ≈ 10 -10 mbar),equipped with a multi-channel-plate low-energy electron diffraction system (MCP-LEED,Omicron). Here, the crystall<strong>in</strong>ity of the nanostructure grown on the substrate are checked. Us<strong>in</strong>ga very low electron flux (100 pA mm -2 ), beam damage as well as charg<strong>in</strong>g of the surface isavoided.Para-sexiphenyl molecules deposited on mica substrate form mutually parallel l<strong>in</strong>earaggregates, with submicron-sized width and height, and length up to one millimeter. LEED,absorption and photolum<strong>in</strong>escence measurements showed that the aggregates grow nearlyperpendicular to the direction of the long molecular axis of p-6P molecules deposited on thesubstrate [55]. The dimensions and the mutual distances between nanostructures dependstrongly on the deposition rate and substrate temperature. Only at low deposition rates between0.025 and 0.5 Å/s and <strong>in</strong> a narrow substrate temperature range ∆T ≈ 25 K around 400 K,formation of long nanofibers occurs [56]. At lower substrate temperatures, fibers tend tobecome shorter and more densely packed, whereas at higher temperatures only small islands ofp-6P have been observed [13]. This allows to locally <strong>in</strong>duce or avoid needle growth via laser<strong>in</strong>ducedsurface heat<strong>in</strong>g. The length of the nanofibers and their mutual distances has beencontrolled focus<strong>in</strong>g an argon ion laser beam onto the mica substrate dur<strong>in</strong>g the film growth [57].With this laser-controlled growth, long and well-isolated nanofibers, like those shown <strong>in</strong> theepifluorescence micrograph <strong>in</strong> Figure 3.6, have been obta<strong>in</strong>ed.25
<strong>Light</strong> <strong>amplification</strong> <strong>in</strong> <strong>organic</strong> <strong>self</strong>-<strong>assembled</strong> <strong>nanoaggregates</strong>Fig. 3.6. 290×220 µm 2 epifluorescence image of well-isolated emitt<strong>in</strong>g p-6P nanofibers.3.2.2. Hot Wall EpitaxyThe second technique used to grow the p-6P nanofibers films studied <strong>in</strong> this thesis is theHWE. In contrast to other sublimation techniques like MBE, HWE allows to grow epitaxiallayers close to the thermodynamic equilibrium, which is very important <strong>in</strong> the case of van derWaals epitaxy of <strong>organic</strong> compounds. Consequently, the <strong>organic</strong> molecules can f<strong>in</strong>denergetically the most suitable arrangement before be<strong>in</strong>g <strong>in</strong>corporated <strong>in</strong>to the crystal lattice,result<strong>in</strong>g <strong>in</strong> highly ordered structures on the deposited <strong>organic</strong> layer [58]. Figure 3.7 shows theschematic representation of the HWE apparatus used to grow the p-6P films. The system issimpler than the MBE apparatus and needs only HV technology (p ~ 10 -6 mbar). It consists of asublimation quartz ampoule, at the bottom of which the p-6P molecules, that have to beevaporated, are placed. Six separated heaters (source and wall ovens) allow <strong>in</strong>dependenttemperature adjustments <strong>in</strong> the different regions of the evaporation quartz tube. This guaranteesa nearly uniform and isotropic flux <strong>in</strong>tensity and k<strong>in</strong>etic energy of the molecules. This isopposite to MBE technique, where the films are deposited by means of a uniaxial flux ofmolecules. The substrate is placed close to the ampoule end (at a distance of 5 mm) and can beheated <strong>in</strong>dependently dur<strong>in</strong>g the growth process. Para-sexiphenyl molecules are evaporated attemperature above 600K and deposited on freshly cleaved mica substrate, with pressure dur<strong>in</strong>gthe growth ≈ 6×10 -6 mbar and deposition rates of 0.3 Å/s. The wall temperature was usually <strong>in</strong>the range of 350-500 K, and the substrate temperature 400 K. As <strong>in</strong> MBE, the substratetemperature dur<strong>in</strong>g evaporation and the deposition rate are fundamental parameters formolecular pack<strong>in</strong>g <strong>in</strong> the solid-state structures. At the growth conditions listed above, p-6Pmolecules form mutually parallel l<strong>in</strong>ear aggregates, with width and height of ~ 200 and ~ 100nm respectively, and length of several hundred micrometers.26
Chapter 3: Self <strong>assembled</strong> para-sexiphenyl nanofibersFig. 3.7. Schematic cross section of Hot Wall Epitaxy system. PHP are the para-hexaphenyl molecules.3.3. The process of nanofiber <strong>self</strong>-assembl<strong>in</strong>g probed by atomic forcemicroscopy.The formation process of p-6P nanofibers has been studied by <strong>in</strong>vestigat<strong>in</strong>g the morphologyof films prepared by HWE with different deposition times. Surface topography has beendeterm<strong>in</strong>ed by atomic force microscopy (AFM) [59]. Figure 3.8 shows the AFM surfacemorphology of p-6P films on mica substrates, prepared with <strong>in</strong>creas<strong>in</strong>g growth time <strong>in</strong> the rangefrom 10 sec to 120 m<strong>in</strong> and with a surface temperature of 400 K. As depicted <strong>in</strong> Figure 3.8 (a),only small uniformly distributed islands can be detected for the sample grown with depositiontime of 10 seconds. Increas<strong>in</strong>g the growth time up to 25 sec, the surface morphology changesdrastically. When a critical density of islands is reached, a rearrangement of islands occursresult<strong>in</strong>g <strong>in</strong> <strong>self</strong>-organized nanofibers with micrometer length (Figure 3.8 b). As shown <strong>in</strong>Figure 3.8 b-f, with a further <strong>in</strong>crease of deposition time, these fibers become progressivelylonger, quickly reach<strong>in</strong>g a fixed asymptotic width [58]. At least after 5 m<strong>in</strong> of growth, nearly nosmall island could be found on the surface (Figure 3.8 d), while the fibers become closer to eachother.27
<strong>Light</strong> <strong>amplification</strong> <strong>in</strong> <strong>organic</strong> <strong>self</strong>-<strong>assembled</strong> <strong>nanoaggregates</strong>(a) (b) (c)(d) (e) (f)Fig. 3.8. AFM topography images of the p-6P films grown on mica substrates with a deposition time of:a) 10 sec; b) 25 sec; c) 90 sec; d) 5 m<strong>in</strong>; e) 40 m<strong>in</strong>; f) 120 m<strong>in</strong>. Substrate temperature was 400 K. Z-scaleis 0-50 nm <strong>in</strong> (a)-(c), 0-100 nm <strong>in</strong> (d), 0-220 nm <strong>in</strong> (e) and 0-700 nm <strong>in</strong> (f) [59].Figure 3.9 shows a high resolution 3D-AFM image of a s<strong>in</strong>gle p-6P nanofiber surroundedby small p-6P islands <strong>in</strong> the most <strong>in</strong>terest<strong>in</strong>g <strong>in</strong>termediate growth stage, where islands and fiberscoexist. The image clearly reveals that the roughly 850 nm long, 15 nm high and 75 nm widefiber is not homogenous and consists of about 15 small blocks with approximately the same sizeas free stand<strong>in</strong>g p-6P islands. This result <strong>in</strong>dicates that <strong>self</strong>-organized fibers on mica are formedby regroup<strong>in</strong>g of mobile <strong>in</strong>dividual islands/crystallites orig<strong>in</strong>at<strong>in</strong>g <strong>in</strong> earlier growth stages. Thisthesis is well supported by the observation (us<strong>in</strong>g dark-field electron microscopy) of differentcrystall<strong>in</strong>e p-6P doma<strong>in</strong>s with<strong>in</strong> long p-6P nanofibers [60]. As evident from Figures 3.8 b-f,from the very beg<strong>in</strong>n<strong>in</strong>g all needles are strictly parallel to each other, hav<strong>in</strong>g the samepreferential orientation relative to the substrate.The nucleation process described above is made on p-6P films grown by HWE. Analogueresults have been found for samples prepared with OMBE so we can conclude that themechanism of p-6P nanofibers formation based on the nucleation process has general validity.28
Chapter 3: Self <strong>assembled</strong> para-sexiphenyl nanofibersFig. 3.9. High resolution three-dimensional AFM image show<strong>in</strong>g <strong>in</strong>dividual p-6P islands as well as as<strong>in</strong>gle nanofiber [59].3.4. Dipole-assisted quasi-epitaxial growthThe p-6P nanostructure formation and the alignment processes are not fully understood yet.Recent works have been shown that quasi-epitaxial growth mediated by dipole <strong>in</strong>duced-dipole<strong>in</strong>teraction is probably responsible for the growth of the p-6P nanofibers on polar surfaces suchas that of cleaved muscovite mica.Fig. 3.10. Crystal structure of muscovite mica K 2 Al 4 [Si 6 Al 2 O 20 ](OH) 4 .Muscovite mica (K 2 Al 4 [Si 6 Al 2 O 20 ](OH) 4 ) is a sheet silicate, consist<strong>in</strong>g of octahedral Al-Olayers sandwiched between two tetrahedral Si-O layers [61], as shown <strong>in</strong> Figure 3.10. In the29
<strong>Light</strong> <strong>amplification</strong> <strong>in</strong> <strong>organic</strong> <strong>self</strong>-<strong>assembled</strong> <strong>nanoaggregates</strong>tetrahedron layers 1/4 of the Si 4+ cations are replaced by an Al 3+ . The negatively charged layerpackages Al 2 (OH) 2 [AlSi 3 O 10 ] are held together by layers of K + cations. Cleavage occurs alongthese <strong>in</strong>terlayer cations (each cleavage face with half of the K + ions), which is identical with thecrystallographic (001) plane of muscovite mica.The mica unit cell is monocl<strong>in</strong>ic with lattice constants of a = 5.20 Å, b = 9.03 Å, c = 20.11Å, and monocl<strong>in</strong>ic angle of β = 95.78°. Transmission electron diffraction and X-ray diffractionstudies revealed that there are three epitaxial relations between the p-6P crystal <strong>in</strong> the β-structure and the mica (001) plane: (11-1) p-6P || (001) mica and [1-2-1] p-6P || [-340] mica ; (-1-11) p-6P ||(001) mica and [-110] p-6P || [-340] mica; (11-2) p-6P || (001) mica and [-20-1] p-6P || [-310] mica [59,60].(a)(c)(b)Fig. 3.11. (a) and (b): Arrangement of p-6P molecules <strong>in</strong> a view parallel to the crystallographic (001) ofmica. Panel (a) display a side view while panel (b) a parallel view along the molecular plane. (c):Idealized hexagonal mica surface with contact po<strong>in</strong>t lattice, represented by filled circles, of the p-6Pmolecules <strong>in</strong> the β-structure. The dashed l<strong>in</strong>e <strong>in</strong>dicates the growth direction of the needles [62].Figures 3.11 (a) and (b) display the relative molecule arrangement of p-6P with respect tothe mica (001) surface for the first epitaxial relation. The alignment of the molecules is obta<strong>in</strong>edby tak<strong>in</strong>g the (11-1) plane of p-6P crystal parallel to the mica surface. In all three cases, thealignment of p-6P molecules relative to the substrate and to each other is approximately thesame. The long molecular axes are not exactly parallel to the mica surface but they are tiltedabout 4.5° with respect to the mica (001) plane. Therefore, a s<strong>in</strong>gle p-6P molecule contacts themica surface only at a s<strong>in</strong>gle po<strong>in</strong>t. The distances between the contact po<strong>in</strong>ts are 26.34 Å and9.82 Å <strong>in</strong> the side and <strong>in</strong> the parallel view, respectively. The molecular planes of adjacentmolecules are tilted about 66° relative to each other, generat<strong>in</strong>g the typical herr<strong>in</strong>gbone structureof the p-6P crystal. The <strong>in</strong>terface between the mica (001) surface and the (11-1) plane of p-6Pare shown <strong>in</strong> Figure 3.11 (c). The contact po<strong>in</strong>ts of p-6P molecules are <strong>in</strong>dicated by filled30
Chapter 3: Self <strong>assembled</strong> para-sexiphenyl nanofiberscircles, whereas the hexagons represent the idealized mica (001) surface [62]. The periodiccontact po<strong>in</strong>ts between p-6P molecules and the mica surface form a two dimensional latticematched with the correctly oriented mica substrate. This contact po<strong>in</strong>t lattice is however<strong>in</strong>commensurable with the mica (001) lattice; therefore, a quasi-epitaxial growth of p-6P onmica (001) lattice is concluded [10]. However, <strong>in</strong> literature this molecular quasi-epitaxy iscalled “epitaxial growth”, so <strong>in</strong> the course of the thesis we refer to it as an epitaxial growth.S<strong>in</strong>ce X-ray diffraction experiments give only <strong>in</strong>formation about the bulk structure of p-6P,noth<strong>in</strong>g is known about the arrangement of the molecules with<strong>in</strong> the first monolayer on the mica(001) surface. Transmission electron microscopy <strong>in</strong> conjunction with transmission electrondiffraction measurements showed that the needles grow nearly perpendicular to the longmolecular axis of p-6P molecules [63]. The dashed arrow <strong>in</strong> Figure 3.11 (c) represents thegrowth direction of the fibers.The epitaxial growth of the p-6P fibers is determ<strong>in</strong>ed by the <strong>in</strong>termolecular <strong>in</strong>teractionsbetween the p-6P molecules as well as the <strong>in</strong>teraction with the substrate surface. Upon cleavage,half of the potassium ions of the mica (001) plane are removed from the surface. The rema<strong>in</strong><strong>in</strong>ghalf-monolayer of K + , plus the equal number of substitutional alum<strong>in</strong>um (Al 3+ ) ions, formsurface dipoles. The orientation of these dipoles on mica determ<strong>in</strong>es the orientation of themolecules on the surface. S<strong>in</strong>ce the average dipole moment of the p-6P oligomers on the surfaceis zero, the conf<strong>in</strong>ement of the <strong>in</strong>dividual molecules to the surface dipoles is most likely due to adipole <strong>in</strong>duced-dipole <strong>in</strong>teraction. The dipole field on the mica surface is of the order of 10 7V/cm [64]. The p-6P molecules grow parallel to this field s<strong>in</strong>ce the <strong>in</strong>teraction energy betweenthe surface dipole and the polarizable molecule is larger than the thermal energy of themolecules. Hence, the <strong>in</strong>teraction between surface dipoles and <strong>in</strong>duced-dipoles along the longmolecular axis of the p-6P molecules leads to a ly<strong>in</strong>g parallel alignment dur<strong>in</strong>g the <strong>in</strong>itial phaseof the growth process.Once the p-6P molecules are oriented <strong>in</strong> the mica (001) plane, the <strong>in</strong>termolecular<strong>in</strong>teractions between them cause the formation of the p-6P crystal β-structure. On the otherhand, the <strong>in</strong>teraction of the molecules with the s<strong>in</strong>gle crystall<strong>in</strong>e surface of mica yields to anepitaxial alignment of the p-6P crystallites. The epitaxial growth takes place <strong>in</strong> an islands modeor <strong>in</strong> a layer-plus-islands mode, as confirmed by the AFM measurements shown above (Figures3.8 and 3.9). Probably, the anisotropic elastic stra<strong>in</strong> <strong>in</strong>duced by the lattice mismatch between themica substrate and the first p-6P monolayer causes the formation of the crystall<strong>in</strong>e p-6Pelongated islands <strong>in</strong> the first stages of the growth [10,14].Cleavage leads to the formation of terraces on the mica surface, separated by big cleavagesteps. In each of these doma<strong>in</strong>s, the p-6P needles grow parallel to each other, but, from one31
<strong>Light</strong> <strong>amplification</strong> <strong>in</strong> <strong>organic</strong> <strong>self</strong>-<strong>assembled</strong> <strong>nanoaggregates</strong>doma<strong>in</strong> to another, the orientation of the fibers can be twisted around 120°. Figure 3.12 showsan epifluorescence micrograph of emitt<strong>in</strong>g p-6P nanofibers on mica. The step is a clear borderwhich separates areas with different needles orientation. The alignment of the p-6P fibers,which is clarified by the two white arrows, is rotated by an angle of 120° between the doma<strong>in</strong>s.Only two different doma<strong>in</strong>s of needles exist on the muscovite mica. LEED and opticalmicroscope measurements reveal that the fibers are oriented along the [110] and [1-10] highsymmetry directions of the (001) plane of muscovite mica [65]. No needles grow along the thirdhigh symmetry direction [100] (Figure 3.12).[1-10][110][100]Fig. 3.12. Epifluorescence micrograph of emitt<strong>in</strong>g p-6P nanofibers grown on two different doma<strong>in</strong>s of themuscovite mica. The needles orientations <strong>in</strong> the two doma<strong>in</strong>s, clarified by the two white arrows, form anangle of around 120°. The white l<strong>in</strong>es on the right <strong>in</strong>dicate the three high symmetry directions [110], [1-10] and [100] on the muscovite mica (001) plane. The p- 6P fibers are always oriented along the first twodirections and never along the [001] direction.To expla<strong>in</strong> this behavior, we have to consider that muscovite mica is dioctahedral mica, i.e.the <strong>in</strong>ward directed corners of the tetrahedral silicate layers occupy only six of the eight positionof each octahedron (see Figure 3.10), the two rema<strong>in</strong> positions be<strong>in</strong>g occupied by OH - anions.This leads to a tilt of the silicon oxide tetrahedron. Cleavage of mica can generate two dist<strong>in</strong>ctcleavage planes <strong>in</strong> which this distortion leads to the formation of grooves along [1-10] and [110]directions [62]. These grooves alternate by an angle of 120° between consecutive cleavagelayers. Experimentally, the grooves have been observed by atomic force microscopy [66]. Thisdistortion of the mica surface structure probably generates surface electric dipoles nearlyperpendicular to the direction of these grooves. No correlation between the surface dipole fieldsand the anisotropy of the mica cleavage planes has been found yet. However, the existence ofsurface dipole fields, po<strong>in</strong>t<strong>in</strong>g about 15° off the perpendicular to the high symmetry direction,32
Chapter 3: Self <strong>assembled</strong> para-sexiphenyl nanofibershas been postulated from LEED measurements on freshly cleaved muscovite mica [64].Therefore, the existence of this electric dipole field nearly perpendicular to two of the highsymmetry direction <strong>in</strong> different cleavage planes, can expla<strong>in</strong> the existence of two dist<strong>in</strong>ctdoma<strong>in</strong>s with different needles orientation.In conclusion, the p-6P growth along the [1-10] and [110] high symmetry directions of(001) mica plane, is probably due to a dipole-assisted epitaxial alignment. From epitaxial po<strong>in</strong>tof view it is favorable that the molecules are oriented perpendicular to one of the high symmetrydirection; this alone would give three equivalent growth directions. However, either [1-10] or[110] is favored because of the orientation of the electric surface dipoles nearly perpendicularlyto them [65].(a)(b)57 nmFig. 3.13. Fluorescence microscope image (a) and 20 × 20 µm 2 AFM topographic micrograph (b) of p-6Pneedles on cleaved phlogopite mica (film grown at a substrate temperature of 440K) [65].This explanation is supported by the analysis of the p-6P film grown on a different k<strong>in</strong>d ofmica substrate: the trioctahedral phlogopite mica. It has almost the same structure as muscovitemica, but the corners of the tetrahedral silicate layers occupy all the eight position of eachoctahedron. In phlogopite mica no distortion, and hence no grooves, take place, so only onecleavage plane exists and the three high symmetry directions [110], [1-10] and [100] areequivalent. In cleaved phlogopite mica no large doma<strong>in</strong>s with different p-6P needles orientationhas been observed [65]. Fluorescence microscope image and AFM topographic micrograph of 4nm p-6P film deposited on phlogopite mica (Figure 3.13. a and b) show very short needlesgrown along all three high symmetry directions.The surface structure of cleaved mica, and therefore the surface dipoles strength andorientation, can be changed by treat<strong>in</strong>g the cleavage surface before the deposition of <strong>organic</strong>molecules. For <strong>in</strong>stance, r<strong>in</strong>s<strong>in</strong>g cleaved muscovite mica <strong>in</strong> methanol or spray<strong>in</strong>g it withdeionized water leads to the replacement of the potassium cations with hydrogen atoms on the33
<strong>Light</strong> <strong>amplification</strong> <strong>in</strong> <strong>organic</strong> <strong>self</strong>-<strong>assembled</strong> <strong>nanoaggregates</strong>(001) surface [17]. The deposition by BME of <strong>organic</strong> molecules like oligothiophenes andoligophenyls on substrates which have been treated by methanol or water does not lead to thegrowth of mutually parallel oriented fibers as <strong>in</strong> freshly cleaved mica, but results <strong>in</strong> theformation of micrometer-sized r<strong>in</strong>gs and bent fibers [67]. Figure 3.14 shows a collection offluorescence microscope images (each 20 × 20 µm 2 ) of para-quaterphenyl (p-4P), parasexiphenyl(p-6P), alpha-quaterthiophene (α-4T) and alpha-sexithiophene (α-6T) deposited ontreated mica substrates. Optically active and micrometer or sub-micrometer scaled r<strong>in</strong>gstructures can be <strong>in</strong>terest<strong>in</strong>g <strong>in</strong> resonator amplifier or as <strong>in</strong>tegrated elements <strong>in</strong> more complexphotonic circuits [68].Fig. 3.14. 20 ×20 µm 2 fluorescence microscope images of p-4P, p-6P, α-4T and α-4T r<strong>in</strong>g-shapednanostructures on treated mica substrate [67].3.5. Optical properties of <strong>self</strong>-<strong>assembled</strong> p-6P nanofibersAs shown <strong>in</strong> the previous section, when deposition of para-sexiphenyl and other conjugatedoligomers occurs on substrates exhibit<strong>in</strong>g large surface electric dipoles, dipole <strong>in</strong>duced-dipole<strong>in</strong>teraction can lead to the <strong>self</strong>-assembly of molecular aggregates with submicrometric crosssectionaldimensions, truly macroscopic lengths (up to 1 mm) and high degree of crystall<strong>in</strong>ity.Such a supramolecular order has a big <strong>in</strong>fluence on the optical properties of the p-6P films.3.5.1. Optical anisotropyThe preferential orientation of the molecules on the substrate and the orientation of theneedles parallel to each other, lead to a macroscopic anisotropy of the optical absorption andemission [14].Figure 3.15 (a) depicts the typical polarized absorption spectra of a HWE-grown p-6Pnanofibers, parallel oriented on cleaved muscovite mica substrate, for different angles of thepolarizer with respect to the fibers axis. The plotted curves show a well-pronounced maximumaround 366 nm for the polarization perpendicular to the needles (90°), while, for polarizationparallel to the needles (0°), no significant absorption bands can be observed. At 366 nm the34
Chapter 3: Self <strong>assembled</strong> para-sexiphenyl nanofibersdicroic absorption ratio between the parallel and perpendicular polarization is more than 11 dB.The 366 nm absorption band is attributed to the π−π* dipole transition of the p-6P molecules.Figure 3.15 (b) shows the typical photolum<strong>in</strong>escence spectra of p-6P nanofibers film takenat two polarization geometries (<strong>in</strong>set of Figure) with respect to the nanofiber orientation. Themaximum of emission is observed aga<strong>in</strong> for excitation and collection polarization perpendicularto the needle axis. The dicroic ratio for 90°- 90° emission compared to 0°- 0° is ≈ 14 dB.(a)(b)Fig. 3.15. (a): Angularly resolved polarized absorption spectra of p-6P film at normal <strong>in</strong>cidence; 0° and90° relates to the field parallel and perpendicular to the needles direction, respectively. (b): Polarizedphotolum<strong>in</strong>escence spectra of p-6P film for excitation at 350 nm. The <strong>in</strong>set shows a schematicrepresentation of measur<strong>in</strong>g geometries [14].3.5.2. Optical waveguid<strong>in</strong>gCross-sectional dimensions (~ 100 nm <strong>in</strong> high and ~ 300 nm <strong>in</strong> width) of p-6P nanofibersenable s<strong>in</strong>gle-mode optical waveguid<strong>in</strong>g of the visible light. L<strong>in</strong>ear waveguid<strong>in</strong>g near 425nm, atthe 0-1 vibronic band of the emission spectra of p-6P has been demonstrated recently [56,69].Analytical theory for optical waveguid<strong>in</strong>g <strong>in</strong> nanometer-scaled dielectric <strong>nanoaggregates</strong> allowsto calculate the propagation constant and the cut-off wavelength for the guided modes.Mathematically, the propagation of the electric and magnetic fields <strong>in</strong> a dielectric mediumhav<strong>in</strong>g a dielectric tensor ˆε and magnetic permeability µ is described by the Helmholtz waveequations [70]:⎧ ⎫∇ + ˆ = 0⎝ c ⎠⎪B⎪⎩ ⎭→2⎛2 ω ⎞⎪E⎪⎜ µε2 ⎟⎨→⎬The determ<strong>in</strong>ation of the propagat<strong>in</strong>g modes <strong>in</strong> a dielectric waveguide requires solv<strong>in</strong>g theseequations with appropriate boundary conditions.35
<strong>Light</strong> <strong>amplification</strong> <strong>in</strong> <strong>organic</strong> <strong>self</strong>-<strong>assembled</strong> <strong>nanoaggregates</strong>In the case of p-6P nanofiber, the waveguide can be approximated by a rectangularwaveguide with side a and b on a dielectric substrate (Figure 3.16).yzAirε 1Substrateε 3bNanofiberε 2axFig. 3.16. Rectangular approximation of the p-6P needle as dielectric waveguide model.The dielectric constants of the medium surround<strong>in</strong>g the waveguide and of the substrate areε 1 and ε 3 respectively (ε 1 = 1 < ε 3 ). The waveguide is taken optically uniaxial with dielectricpermittivity tensor:⎛ ε // 0 0 ⎞ˆ⎜⎟ε2= 0 ε⊥0⎜ 0 0 ε ⎟⎝⊥ ⎠where ε // and ε ⊥ are the components of the dielectric tensor <strong>in</strong> the direction parallel andperpendicular to the long molecular axis, respectively. The imag<strong>in</strong>ary part of ε // and ε ⊥ are muchless than their real part and ε // > ε ⊥ . The magnetic permeability µ is taken = 1 <strong>in</strong> all three media.The solution of Helmholtz equations, for electric and magnetic field propagat<strong>in</strong>g <strong>in</strong> the zdirection, are of the form:0 i( ωt−βz)Eαj( x, y, z) = Eαj( x, y)e0 i( ωt−βz)Hα( x, y, z) = Hα( x, y)ejwhere the suffix α <strong>in</strong>dicate the three direction x, y, z, j =1,2,3 refers to the three medium, and βis the (modal) propagation constant. Impos<strong>in</strong>g the boundary conditions requir<strong>in</strong>g the cont<strong>in</strong>uityof the components along x and y of the electric and magnetic fields between the three media, ithas been demonstrated [56] that the nanofiber waveguide model can support the propagation oftransverse magnetic (TM) modes whereas the transverse electric (TE) mode cannot exist. TheTM propagation constant with<strong>in</strong> this model can be written as:j36
Chapter 3: Self <strong>assembled</strong> para-sexiphenyl nanofibers122 2⎡ωε // ⎛mπ⎞ ⎤⎢ ε2 // ⎜ ⎟c ε ⊥ ⎝ a ⎠β = −⎢⎣⎥ with m=1,2,3,...⎥⎦c mπFrom this equation we can f<strong>in</strong>d that the (TM) waves frequency has to beω> .aTherefore, the cutoff wavelength is:λc( m)2aε ⊥= .m2a ε ⊥The number of possible modes, m=1, 2, 3,.., is restricted by the condition m < ε // − ε3.λ εIf we take ε 1 =1, the mica refractive <strong>in</strong>dex ε 3 = 1.58 and the value for an isotropic parasexiphenylfilm ε 2 = 1.7 at λ = 425nm, we obta<strong>in</strong> ε // = 4.8 and ε ⊥ = 1.9 [56]. Us<strong>in</strong>g thesevalues, we can estimate that the m<strong>in</strong>imum fiber width (a m<strong>in</strong> ) for which at least one mode at 0-1band of the p-6P emission spectra (λ = 425nm) can propagate <strong>in</strong> the nanofiber is equal to 222nm.The imag<strong>in</strong>ary part of the propagation constant β gives the losses of the propagat<strong>in</strong>g lightdue to the material reabsorption:'α1" 2 22πε⎡ 1 ⎛ λ ⎞ ⎤⎢1'⎜ ⎟ ⎥λ ε ⎢⎣ε ⊥ ⎝2a⎠ ⎥⎦//= −//where ε and ε are the real and imag<strong>in</strong>ary part of the component of dielectric tensor parallel//"//to the long molecular axis, and λ is the wavelength <strong>in</strong> vacuum of the guided mode. Theimag<strong>in</strong>ary part of the component perpendicular to the long molecular axis is supposed negligible[71].In a real p-6P nanofiber waveguide the losses of the conf<strong>in</strong>ed modes are due to the materialreabsorption and to light scatter<strong>in</strong>g. The total propagation losses for the waveguided mode at425 nm can be estimated experimentally. Balzer et al. [56], excit<strong>in</strong>g locally an isolatednanofiber, measured the outcoupled lum<strong>in</strong>escence <strong>in</strong>tensity from a fiber break at a variabledistance between the excitation and outcoupled po<strong>in</strong>t (Figure 3.17). The <strong>in</strong>tensity of thewaveguided light decreases exponentially with the distance along the waveguide( z z0)I z I z e −α−( ( ) ( )= , where α = Imβ), so from the experimental measurements of outcoupled0lum<strong>in</strong>escence <strong>in</strong>tensity as a function of distance from excitation po<strong>in</strong>t, it could be estimated thatthe total propagation losses <strong>in</strong> p-6P nanofiber are α ~ 100−300 cm -1 , depend<strong>in</strong>g on the selectednanofiber.//ε ⊥37
<strong>Light</strong> <strong>amplification</strong> <strong>in</strong> <strong>organic</strong> <strong>self</strong>-<strong>assembled</strong> <strong>nanoaggregates</strong>Fig. 3.17. (a): Fluorescence images of emitt<strong>in</strong>g <strong>in</strong>dividual p-6P nanofiber (width a ≈ 400nm), taken at fivedifferent distances between excitation and outcoupl<strong>in</strong>g po<strong>in</strong>t. (b): Outcoupled lum<strong>in</strong>escence <strong>in</strong>tensity as afunction of distance from the excitation po<strong>in</strong>t. The red l<strong>in</strong>e is a fit to the experimental data. The dashedl<strong>in</strong>e represents the spatial excitation profile [56].The analytical model for optical waveguid<strong>in</strong>g <strong>in</strong> rectangular <strong>nanoaggregates</strong> allows also toestimate the conf<strong>in</strong>ement factor of the waveguided mode, def<strong>in</strong>ed as the ratio of the light<strong>in</strong>tensity with<strong>in</strong> the nanofiber to the sum of light <strong>in</strong>tensity both with<strong>in</strong> and outside the guide:Γ=Γxyb∫∫ =∫∫0 0xya( , )E x y( , )E x yThe conf<strong>in</strong>ement factor of p-6P nanofibers, at the wavelength of 425 nm, has been estimated tobe ~ 0.9 % for fiber height and width of 90 and 220 nm respectivelly, and ~ 1.2 % for heightand width of 120 and 220 nm [72].22dxdydxdy38
CHAPTER 4EXPERIMENTAL METHODSDifferent experimental techniques have been used <strong>in</strong> this work to characterize the samplesof p-6P <strong>self</strong>-<strong>assembled</strong> nanofibers. For a morphological study we used an atomic forcemicroscope (AFM) <strong>in</strong> “tapp<strong>in</strong>g mode” configuration, particularly suitable to <strong>in</strong>vestigate softsamples like those of our <strong>in</strong>terest. The optical emission properties have been studied us<strong>in</strong>gstandard spectroscopic techniques like spectrally- and spatially-resolved photolum<strong>in</strong>escence andlas<strong>in</strong>g measurements.39
<strong>Light</strong> <strong>amplification</strong> <strong>in</strong> <strong>organic</strong> <strong>self</strong>-<strong>assembled</strong> <strong>nanoaggregates</strong>4.1. Atomic Force MicroscopyAtomic force microscope is one of the family of scann<strong>in</strong>g probe microscopes <strong>in</strong> which asharp probe is scanned across the surface of the sample and some sample-probe <strong>in</strong>teractionsmeasurement allows a study of the surface topography, theoretically with atomic resolution <strong>in</strong>all directions <strong>in</strong> space.The sensitive element (probe) <strong>in</strong> the AFM is an elastic cantilever, usually made on silicon orsilicon nitride, <strong>in</strong> the free end of which a sharp tip is fabricated (fig. 4.1).Fig. 4.1. Schematic representation of the pr<strong>in</strong>ciple of work<strong>in</strong>g of the AFM.When the tip is brought close to the sample surface the <strong>in</strong>teratomic forces between the tipand the sample cause a bend<strong>in</strong>g of the cantilever. This deflection is measured optically detect<strong>in</strong>gthe variations <strong>in</strong> the direction of a laser beam reflected from the cantilever. As the tip is scannedover the sample surface, it allows to map out its topography.The resolution of the AFM depends ma<strong>in</strong>ly on the sharpness of the tip, which can bemanufactured with an end radius of few nanometers. Atomic resolution can be obta<strong>in</strong>ed onlywith relatively robust and periodic samples, <strong>in</strong> contact mode.With soft samples as <strong>organic</strong> materials however, is more difficult to image the surfacebecause the forces exerted by the tip dur<strong>in</strong>g the scann<strong>in</strong>g can cause deformations and damages<strong>in</strong> the sample. This problem has been overcome by us<strong>in</strong>g the AFM <strong>in</strong> tapp<strong>in</strong>g mode. In thisoperat<strong>in</strong>g mode, the cantilever oscillates <strong>in</strong> a direction perpendicular to the surface, result<strong>in</strong>g <strong>in</strong>only <strong>in</strong>termittent contact between the tip and the surface. This greatly reduces the lateral forcesthat are responsible for most of the damage of the samples as the tip is scanned. Figure 4.2shows a schematic representation of the tapp<strong>in</strong>g mode AFM.40
Chapter 4: Experimental methodsControllerFig. 4.2. Simplified representation of the AFM operat<strong>in</strong>g <strong>in</strong> tapp<strong>in</strong>g mode.The cantilever oscillates at or near its resonance frequency with amplitude rang<strong>in</strong>g typicallyfrom 20nm to 100nm. The feedback loop ma<strong>in</strong>ta<strong>in</strong>s constant oscillat<strong>in</strong>g amplitude byma<strong>in</strong>ta<strong>in</strong><strong>in</strong>g a constant RMS of the oscillat<strong>in</strong>g signal acquired by the split photodiode detector(fig.4.2). The vertical position of the scanner for each x-y position <strong>in</strong> order to ma<strong>in</strong>ta<strong>in</strong> aconstant set po<strong>in</strong>t amplitude is stored by the computer to form the topographic image of thesample surface. Tapp<strong>in</strong>g mode AFM is capable of better than 1 nm resolution on ideal samples.In this work, a standard AFM “SolverPRO” manufactured by NT-MDT has been used. The<strong>in</strong>strument has two different scann<strong>in</strong>g modes: scann<strong>in</strong>g by probe, <strong>in</strong> which the probe movesacross the surface of a stationary sample, and scann<strong>in</strong>g by a sample which moves relative to theprobe. In all the measurements on p-6P samples shown <strong>in</strong> this thesis, scann<strong>in</strong>g by probeoperat<strong>in</strong>g mode has been used. Silicon rectangular cantilevers with typical thickness of 2.0 µmand resonance frequency between 115 and 190 KHz has been employed. The probe tips have aheight of 10-15 µm and a typical curvature radius of 10 nm.41
<strong>Light</strong> <strong>amplification</strong> <strong>in</strong> <strong>organic</strong> <strong>self</strong>-<strong>assembled</strong> <strong>nanoaggregates</strong>4.2. Spectrally- and spatially-resolved photolum<strong>in</strong>escenceIn this work, two different experimental setups have been used to study the emissionproperties of the p-6P nanofibers. The first setup, shown <strong>in</strong> Figure 4.3, has been used to studythe lum<strong>in</strong>escence and las<strong>in</strong>g emission of photoexcited samples with high density of nanofibers.MRGABBOMSpectroCCDCamera L LF 1 LN 2F NDmLF 2λ/2 LLmLLampLCryostatSamplecooledCCDMmMFig. 4.3. Schematic representation of lum<strong>in</strong>escence setup. RGA: regenerative amplifier laser sistem;M: mirrors; m: movable mirrors; L: achromatic lenses; F 1 : coloured filter BG38; F 2 : coloured glass filtersGG400; F ND : neutral density variable filters; λ/2: half wave plate.SampleTransmitted emissionExcitationEdge emissionReflected emissionFig. 4.4. Different excitation and collection geometries <strong>in</strong> the lum<strong>in</strong>escence setup.42
Chapter 4: Experimental methodsIn this experimental setup, the excitation source is a Ti:sapphire regenerative amplifier(RGA) deliver<strong>in</strong>g 150 fs laser pulses at wavelength of 780 nm, repetition rate of 1 KHz andenergy 1 mJ per pulse. To excite the samples <strong>in</strong> their spectral absorption region, we generate thesecond harmonic of the RGA output with a 2 mm thick BBO crystal. A set of calibrated neutraldensity filters (F ND ) is used to study the emission spectrum of the samples at different excitationdensity <strong>in</strong> order to determ<strong>in</strong>e the las<strong>in</strong>g threshold. A half wave plate (λ/2) allows us to set thepolarization of the laser pulses parallel to the long molecular axis of p-6P molecules so that amaximum material absorption can be achieved. The laser beam is then focalized by 120cm lens<strong>in</strong> the sample surface giv<strong>in</strong>g an excitation spot diameter of ~ 120µm. The samples are mounted<strong>in</strong> a recirculat<strong>in</strong>g-loop cold-f<strong>in</strong>ger cryostat for low temperature measurements (from 30 K toroom temperature). The samples can be rotated so that measurements <strong>in</strong> different excitation andcollection configurations can be made. The samples can be excited at normal <strong>in</strong>cidence or atdifferent angles and the emission can be collected <strong>in</strong> transmission, at the edge or <strong>in</strong> reflection(fig. 3.4).The emission of the sample, suitably filtered from the rema<strong>in</strong><strong>in</strong>g excitation laser beam, iscollected by a optical system with an f-number (F/#) of 4 and dispersed <strong>in</strong> a 46 cm s<strong>in</strong>glespectrometer. The detection system is a LN 2 cooled silicon CCD. The spectral resolutionachievable with the system is 2Å. A CCD camera and a white light lamp allow us to select theproper doma<strong>in</strong>s of the samples surface where to make the measurements and the propernanofibers orientation.The second experimental setup, shown <strong>in</strong> Figure 4.5, has been used to resolve spatially andspectrally the photolum<strong>in</strong>escence and the las<strong>in</strong>g emission of samples with s<strong>in</strong>gle isolatednanofibers. The setup is almost the same shown <strong>in</strong> Figure 3.4 except that <strong>in</strong> the last we used amicroscope objective with 32x magnification and 0.40 numerical aperture to collect theemission of the samples and to focus it <strong>in</strong> the plane of the entrance slit of the spectrometer.43
<strong>Light</strong> <strong>amplification</strong> <strong>in</strong> <strong>organic</strong> <strong>self</strong>-<strong>assembled</strong> <strong>nanoaggregates</strong>SpectroMBBOMCCDCameramF 2LN 2cooledCCDDMicroscopeobjectiveSampleF 1LLampλ/2RGALF NDDMmMFig. 4.5. Schematic representation of experimental setup for spectrally- and spatially- resolvedphotolum<strong>in</strong>escence. RGA: regenerative amplifier laser system; M: mirrors; m: movable mirrors; L:achromatic lenses; F 1 : coloured filter BG38; F 2 : coloured glass filters GG400; F ND : neutral densityvariable filters; λ/2: half wave plate; D: iris diaphragms.The setup has been used <strong>in</strong> two different configurations. Sett<strong>in</strong>g the grat<strong>in</strong>g to the zero orderdiffraction the system, equipped with a two dimensional detector (a LN 2 cooled CCD), can beused as an imager (spatial mode configuration). The spatial resolution achievable with thesystem, checked by us<strong>in</strong>g a calibrated test target, is ~ 2 µm. Figure 4.6 (a) displays, as anexample, an image of a sample region with isolated nanofibers and the emission profiles <strong>in</strong> boththe x and y directions. Account<strong>in</strong>g for the 32x magnification and the pixel dimension of theCCD (26×26µm 2 ), a region of the sample of a ~ 65 (horizontal) × 200 (vertical) µm 2 , with<strong>in</strong> theexcitation spot, can be imaged with the <strong>in</strong>put slit fully opened (2mm).Sett<strong>in</strong>g the grat<strong>in</strong>g of the spectrometer to the first order diffraction and clos<strong>in</strong>g the <strong>in</strong>put slitat 100µm it is possible to select spatially, with the same resolution (2µm), the emission of as<strong>in</strong>gle isolated nanofiber aligned parallel to the entrance slit and resolve it spectrally with aresolution of about 0.2 nm (spectral mode configuration). As an example of this operat<strong>in</strong>gmode, Figure 4.6 (b) shows the emission <strong>in</strong>tensity of the selected nanofiber, which appears <strong>in</strong>the centre of the image <strong>in</strong> Figure 4.6 (a), The emission is spectrally resolved <strong>in</strong> X direction andspatially resolved <strong>in</strong> Y.44
Chapter 4: Experimental methodsFig. 4.6. (a) Gray scale emission <strong>in</strong>tensity image of a sample region with sparse p-6P nanofibers with theprofiles of the emission <strong>in</strong>tensity <strong>in</strong> X (top) and Y (right) directions. (b) Gray scale emission <strong>in</strong>tensityimage, spectrally resolved <strong>in</strong> the X dimension and spatially <strong>in</strong> Y, of the central fiber shown <strong>in</strong> panel (a);emission spectrum of the fiber taken <strong>in</strong> the region Y=115-125 pixels (top) and spectrally <strong>in</strong>tegratedemission profile (right) are shown.45
<strong>Light</strong> <strong>amplification</strong> <strong>in</strong> <strong>organic</strong> <strong>self</strong>-<strong>assembled</strong> <strong>nanoaggregates</strong>46
CHAPTER 5RANDOM LASINGAND OPTICAL GAININ p-6P NANOFIBERSIn this chapter, we present an <strong>in</strong>vestigation on the morphology and emission properties ofp-6P needle-shaped aggregates grown on muscovite mica substrate. The <strong>nanoaggregates</strong>topography is probed by atomic force microscopy. Spontaneous and stimulated light emission,as well as laser action, is <strong>in</strong>vestigated through the micro-spectrographic system showed <strong>in</strong>chapter four, provid<strong>in</strong>g both spectral and spatial resolution. Correlations between morphologyand stimulated emission properties are po<strong>in</strong>ted out. The first part of this section is dedicated tothe properties of samples with close-packed nanofibers hav<strong>in</strong>g different widths and heights,both <strong>in</strong> ensemble-averaged and spatially-resolved measurements. In the second part, we analyzelas<strong>in</strong>g and amplified spontaneous emission (ASE) properties <strong>in</strong> isolated p-6P nanofibers. Wepresent some theoretical models to quantitatively support the <strong>in</strong>terpretation of experimentalresults. We assess basic material parameters like the net optical ga<strong>in</strong> coefficient and thestimulated emission cross-section.47
<strong>Light</strong> <strong>amplification</strong> <strong>in</strong> <strong>organic</strong> <strong>self</strong>-<strong>assembled</strong> <strong>nanoaggregates</strong>5.1. <strong>Light</strong> <strong>amplification</strong> <strong>in</strong> close-packed p-6P nanofibers5.1.1. Random las<strong>in</strong>gSamples shown <strong>in</strong> this section are grown by the group of professor H. Sitter, (University ofL<strong>in</strong>z, Austria), by Hot Wall Epitaxy.The first sample shown is a p-6P film grown on freshly cleaved muscovite mica substrate ata temperature of 400 K, with evaporation time of 40 m<strong>in</strong>utes. Figure 5.1 (a) shows a tapp<strong>in</strong>gmode AFM topographic image of a 10×10 µm 2 region of the sample.0,2(b)Needles fraction0,10,00,2100 200 300Needles height (nm)(c)Needles fraction0,10,0100 200 300 400 500Needles width (nm)Fig. 5.1. (a): AFM topography image of a 10×10 µm 2 region of a p-6P film on mica; z scale is 0-220 nm.(b): Experimental fiber height distribution. (c): Experimental fiber width distribution. Red l<strong>in</strong>es are thecorrespond<strong>in</strong>g Gaussian fits to the data.Almost all the nanofibers are oriented <strong>in</strong> the same direction and are close-packed. Theycover a sample surface region of about 50 %, and have a length of several hundred micrometers.The height and width distributions are measured from the AFM image with a l<strong>in</strong>e profile alongthe direction perpendicular to the needle axis. The results are shown <strong>in</strong> Figure 5.1 (b) and (c),with the correspond<strong>in</strong>g Gaussian fit to the experimental data. The average fiber height andwidth is 110 and 220 nm, respectively [59]. Theoretical models show that the nanofibers cansupport light propagation at 425 nm only if their width is larger than 220 nm (see § 3.5.2).Therefore only the needles ly<strong>in</strong>g <strong>in</strong> the upper side of the width distribution can contribute to<strong>amplification</strong> of spontaneous emission and laser action at the 0-1 vibronic peak (425 nm) of theemission spectra of p-6P.48
Chapter 5: Random las<strong>in</strong>g and optical ga<strong>in</strong> <strong>in</strong> p-6P nanofibersOptical emission properties of this sample are studied with both ensemble-averaged andspatially-resolved photolum<strong>in</strong>escence measurements (§ 5.1.3).The ensemble-averaged results, taken us<strong>in</strong>g the photolum<strong>in</strong>escence setup shown <strong>in</strong> Figure4.3, are analyzed first. The sample is excited at normal <strong>in</strong>cidence and the excitation spot size,hav<strong>in</strong>g a diameter of 120 µm, allows to pump a large number of nanofibers. Figure 5.2 shows aseries of spectrally resolved emission measurements, taken at the temperature of 30 K, fordifferent excitation energy densities Φ, and collected normally to the sample surface.T = 30KEmission Intensity (a.u.)Φ (µJ/cm 2 ) =2.71.30.70.50-1 0-2420 430 440 450Wavelength (nm)Fig. 5.2. Emission spectra, taken at the temperature of 30 K, for different values of pump fluenceΦ (µJ/cm 2 per pulse).At low excitation fluence, spontaneous emission exhibits the typical vibronic progression ofp-6P, with 0-1 and 0-2 bands centered at 425 and 450nm, respectively. When the excitationfluence reaches a threshold value (Φ th ) of about 0.5 µJ/cm 2 per pulse, very narrow and randomlyspatially distributed spectral l<strong>in</strong>es suddenly emerge from the spontaneous emission spectrum atthe 0-1 vibronic peak. The l<strong>in</strong>es have a resolution-limited width of 0.2 nm.The emission is found to be highly polarized, with a polarization ratio larger than 7 dBacross the entire spectral emission range, as it can be seen <strong>in</strong> Figure 5.3. This is due to the highcrystal order of the nanofibers and to the anisotropic distribution of the fibers <strong>in</strong> the samplesurface (Figure 5.1).49
<strong>Light</strong> <strong>amplification</strong> <strong>in</strong> <strong>organic</strong> <strong>self</strong>-<strong>assembled</strong> <strong>nanoaggregates</strong>10Emission <strong>in</strong>tensity (a.u.)//8642Polarization ratio (dB)0410 420 430 440 450 460Wavelength (nm)Fig. 5.3. Emission spectra measured after polarization filter<strong>in</strong>g along the direction parallel (//) andperpendicular (⊥) to the long molecular axis of p-6P. Blue dots: Intensity ratio between the twopolarizations.The spectral distribution of the narrow l<strong>in</strong>es is strongly dependent on the sample excitationregion. Figure 5.4 shows the emission measured <strong>in</strong> two different regions of the sample surfaceat the same excitation fluence. In these data, the contribution of the spontaneous emission hasbeen subtracted <strong>in</strong> order to highlight the laser-like response <strong>in</strong> the spectral pattern abovethreshold. The spectral shape of the emission does not change when repeat<strong>in</strong>g the measurements<strong>in</strong> the same region at different times, so we can exclude that the narrow l<strong>in</strong>es are experimentalartifacts.Intensitysite 2site 1420 425 430wavelength (nm)Fig. 5.4. Emission spectra measured <strong>in</strong> two different sites of the sample surface at the temperature of 300K.The threshold pump fluence Φ th also depends strongly on the sample excitation region (wemesured variations up to a factor of ten) but is <strong>in</strong>dependent on the temperature <strong>in</strong> the rangebetween 30 K and 300 K, with<strong>in</strong> our experimental accuracy of 10%. The lowest value of the50
Chapter 5: Random las<strong>in</strong>g and optical ga<strong>in</strong> <strong>in</strong> p-6P nanofibersthreshold fluence mesured <strong>in</strong> this sample is 0.5 µJ/cm 2 per pulse. Be<strong>in</strong>g the material absorptionof about 30%, the covered area of the sample surface ≈ 50%, and assum<strong>in</strong>g that the conversionefficiency of the absorbed pump energy <strong>in</strong>to s<strong>in</strong>glet excitons is equal to 100%, for Φ th = 0.5µJ/cm 2 we estimate the lowest threshold density N th ≈ 6 × 10 16 cm -3 .All these emission characteristics are reproduced <strong>in</strong> the temperature range between 30 K to300 K and us<strong>in</strong>g collect<strong>in</strong>g optics with different numerical aperture and different excitation andcollection geometries.The observed phenomenology can be attributed to coherent random las<strong>in</strong>g, aris<strong>in</strong>g fromrecurrent scatter<strong>in</strong>g along the nanofibers [73]. The optical feedback necessary for laser actionorig<strong>in</strong>ates from cracks, bends, sudden variation <strong>in</strong> fiber height and width and <strong>in</strong>tersection po<strong>in</strong>tsbetween different fibers. All these <strong>in</strong>homogeneities act as scatter<strong>in</strong>g centers. The light diffusedby a scatterer can come back to the same scatterer after experienc<strong>in</strong>g a sequence of scatter<strong>in</strong>gprocesses <strong>in</strong> the p-6P film, hence form<strong>in</strong>g a close-loop path for light <strong>amplification</strong>. Las<strong>in</strong>g startswhen the close loop <strong>amplification</strong> overcome the losses, provided that the total phase variation <strong>in</strong>the loop has to be equal to <strong>in</strong>teger multiple of 2π .Ow<strong>in</strong>g to the random phase acquired <strong>in</strong> each scatter<strong>in</strong>g process and to the randomness of thes<strong>in</strong>gle-path length (between subsequent scatter<strong>in</strong>g events), random las<strong>in</strong>g frequencies arerealized. As the pump fluence is <strong>in</strong>creased, a grow<strong>in</strong>g number of closed-loop random pathsexist<strong>in</strong>g with<strong>in</strong> the photoexcited spot reaches threshold, result<strong>in</strong>g <strong>in</strong> the appearance of additionaldiscrete peaks <strong>in</strong> the emission spectrum.The evolution of the emission spectrum as a function of the excitation power is very similarto that reported <strong>in</strong> an ensemble of dye-filled microcrystals, where laser oscillation beg<strong>in</strong>s onlow-optical loss s<strong>in</strong>gle crystals, while the other microresonators with large losses, contribute tothe ensemble response with spontaneous emission only [74]. Coherent random las<strong>in</strong>g with verysimilar features has been reported over the last few years <strong>in</strong> a variety of solid state, high-ga<strong>in</strong>materials, <strong>in</strong>clud<strong>in</strong>g films of <strong>organic</strong> molecules like substituted thiophene-based oligomers [33-37].The <strong>in</strong>terpretation of the non l<strong>in</strong>ear emission <strong>in</strong> p-6P films as coherent random las<strong>in</strong>g is alsosupported by the results of spectrally- and time-<strong>in</strong>tegrated emission <strong>in</strong>tensity measurements as afunction of excess pump fluence, def<strong>in</strong>ed as∆Φ =ΦΦ −ΦΦthth. Figure 5.5 shows the experimentaldata (black dots) with the correspond<strong>in</strong>g fit, plotted on a logarithmic scale. The <strong>in</strong>tensity is<strong>in</strong>tegrated over the random las<strong>in</strong>g spectral region, after subtraction of the contribution ofspontaneous emission.51
<strong>Light</strong> <strong>amplification</strong> <strong>in</strong> <strong>organic</strong> <strong>self</strong>-<strong>assembled</strong> <strong>nanoaggregates</strong>SI Intensity1 10∆Φ/ΦthFig. 5.5. Black solid dots: experimental po<strong>in</strong>ts of spectrally <strong>in</strong>tegrated emission <strong>in</strong>tensity vs normalizedpump excess fluence ∆φ/φ th taken at the temperature of 30 K. Red l<strong>in</strong>e: fit to the experimental data.The spectrally <strong>in</strong>tegrated <strong>in</strong>tensity <strong>in</strong>creases nearly quadratically with ∆Φ/Φ, and saturationpossibly occurs at higher pump levels. This superl<strong>in</strong>ear behavior can be attributed to the<strong>in</strong>homogeneity of the ensemble, due to the presence of fibers with different sizes and shape, andexhibit<strong>in</strong>g different optical losses. Therefore when the excitation fluence is <strong>in</strong>creased, the totalnumber of modes that reach the oscillation condition also <strong>in</strong>crease. Consequently the outputpower depends superl<strong>in</strong>early on the pump fluence.5.1.2. Amplified Spontaneous EmissionIn addition to coherent random las<strong>in</strong>g, as the excitation fluence is <strong>in</strong>creased, optical ga<strong>in</strong>exceeds the losses <strong>in</strong> an <strong>in</strong>creas<strong>in</strong>g number of open-loop paths, yield<strong>in</strong>g to <strong>amplification</strong> ofspontaneous emission (ASE or <strong>in</strong>coherent random las<strong>in</strong>g). Spectral narrow<strong>in</strong>g due to the ASEprocess is evident <strong>in</strong> the Figure 5.6, where the emission spectra as a function of the pumpfluence, at high excitation density, have been plotted. ASE is also evident at the 0-2 vibronicband of p-6P, near 450nm. The occurrence of an ASE process <strong>in</strong> high-losses nanofibers expla<strong>in</strong>salso the persistence of superl<strong>in</strong>ear growth of the spectrally <strong>in</strong>tegrated emission <strong>in</strong>tensity shown<strong>in</strong> Figure 5.5, and the progressive decrease <strong>in</strong> visibility of random las<strong>in</strong>g modes at large valuesof excitation fluence (fig. 5.6) [36].52
Chapter 5: Random las<strong>in</strong>g and optical ga<strong>in</strong> <strong>in</strong> p-6P nanofibersEmission Intensity (log scale)Φ (µJ/cm 2 ) = 1031.610-1 0-2410 420 430 440 450 460Wavelength (nm)Fig. 5.6. Emission spectra taken at different values of excitation fluence Φ (µJ/cm 2 per pulse), at thetemperature of 300 K, on the sample shown <strong>in</strong> Figure 5.1.5.1.3. Spatially-resolved las<strong>in</strong>g emissionTo have a deeper understand<strong>in</strong>g of the random las<strong>in</strong>g orig<strong>in</strong> <strong>in</strong> p-6P nanofibers films,spatially- and spectrally-resolved measurements on the sample shown <strong>in</strong> Figure 5.1 have beenperformed.8060Y position (µm)402000 10 20 30 40 50X position (µm)Fig. 5.7. Gray scale image of spatially resolved nanofibers emission above random las<strong>in</strong>g threshold. Thewhite markers delimit the area over which the spectrally resolved emission shown <strong>in</strong> fig. 5.8 is spatially<strong>in</strong>tegrated.53
<strong>Light</strong> <strong>amplification</strong> <strong>in</strong> <strong>organic</strong> <strong>self</strong>-<strong>assembled</strong> <strong>nanoaggregates</strong>Us<strong>in</strong>g the lum<strong>in</strong>escence set-up expla<strong>in</strong>ed <strong>in</strong> chapter 4 (fig. 4.5), and a laser spot of 180 µm<strong>in</strong> diameter, a surface region <strong>in</strong> the edge of a doma<strong>in</strong> where the nanofibers are sparse, has beenexcited. Figure 5.7 shows a gray scale micrograph of a sample region smaller than the excitationspot, taken at excitation fluence above random las<strong>in</strong>g threshold, so that it displays bothspontaneous and coherent emission. It can be dist<strong>in</strong>guished the emission from s<strong>in</strong>gle partiallyisolated nanofibers, which however are optically <strong>in</strong>terconnected.The emission spectra are measured <strong>in</strong>tegrat<strong>in</strong>g over the small 3×56 µm 2 area <strong>in</strong>dicated bythe white markers <strong>in</strong> Figure 5.7. In this way, the emission of a s<strong>in</strong>gle nanofiber segment hasbeen selected. Figure 5.8 show the spectra for different pump fluences below and above las<strong>in</strong>gthreshold, for this selected segment.Emission Intensity (log scale)Φ (µJcm -2 ) = 1925931420 440 460 480Wavelength (nm)Fig. 5.8. Emission spectra taken at different values of excitation fluence Φ (µJ/cm 2 per pulse), at thetemperature of 300 K, and <strong>in</strong>tegrated over the region delimited by the white markers <strong>in</strong> Figure 5.7.The results are similar to those observed <strong>in</strong> ensemble-average measurements shownpreviously: discrete random las<strong>in</strong>g peaks emerge from the emission spectrum at the 0-1 vibronicband of p-6P, near 425nm, when the excitation fluence reaches a threshold value. Las<strong>in</strong>g isobserved also at the 0-2 vibronic peak near 450nm.The strong similarities between the ensemble-averaged spectra and the spatially-resolvedspectra suggest that <strong>in</strong> these nanofibers coherent random las<strong>in</strong>g has a one-dimensional character.Th<strong>in</strong> cracks and other sites, where sudden variation <strong>in</strong> fiber thickness or width occurs, canexpla<strong>in</strong> the build-up of one-dimensional random optical cavities <strong>in</strong> <strong>in</strong>dividual nanofibers. In thissample, however, there are no fully isolated nanofibers but only isolated segments which can be54
Chapter 5: Random las<strong>in</strong>g and optical ga<strong>in</strong> <strong>in</strong> p-6P nanofibersresolved spectroscopically. It is possible that closed-loop random paths extend over many crossconnectednanofibers. In such a limit case, cross-connection po<strong>in</strong>ts would represent thedom<strong>in</strong>ant scatter<strong>in</strong>g centers and the result<strong>in</strong>g random cavities would be merely twodimensional.This issue will be clarified <strong>in</strong> the § 5.3.1, where las<strong>in</strong>g emission measurements <strong>in</strong>comb<strong>in</strong>ation with AFM morphological characterization on isolated nanofibers are presented.5.1.4. Film thickness dependence of optical responseVery similar results are obta<strong>in</strong>ed for samples with different growth conditions. Figure 5.9(a) shows the AFM topography image of a p-6P film grown by Hot Wall Epitaxy on freshlycleaved mica substrate at the same temperature of the sample shown <strong>in</strong> Figure 5.1 (a) (400 K),but with an evaporation time of 120 m<strong>in</strong>utes.(a)Needles fraction0,20,1(b)Needles fraction0,00,1100 200 300 400 500 600Needles height (nm)(c)0,0100 200 300 400 500 600 700Needles width (nm)Fig. 5.9. (a): AFM topography image of a 10×10 µm 2 region of a p-6P film on mica; z scale is 0-700 nm.(b): Experimental fiber height distribution. (c): Experimental fiber width distributions. Red l<strong>in</strong>es are theGaussian fits to the data.In this sample the p-6P nanofibers are more close-packed than <strong>in</strong> the previous one (Figure5.9 a), and their mean height and width are 190 nm and 350 nm respectively (Figure 5.9 b andc).Figure 5.10 displays the spectrally-resolved ensemble emission as a function of theexcitation fluence Φ, at ambient temperature. Coherent random modes are less pronounced than<strong>in</strong> sample of § 5.1.1. Furthermore the threshold pump fluences measured <strong>in</strong> this sample arehigher ( from 10 µJ/cm 2 to 100 µJ/cm 2 depend<strong>in</strong>g on the surface region). These experimentalresults can be expla<strong>in</strong>ed with a larger film <strong>in</strong>homogeneity that is responsible for an <strong>in</strong>creasedefficiency of light scatter<strong>in</strong>g <strong>in</strong>to out of plane direction. The possibilities of build<strong>in</strong>g-up <strong>in</strong>-planeclosed-loop paths for coherent random las<strong>in</strong>g are subsequently reduced. However, as <strong>in</strong> the55
<strong>Light</strong> <strong>amplification</strong> <strong>in</strong> <strong>organic</strong> <strong>self</strong>-<strong>assembled</strong> <strong>nanoaggregates</strong>previous sample, a spectral narrow<strong>in</strong>g of the 0-1 vibronic band at 425nm due to the ASEprocess has been found.Emission Intensity (log scale)Φ (µJ/cm 2 ) = 804020120-1 0-2410 420 430 440 450 460Wavelength (nm)Fig. 5.10. Emission spectra taken at different values of excitation fluence Φ (µJ/cm 2 per pulse), at thetemperature of 300 K, on sample with high density of nanofibers (Figure 5.7).The AFM image of the third sample analyzed <strong>in</strong> this section is shown <strong>in</strong> Figure 5.11 (a). Itis a p-6P film grown by Hot Wall Epitaxy on freshly cleaved mica substrate at the temperatureof 400 K with an evaporation time of 5 m<strong>in</strong>utes.The p-6P nanofibers are much sparser than <strong>in</strong> the previous samples, and the mean heightand width are 120 nm and 14 0nm respectively, as shown <strong>in</strong> Figure 5.11 (b) and (c). From astatistical analysis based on the data shown <strong>in</strong> Figure 511 (c), the fraction of nanofibers withwidth larger than 220 nm (that is the cut-off width for waveguid<strong>in</strong>g at 425 nm) has beenestimated less than 2%. From the ensemble-averaged measurements, las<strong>in</strong>g emission has notbeen detected <strong>in</strong> this sample for excitation fluence as high as 2 mJ/cm 2 . Lack of laser action canbe attributed to poor optical waveguid<strong>in</strong>g due to <strong>in</strong>sufficient fiber width.56
Chapter 5: Random las<strong>in</strong>g and optical ga<strong>in</strong> <strong>in</strong> p-6P nanofibers(a)(b)(c)Fig. 5.11. (a): AFM topography image of a 10×10 µm 2 region of a p-6P film on mica; z scale is 0-100 nm.(b): Experimental fiber height distribution. (c): Experimental fiber width distribution. Red l<strong>in</strong>es are theGaussian fit to the data.5.2. Bimolecular s<strong>in</strong>glet-s<strong>in</strong>glet annihilation process <strong>in</strong> p-6P aggregatesNonradiative processes as s<strong>in</strong>glet-s<strong>in</strong>glet annihilation, s<strong>in</strong>glet-polaron and s<strong>in</strong>glet-tripletscatter<strong>in</strong>g are important source of density-dependent losses <strong>in</strong> crystall<strong>in</strong>e and amorphous<strong>organic</strong> films. In particular, <strong>in</strong> crystall<strong>in</strong>e materials, s<strong>in</strong>ce the s<strong>in</strong>glet exciton diffusion constant<strong>in</strong>creases with molecular order, these decay channels acquire an important role. Furthermore,the s<strong>in</strong>glet-s<strong>in</strong>glet annihilation process is much stronger <strong>in</strong> crystall<strong>in</strong>e films than <strong>in</strong> disorderedmaterials, whereas s<strong>in</strong>glet-polaron and s<strong>in</strong>glet-triplet losses are usually weaker. So the s<strong>in</strong>glets<strong>in</strong>gletrecomb<strong>in</strong>ation process becomes the dom<strong>in</strong>ant nonradiative loss mechanism <strong>in</strong> thesematerials [75].Density-dependent effects are observed <strong>in</strong> our spectrally- and time-<strong>in</strong>tegrated measurementsof the spontaneous emission <strong>in</strong>tensity as a function of pump fluence. In Figure 5.12 (a) the<strong>in</strong>tegrated <strong>in</strong>tensity has been plotted as function of the estimated excitation density N 0 , for pumpfluence below the threshold of random las<strong>in</strong>g. The data refer to a region of the sample shown <strong>in</strong>Figure 5.1 where the threshold density is N th = 2×10 17 cm -3 .57
<strong>Light</strong> <strong>amplification</strong> <strong>in</strong> <strong>organic</strong> <strong>self</strong>-<strong>assembled</strong> <strong>nanoaggregates</strong>SI Intensity(a)Nth= 2 x 10 17 cm -3Photolum<strong>in</strong>escenceτ = 550ps(b)0 0.5 1.0 1.5Density N0/10 17 (cm -3 )0 200 400 600 800Time (ps)Fig. 5.12. (a): Black solid dots are experimental po<strong>in</strong>ts of spectrally- and time-<strong>in</strong>tegrated emission<strong>in</strong>tensity vs excitation density N 0 below threshold at temperature of 30 K; <strong>in</strong> red is the fit to theexperimental data, us<strong>in</strong>g equation (5.1). (b): Photolum<strong>in</strong>escence decay (black l<strong>in</strong>e) with its s<strong>in</strong>gleexponential fit (red l<strong>in</strong>e).The orig<strong>in</strong> of the sub-l<strong>in</strong>ear behavior is attributed to the bimolecular s<strong>in</strong>gle-s<strong>in</strong>gletannihilation process. An estimate of the bimolecular recomb<strong>in</strong>ation rate k ss has been obta<strong>in</strong>ed bythe data fitt<strong>in</strong>g shown <strong>in</strong> Figure 5.12 (a).If the optical excitation pulse-width is short compared to the decay time of the exciton, andneglect<strong>in</strong>g density dependent losses other than bimolecular recomb<strong>in</strong>ation process, than the rateequation for the excitons recomb<strong>in</strong>ation can be written as [38].dNdt=−k N − k Nwhere N is the s<strong>in</strong>glet exciton population density, k PL is the <strong>in</strong>verse of the observedphotolum<strong>in</strong>escence lifetime at low excitation density and k ss is the bimolecular recomb<strong>in</strong>ationrate.The measured time-<strong>in</strong>tegrated emission <strong>in</strong>tensity (S TI ) is proportional to the solution of therate equation:SPL⎛k N ⎞∫ + ⎟ (5.1)ss 0TI∝ N() t dt ≈ln⎜ 1⎝ kPL⎠where N 0 is the estimated s<strong>in</strong>glet exciton density at the time of excitation (t = 0).The value of k PL has been measured <strong>in</strong> a time resolved experiment us<strong>in</strong>g a streak cameraHamamatsu C5680 that, <strong>in</strong> comb<strong>in</strong>ation with a spectrometer, allows to make spectrally and timeresolved measurements with temporal resolution of about 2 ps. The sample is photopumpedwith excitation fluence Φ ≈ 0.1 nJ/cm 2 per pulse. The photolum<strong>in</strong>escence decay is shown <strong>in</strong>Figure 5.12 (b). The s<strong>in</strong>gle exponential fit (red l<strong>in</strong>e) gives a decay time of 550 ps, from whichwe f<strong>in</strong>d: k PL = 1.8 × 10 9 s -1 .ss258
Chapter 5: Random las<strong>in</strong>g and optical ga<strong>in</strong> <strong>in</strong> p-6P nanofibersFrom the fitt<strong>in</strong>g to the spectrally <strong>in</strong>tegrated <strong>in</strong>tensity (Figure 5.12 a), us<strong>in</strong>g the expressiongiven <strong>in</strong> the equation (5.1), we f<strong>in</strong>d k ss = (0.9 ± 0.2) × 10 -7 cm 3 s -1 . By compar<strong>in</strong>g data setsobta<strong>in</strong>ed <strong>in</strong> different positions of the sample, we determ<strong>in</strong>e that the value of the s<strong>in</strong>glet-s<strong>in</strong>gletannihilation rate k ss is:k ss = (0.3 – 1.1) × 10 -7 cm 3 s -1This high value of the bimolecular recomb<strong>in</strong>ation rate can be attributed to the highmolecular order of p-6P nanofibers film, and it is comparable to the value reported <strong>in</strong> literaturefor other crystall<strong>in</strong>e films as for example <strong>in</strong> tetracene s<strong>in</strong>gle crystals [76].5.3. <strong>Light</strong> <strong>amplification</strong> <strong>in</strong> s<strong>in</strong>gle p-6P nanofibersIn the previous section, the results of ensemble-averaged and spatially-resolvedmeasurements on films of close packed p-6P nanofibers, which optically <strong>in</strong>teract with eachother, have been discussed. The observed laser-like emission has been expla<strong>in</strong>ed <strong>in</strong> term ofrandom las<strong>in</strong>g <strong>in</strong> which the optical feedback necessary for laser action orig<strong>in</strong>ates from the fiber<strong>in</strong>homogeneities.In order to get a deeper knowledge about the <strong>in</strong>tr<strong>in</strong>sic emission properties of isolated <strong>self</strong><strong>assembled</strong>p-6P nanofibers, we studied different samples <strong>in</strong> which the p-6P needles are verysparse. Figure 5.13 shows an epifluorescence image of a 290×220 µm 2 region of one of thesesamples. The micrograph is taken us<strong>in</strong>g an <strong>in</strong>verted microscope Nikon with a cw arc lamp as theexcitation source <strong>in</strong> the spectral range of 330-380 nm. The p-6P nanofibers appear well isolatedand long several hundred micrometers.Fig. 5.13. 290×220 µm 2 epifluorescence image of isolated p-6P nanofibers.The samples shown <strong>in</strong> this section are grown by the group of Professor H. G. Rubahn(University of Odense, Denmark). The p-6P molecules are deposited on freshly cleaved59
<strong>Light</strong> <strong>amplification</strong> <strong>in</strong> <strong>organic</strong> <strong>self</strong>-<strong>assembled</strong> <strong>nanoaggregates</strong>muscovite mica substrate by vacuum sublimation at typical rate of 0.1 Å/s, under a dynamicvacuum of ≈ 2×10 -7 mbar and at substrate temperature of around 420 K.5.3.1. One dimensional random las<strong>in</strong>gFigure 5.14 (a) depicts the tapp<strong>in</strong>g-mode AFM topographic image of the surfacemorphology of a ≈ 5×5.5 µm 2 substrate area with sparse p-6P nanofibers. Here the typicalfeatures of isolated nanofibers <strong>in</strong> the length scale of a few micrometers can be noticed. Thenanofibers have a base width of 300 nm or larger, which enables waveguid<strong>in</strong>g of thespontaneous emission of p-6P beyond 400 nm (§ 3.5.2). The small islands ly<strong>in</strong>g betweenadjacent nanofibers are remnants of the nucleation process of p-6P <strong>in</strong>to oriented fibers,described <strong>in</strong> § 3.3.From Figure 5.14 (a), it can be noticed that the fibers are segmented by the occurrence ofcracks, which are typically 50 to 300 nm wide. Such th<strong>in</strong> brakes occur possibly at the end ofmaterial growth process, as a result of surface thermal gradient while the substrate is cool<strong>in</strong>gdown [77], or are due to an <strong>in</strong>stability similar to that verified <strong>in</strong> films of different functionalizedmolecules deposited on mica substrate [78].Fig. 5.14. (a): Gray scale AFM topographic image of a 5.5×5.5 µm 2 region of p-6P nanofibers grown onmuscovite mica. Black and white levels correspond to p-6P heights of 0 nm and 95 nm, respectively. (b):Epifluorescence image of a 95×70 µm 2 region of the same sample of panel (a).Breaks characterize most nanofibers <strong>in</strong> the analyzed samples, although it is possible to f<strong>in</strong>dregions of the samples with nearly break-free nanofibers. In addition to the material cracks,Figure 5.14 (a) shows that there exist sites of the nanofibers where sudden variations <strong>in</strong> its widthor height occur. These <strong>in</strong>homogeneities are also evident <strong>in</strong> the epifluorescence image shown <strong>in</strong>Figure 5.14 (b), made on the same sample. Bright spots of scattered lum<strong>in</strong>escence correspond tobreaks distributed along the nanofibers, as we will demonstrate <strong>in</strong> this section by correlatedoptical and topographic measurements.60
Chapter 5: Random las<strong>in</strong>g and optical ga<strong>in</strong> <strong>in</strong> p-6P nanofibersOptical emission properties of isolated nanofibers are studied with spatially- and spectrallyresolvedmeasurements, us<strong>in</strong>g the set-up described <strong>in</strong> chapter four (Figure 4.5).Las<strong>in</strong>g emission from isolated nanofibers is shown <strong>in</strong> Figure 5.15. Figure 5.15 (a) shows amicrograph of p-6P nanofibers emission taken with the spectrometer <strong>in</strong> imag<strong>in</strong>g mode, atexcitation fluence slightly above random las<strong>in</strong>g threshold. It displays both las<strong>in</strong>g andspontaneous emission from vertically aligned nanofibers and spontaneous emission from a setof neighbor<strong>in</strong>g nanofibers oriented approximately at 60 degrees with respect to the vertical axisof the detection system. These latter fa<strong>in</strong>tly appear <strong>in</strong> the lower part of the graph. Scatter<strong>in</strong>g ofthe las<strong>in</strong>g emission <strong>in</strong>to out-of-plane directions does not take place homogenously along thenanofibers’ axis; conversely, scatter<strong>in</strong>g is highly spotted, <strong>in</strong>dicat<strong>in</strong>g that waveguid<strong>in</strong>g is<strong>in</strong>terleaved with light scatter<strong>in</strong>g and outcoupled at special sites along the fibers.Figure 5.15 (b) reports the emission spectrum as a function of the excitation fluence Φ,relat<strong>in</strong>g to the ~100 µm long nanofiber placed at the center of the imag<strong>in</strong>g field of view <strong>in</strong>Figure 5.15 (a), e.g. positioned at X ≈ 30µm and extend<strong>in</strong>g vertically from Y ≈ 50µm to Y ≈150µm. The spectra refer to the emission spatially-<strong>in</strong>tegrated over the whole nanofiber length.Y position (µm)160 (a)14012010080604020(b)Φ(µJ/cm 2 ) = 25122Emission Intensity (a.u.)00 20 40 60X position (µm)420 430 440 450 460Wavelength (nm)Fig. 5.15. (a): Blue levels scale micrograph of optical emission <strong>in</strong>tensity of las<strong>in</strong>g lum<strong>in</strong>escent p-6Pnanofibers excited at pump fluence Φ = 15 µJ/cm 2 per pulse. (b): Emission spectra of the nanofiberpositioned at X ≈ 30 µm <strong>in</strong> panel (a) and extend<strong>in</strong>g vertically from Y ≈ 50 µm to Y ≈ 150 µm, fordifferent values of excitation fluence.Below threshold, spontaneous emission exhibits a broad vibronic progression with 0-1 and0-2 emission bands peaked near 425 nm and 450 nm, respectively. When the excitation fluence61
<strong>Light</strong> <strong>amplification</strong> <strong>in</strong> <strong>organic</strong> <strong>self</strong>-<strong>assembled</strong> <strong>nanoaggregates</strong>reach a threshold value of about 10 µJ/cm 2 per pulse (depend<strong>in</strong>g on the selected nanofibers),very narrow peaks (resolution-limited spectral width of 0.2 nm) emerge from the spontaneousemission spectrum at the 0-1 vibronic band of p-6P. The number of these spectral l<strong>in</strong>es<strong>in</strong>creases with <strong>in</strong>creas<strong>in</strong>g of pump fluence. This las<strong>in</strong>g behavior is very similar to that reported<strong>in</strong> the previous section for films of close-packed p-6P nanofibers. As <strong>in</strong> that case, it can beattributed to coherent random las<strong>in</strong>g. The large p-6P ga<strong>in</strong> bandwidth makes random las<strong>in</strong>gpossible also at the 0-2 vibronic peak (visible <strong>in</strong> Figure 5.15 b) with only slightly higherthreshold pump fluences.It is evident from the spectrally-resolved emission (Figure 5.15) that spontaneous emission<strong>in</strong>tensity sharply saturates for pump fluences larger than threshold fluence, <strong>in</strong> agreement withbasic laser theory for a s<strong>in</strong>gle emitter such as a s<strong>in</strong>gle nanofiber [79]. By contrast, we did notobserve this clamp<strong>in</strong>g of the total lum<strong>in</strong>escence <strong>in</strong>tensity <strong>in</strong> ensemble-average experiments, <strong>in</strong>which we collect the emission of many excited nanofibers that do not reach las<strong>in</strong>g threshold,contribut<strong>in</strong>g to the system response only with spontaneous emission.Correlation between the las<strong>in</strong>g properties and the morphological characteristic of isolated p-6P nanofibers allows us to ga<strong>in</strong> <strong>in</strong>sight <strong>in</strong>to the orig<strong>in</strong> of coherent optical feedback lead<strong>in</strong>g torandom las<strong>in</strong>g <strong>in</strong> <strong>in</strong>dividual nanofibers. Figure 5.16 (a) and (b) display the las<strong>in</strong>g micrograph ofthe selected isolated nanofiber and the emission <strong>in</strong>tensity profile along the fiber, respectively.The fiber is ~ 100 µm long and its scattered emission appears highly spotted.Fig. 5.16. (a): Blue levels scale image of las<strong>in</strong>g emission <strong>in</strong>tensity of an isolated p-6P nanofiber. (b):Spatial profile of las<strong>in</strong>g emission <strong>in</strong>tensity of the nanofiber shown <strong>in</strong> panel (a).62
Chapter 5: Random las<strong>in</strong>g and optical ga<strong>in</strong> <strong>in</strong> p-6P nanofibersIn order to understand the nature of the scatter<strong>in</strong>g centers evident <strong>in</strong> the emissionmicrograph, the morphology of the same fiber shown <strong>in</strong> Figure 5.16 has been studied. Figure5.17 (a) reports the gray-scale image of the topography of the selected nanofiber, taken with theatomic force microscope <strong>in</strong> tapp<strong>in</strong>g mode <strong>in</strong> air. The fiber mean height and width are ≈ 100 nmand ≈ 700 nm, respectively, and it is segmented by the occurrence of several breaks. Thedistances between consecutive crakes vary from 5 µm to 10 µm and they are 50 to 300 nm wide.It can be notice that the right side of the nanofiber (from X ≈ 75 µm to X ≈ 100 µm) appearsdivided <strong>in</strong> two nearly parallel <strong>in</strong>terconnected segments, form<strong>in</strong>g a double-fiber support foroptical waveguid<strong>in</strong>g.By zoom<strong>in</strong>g <strong>in</strong> on a smaller fiber region (Figure 5.17 b) and compar<strong>in</strong>g with thecorrespond<strong>in</strong>g emission profile (Figure 5.17 c), it turns out that the scatter<strong>in</strong>g of the las<strong>in</strong>gemission waveguided <strong>in</strong> the nanofibers occurs at the fiber breaks. In fact, excellentcorrespondence is found between the position of the las<strong>in</strong>g spots and that of the fiber breaks, asshown <strong>in</strong> Figure 5.17 (b) and (c).X (µm)(a)Y position (µm)(b)Intensitybreak 3break 2break 1(c)Y position (µm)Fig. 5.17. (a): Gray-scale AFM topographic image of the isolated nanofibers shown <strong>in</strong> the las<strong>in</strong>gmicrograph <strong>in</strong> Figure 5.16. Black and white levels correspond to fiber height of 0 nm and 95 nm,respectively. (b): AFM zoomed image of the nanofiber region marked by the white elliptical marker <strong>in</strong>panel (a). (c): Las<strong>in</strong>g emission <strong>in</strong>tensity profile of the zoomed region of the fiber.From the correlated spatially-resolved emission measurements and AFM measurements onthe same p-6P nanofiber we can conclude that the fiber breaks, that occur naturally dur<strong>in</strong>g the63
<strong>Light</strong> <strong>amplification</strong> <strong>in</strong> <strong>organic</strong> <strong>self</strong>-<strong>assembled</strong> <strong>nanoaggregates</strong>growth process, <strong>in</strong>troduce optical losses and partial back reflections of the waveguided las<strong>in</strong>gmodes at the <strong>in</strong>terfaces (where strong scatter<strong>in</strong>g occurs) and therefore, they are the ma<strong>in</strong> sourceof coherent optical feedback along the fiber axis responsible for one-dimensional random las<strong>in</strong>g<strong>in</strong> isolated nanofibers [80].Measurements made on other long isolated nanofibers (> 50-100 µm) show similar results.Most <strong>in</strong>dividual fibers of the samples that we have studied are segmented <strong>in</strong>to manyhomogenous sections by breaks. Figure 5.18 shows, as an example, another las<strong>in</strong>g nanofiber. As<strong>in</strong> the previous one, <strong>in</strong> these nanofibers the spatial distribution of the emission <strong>in</strong>tensity,scattered to out-of-plane directions towards collect<strong>in</strong>g optics, is highly <strong>in</strong>homogeneous (Figure18 a). Enhancement of emission scatter<strong>in</strong>g can be observed at the fiber break locations alreadybelow oscillation threshold, although the bright spot contrast <strong>in</strong>creases dramatically abovelas<strong>in</strong>g threshold due to the coherent nature and directionality of the emitted light (Figure 5.18b). The emission spectra as a function of the excitation fluence Φ (Figure 5.18 c) exhibit thetypical features of the coherent random las<strong>in</strong>g, even though at a threshold excitation fluence (≈50 µJ/cm 2 ) larger than that measured <strong>in</strong> the fiber previously shown.X position (µm)Y position (µm)0 40 80 120 160(a)(b)Emission Intensity (a.u.)(c) Φ (µJ/cm 2 ) = 1706733420 430 440 450 460Wavelength (nm)Fig. 5.18. Optical emission <strong>in</strong>tensity micrographs of las<strong>in</strong>g lum<strong>in</strong>escent p-6P nanofibers excited at pumpfluence of 33 µJ/cm 2 (a) and Φ = 170 µJ/cm 2 per pulse (b). (c): Time <strong>in</strong>tegrated emission spectra of thenanofiber placed at the centre of the X position range <strong>in</strong> panels (a) and (b), for different values ofexcitation fluence. The spectra are spatially <strong>in</strong>tegrated over the nanofiber region (from X ≈10µm to Y≈185µm).64
Chapter 5: Random las<strong>in</strong>g and optical ga<strong>in</strong> <strong>in</strong> p-6P nanofibersExperimentally, both the spectral and spatial pattern of the random modes are found to behighly reproducible over long time periods, so that we <strong>in</strong>fer that the nanofibers’ material andmorphology are robust aga<strong>in</strong>st persistent laser irradiation at the pump levels used for themeasurements.5.3.2 Theoretical model for1-D random las<strong>in</strong>gThe experimental results shown <strong>in</strong> the previous section are further supported by computersimulations of random optical spectra <strong>in</strong> one-dimensional nanostructures like our nanofibers.We used a theoretical model that relates to the propagation of a coherent optical field ofvariable wavelength through a nanofiber us<strong>in</strong>g the transfer-matrix approach described <strong>in</strong>Appendix A. Coherent propagation (with arbitrary material ga<strong>in</strong>) accounts for transmissionresonances which are the relevant channels for las<strong>in</strong>g [81]. Thus, a coherent propagation modelhighlights all the spectral features of las<strong>in</strong>g. Calculations are done for a one-dimensionalstructure, neglect<strong>in</strong>g cross-sectional (modal) effects. In the model structure, several materialslabs, simulat<strong>in</strong>g fiber segments, are separated by th<strong>in</strong> air gaps, which <strong>in</strong> turn stand for fiberbreaks (Figure 5.19).nanofibern=1.7n=1airgapzd fd aFig. 5.19. Nanofiber model used for numerical calculation with transfer matrix approach. d f is the fibersegment length while d a the air gap (<strong>in</strong> the selected nanofiber is: d ≈ 7µm and d ≈ 100nm).faThe refractive <strong>in</strong>dex step between the material (n ≈ 1.7 for p-6P [56]) and air causes partialback reflection of the (plane-wave) optical field at each material-air <strong>in</strong>terface. The <strong>in</strong>terfacetransfer matrix for the TM propagat<strong>in</strong>g mode is shown <strong>in</strong> Appendix A (A.10). <strong>Light</strong> scatter<strong>in</strong>g<strong>in</strong>to directions other than the fiber axis at the break locations is <strong>in</strong>troduced <strong>in</strong> the model <strong>in</strong> theform of l<strong>in</strong>ear ext<strong>in</strong>ction of the one-dimensionally propagat<strong>in</strong>g field through the air gaps.Therefore the propagation transfer matrix (A.8) is given by:65
<strong>Light</strong> <strong>amplification</strong> <strong>in</strong> <strong>organic</strong> <strong>self</strong>-<strong>assembled</strong> <strong>nanoaggregates</strong>Mp( λ, d, n,g)⎡ ⎛ 2πn g ⎞⎜i+ ⎟d⎤λ 2⎢⎝ ⎠e0 ⎥= ⎢ ⎥⎛ 2πn g ⎞⎢− ⎜i+ ⎟d⎥⎝ λ 2 ⎠⎢⎣0 e ⎥⎦where g represents the optical loss or the material ga<strong>in</strong> for the transfer matrix relative to thepropagation <strong>in</strong> the air gaps or <strong>in</strong> the fiber segments, respectively. Other optical losses such asmaterial reabsorption and waveguide scatter<strong>in</strong>g are compensated by ga<strong>in</strong>. The total loss actuallydeterm<strong>in</strong>es the spectral width of the coherent propagation modes. Simulations are carried outwith the structural data (deduced from the AFM) of the nanofiber shown <strong>in</strong> Figures 5.15-17, <strong>in</strong>terms of both material slab lengths and air gap widths. The <strong>in</strong>tensity spectrum of the coherentfield is calculated at specific break locations (break 1, 2, 3 of Figure 5.17) and compared to thelas<strong>in</strong>g emission spectrum measured at the same locations (Figure 5.20).(a)Experiment(b)TheoryEmission Intensity (a.u.)break 3break 2break 3break 2Emission Intensity (a.u.)break 1break 1420 425 430 420 425 430Wavelength (nm)Fig. 5.20. (a): Las<strong>in</strong>g emission spectra measured at the locations of the three nanofiber breaks shown <strong>in</strong>Figure 5.17. The pump fluence is 25 µJ/cm 2 per pulse. (b): Optical <strong>in</strong>tensity spectra calculated at the samefiber locations on the basis of a one-dimensional coherent propagation model us<strong>in</strong>g transfer-matrixformalism.The theoretical spectra are <strong>in</strong> qualitative agreement with the experimental ones, from whichwe <strong>in</strong>fer that the present model is able to describe the basics of las<strong>in</strong>g <strong>in</strong> a 1-D random system.In particular, the model reproduces the spectral density of the las<strong>in</strong>g l<strong>in</strong>es and accounts for<strong>in</strong>tensity variation of the peaks as a function of the position along the nanofiber. However,66
Chapter 5: Random las<strong>in</strong>g and optical ga<strong>in</strong> <strong>in</strong> p-6P nanofibers<strong>in</strong>clusion <strong>in</strong> the model of cross-sectional effects related to the propagation of light <strong>in</strong> the actualnanofiber is necessary to predict the position of the l<strong>in</strong>es and their relative <strong>in</strong>tensities.The <strong>in</strong>tensity spectrum is very sensitive to the shape of the nanofiber and to the structuralparameter (breaks length and distribution). The photonic sensitivity of an <strong>in</strong>dividual nanofibercan be estimated by <strong>in</strong>troduc<strong>in</strong>g a small structural perturbation an look<strong>in</strong>g at the emissionspectrum variation at some location <strong>in</strong> the nanofiber. For <strong>in</strong>stance, one can neutralize the<strong>in</strong>terference effects tak<strong>in</strong>g place at a given nanofiber break by fill<strong>in</strong>g its air gap with a materialof the same refractive <strong>in</strong>dex as p-6P. Figure 5.21 shows the <strong>in</strong>tensity spectrum of the randomlas<strong>in</strong>g emission calculated at a specific break location (solid black l<strong>in</strong>e), and the spectrumcalculated at the same po<strong>in</strong>t (red dotted l<strong>in</strong>e), when the nearest break, which is placed at adistance of a few micrometers, is optically neutralized.Calculated Intensity (a.u.)420 425 430Wavelength (nm)Fig. 5.21. Optical <strong>in</strong>tensity spectra at a break location (black solid l<strong>in</strong>e) calculated us<strong>in</strong>g the model basedon the transfer matrix formalism. The dotted red l<strong>in</strong>e displays the spectrum calculated at the same fiberbreak after optical neutralization of the nearest break.It can be seen that variation <strong>in</strong> <strong>in</strong>tensity larger than 100% occurs depend<strong>in</strong>g on the spectralmode. As a matter of fact, small structural perturbations (<strong>in</strong>duced, e.g., by physical or chemicalcontam<strong>in</strong>ations) can lead to huge changes <strong>in</strong> the nanofiber photonic response, thusdemonstrat<strong>in</strong>g that p-6P <strong>organic</strong> nanofibers have potential for active photonic sens<strong>in</strong>gapplications.67
<strong>Light</strong> <strong>amplification</strong> <strong>in</strong> <strong>organic</strong> <strong>self</strong>-<strong>assembled</strong> <strong>nanoaggregates</strong>5.3.3. Optical ga<strong>in</strong> <strong>in</strong> homogeneous nanofibersIn the previous sections, we showed the experimental results of spectrally- and spatiallyresolvedmeasurements <strong>in</strong> <strong>in</strong>terconnected and isolated p-6P nanofibers. We saw that theefficient recurrent scatter<strong>in</strong>g <strong>in</strong> the needle axis, caused by the fiber <strong>in</strong>homogeneities, realizesclose-loop paths for light <strong>amplification</strong> so that oscillation of random-las<strong>in</strong>g modes starts at verylow excitation fluences. We showed also experimental evidence of spectral narrow<strong>in</strong>g due ASEat higher pump fluences (Figures 5.6 and 5.8). However, random las<strong>in</strong>g phenomenology makesit difficult to retrieve <strong>in</strong>formation on the ga<strong>in</strong> properties related more closely to the <strong>in</strong> <strong>in</strong>tr<strong>in</strong>sicphotonic response of the p-6P nanofibers.In the samples we studied it is possible to f<strong>in</strong>d shorter homogenous nanofibers <strong>in</strong> which thecoherent oscillation is <strong>in</strong>hibited by remov<strong>in</strong>g the source of optical feedback. Therefore, thesebreak-free fibers are suitable to s<strong>in</strong>gle out the waveguided ASE process and to measure somefundamentals properties like the net modal ga<strong>in</strong> coefficient and the stimulated emission crosssection.Breakless fibers are <strong>in</strong>dividuated by check<strong>in</strong>g for the absence of <strong>in</strong>tense scatter<strong>in</strong>g spots<strong>in</strong> the optical emission patterns. Figure 5.22 displays the spatially-resolved emission <strong>in</strong>tensity ofsuch a nanofiber obta<strong>in</strong>ed with the lum<strong>in</strong>escence set-up <strong>in</strong> image configuration.130(a)(b)130Y position (µm)120110100120110100Y position (µm)9090405 410 415 405 410 415X position (µm)Fig. 5.22. Time <strong>in</strong>tegrated optical emission micrographs of an isolated p-6P nanofiber excited by ultrafastpulses, for a pump fluence of 75 µJ/cm 2 (a) and 370 µJ/cm 2 per pulse (b).Figure 5.22 (a), shows the emission micrograph at low excitation fluence (Φ = 75 µJ/cm 2 ).The fiber is ≈ 40 µm long and the scattered spontaneous emission appears rather homogenous.When the pump fluence is <strong>in</strong>creased above a threshold value, strong <strong>in</strong>crease <strong>in</strong> the scattered68
Chapter 5: Random las<strong>in</strong>g and optical ga<strong>in</strong> <strong>in</strong> p-6P nanofibers<strong>in</strong>tensity is detected at the fiber end regions (Figure 5.22.b). This behavior suggests that thewaveguided spontaneous emission is amplified along the nanofiber and outcoupled at the fibertips. The spectrally resolved <strong>in</strong>tensity measurements as a function of the excitation fluence,shown <strong>in</strong> Figure 5.23, confirm this analysis.Emission Intensity (a.u.)Φ (µJ/cm 2 ) = 750370240190150750-10-2420 430 440 450 460Wavelength (nm)Fig. 5.23. Time-<strong>in</strong>tegrated emission spectra of the nanofiber shown <strong>in</strong> Figure 5.22 for different values ofthe excitation fluence. The spectra are spatially <strong>in</strong>tegrated over the fiber region (from Y ≈ 88 nm to Y ≈128 nm of Figure 5.22).The emission spectra are quite different from those of the <strong>in</strong>homogeneous longer nanofibersshown <strong>in</strong> the previous sections. There is actually no evidence of las<strong>in</strong>g emission. Only weak<strong>in</strong>terference fr<strong>in</strong>ges spaced by ~ 0.4 nm are revealed on the 0-1 band. However, as expected <strong>in</strong>the case of ASE, the emission spectra exhibit l<strong>in</strong>e narrow<strong>in</strong>g for <strong>in</strong>creas<strong>in</strong>g pump fluence.Spectral narrow<strong>in</strong>g is revealed at both the 0-1 and the 0-2 vibronic bands of p-6P. At excitationfluence higher than about 350 µJ/cm 2 , ga<strong>in</strong> saturation effect on the 0-1 band is also evident.Figure 5.24 displays the spatially resolved (along Y direction) spectra taken <strong>in</strong> different Yposition of the nanofiber shown <strong>in</strong> Figure 5.22, for excitation fluence Φ = 370 µJ/cm 2 per pulse.The spectra are spatially <strong>in</strong>tegrated over a fiber region of 4 µm around the Y po<strong>in</strong>t <strong>in</strong>dicated <strong>in</strong>the Figure. These positions can be <strong>in</strong>dividuated <strong>in</strong> the micrograph shown <strong>in</strong> the <strong>in</strong>set of theFigure.69
<strong>Light</strong> <strong>amplification</strong> <strong>in</strong> <strong>organic</strong> <strong>self</strong>-<strong>assembled</strong> <strong>nanoaggregates</strong>Emission <strong>in</strong>tensity (a.u.)Y=91µmY=95µmY=100µmY=105µmY=112µmY position ( µm)13012011010090410 420 430 440 450 460 470Wavelength (nm)Fig. 5.24. Spatially resolved emission spectra, taken at different Y positions of the nanofiber shown <strong>in</strong>Fig. 5.22, for a pump fluence Φ = 370 µJ/cm 2 per pulse. The spectra are spatially <strong>in</strong>tegrated over a fiberregion of 4 µm around the Y po<strong>in</strong>t <strong>in</strong>dicated <strong>in</strong> the legend. Inset: Emission micrograph of the nanofiber atthe same pump fluence.The emission spectrum is spatially dependent: the spectral narrow<strong>in</strong>g due to ASE <strong>in</strong>creasesgo<strong>in</strong>g from the centre of the nanofiber (Y = 112 µm) to the tip (Y = 91 µm), because of the<strong>in</strong>crease <strong>in</strong> the <strong>amplification</strong> of the waveguided light. This effect is particularly evident for the0-2 emission band. In this spectral region actually, it can be seen ga<strong>in</strong> only on the end tips of thefiber.The lack of sharp spectral features implies the absence of coherent feedback <strong>in</strong> the fiberstructure, from which we <strong>in</strong>fer that the fiber tips are not characterized by very well def<strong>in</strong>edfacets. In order to retrieve the optical ga<strong>in</strong>, breakless fibers can thus be modeled as opticalamplifiers without feedback.Fig. 5.25 (a) shows the scattered emission <strong>in</strong>tensity profiles extracted from the micrographsreported <strong>in</strong> Figures 5.22 (a) and (b). While the emission profile is almost constant across thewhole nanofiber at low pump fluences, above the onset of spectral narrow<strong>in</strong>g the scattered<strong>in</strong>tensity is position dependent and <strong>in</strong>creases as the position approaches the end tips. This isconsistent with the ASE process as <strong>in</strong>ferred from spectral narrow<strong>in</strong>g. From the emissionspectrograms, we then generate two <strong>in</strong>dependent emission spatial profiles for the 0-1 and 0-2emission bands, shown <strong>in</strong> Fig. 4.25 (b).70
Chapter 5: Random las<strong>in</strong>g and optical ga<strong>in</strong> <strong>in</strong> p-6P nanofibersEmission Intensity (a.u.)(a)Φ1Φ2Φ2fit0-1 band0-2 band0-1 fit0-2 fit(b)Emission Intensity (a.u.)80 90 100 110 120 130 80 90 100 110 120 130Y position (µm)Fig. 5.25. Panel (a): Time and spectrally <strong>in</strong>tegrated spatial profiles of the emission <strong>in</strong>tensity of thenanofiber shown <strong>in</strong> Fig. 5.22, for two pump fluences: Φ 1 = 75 µJ/cm 2 per pulse (black l<strong>in</strong>e) and Φ 2 = 370µJ/cm 2 per pulse (blue l<strong>in</strong>e). Panel (b): Intensity profiles spectrally resolved for the 0-1 (black l<strong>in</strong>e) and 0-2 (blue l<strong>in</strong>e) vibronic bands, for a pump fluence of 750 µJ/cm 2 per pulse. The red dashed l<strong>in</strong>es <strong>in</strong> bothpanels are fits to the data us<strong>in</strong>g the formula exple<strong>in</strong>ed <strong>in</strong> the text. The fit curves are extended outside thenanofiber region for better visibility.To estimate the amount of net ga<strong>in</strong> <strong>in</strong> our nanofiber-based waveguide, we consider thatASE process, <strong>in</strong> one dimensional approximation, yields an output <strong>in</strong>tensity given by [82-84]:( λ)I( L, λ)= A Iwhere A(λ) is a constant related to the cross section for spontaneous emission, I p is the pump<strong>in</strong>tensity, L is the length of the amplify<strong>in</strong>g region and g net the net (modal) ga<strong>in</strong> coefficientdef<strong>in</strong>ed as:pgegnetgnet= Γg − αwhere g = σ SE N is the material ga<strong>in</strong> coefficient, Γ is the conf<strong>in</strong>ement factor of the optical( λ )<strong>in</strong>tensity <strong>in</strong>side the nanofiber, and α is the total propagation loss, consider<strong>in</strong>g material <strong>self</strong>absorptionand scatter<strong>in</strong>g by nanofibers surface roughness.netL−1( λ )71
<strong>Light</strong> <strong>amplification</strong> <strong>in</strong> <strong>organic</strong> <strong>self</strong>-<strong>assembled</strong> <strong>nanoaggregates</strong>Inside the nanofiber of length L, the total <strong>in</strong>tensity of the amplified light at a distance d(Figure 5.26) from a fiber tip will thus be:eI d = I d + I L−d∝T( ) ( ) ( )net ⋅( − )+ e − 2ggnet ⋅dg L dnetFig. 5.26. Nanofiber micrograph with <strong>in</strong>dicated the length L and the distance d between a generic po<strong>in</strong>t <strong>in</strong>the fiber and one tip.Be<strong>in</strong>g the <strong>in</strong>tensity profiles taken at pump fluence below the ASE onset uniform (Figure5.25 a), we can assume that the scatter<strong>in</strong>g efficiency is <strong>in</strong>dependent of position over the wholenanofiber length. Therefore the function I T (d) can be used for curve fitt<strong>in</strong>g to the measured<strong>in</strong>tensity spatial profiles, us<strong>in</strong>g g as a free parameter [85]. Fit curves for L = 40 µm are shown asthe dashed red l<strong>in</strong>es <strong>in</strong> Figures 5.25 (a) and (b), where the fiber tip regions are excluded fromthe fitt<strong>in</strong>g s<strong>in</strong>ce the scatter<strong>in</strong>g efficiency is strongly enhanced there. For the profiles relat<strong>in</strong>g tothe 0-1 and 0-2 bands at the highest pump fluence of 750 µJ/cm 2 per pulse, best fitt<strong>in</strong>g yields thenet ga<strong>in</strong> values:g 0-1 = (1250±100) cm -1g 0-2 = (750±100) cm -1ASE kicks <strong>in</strong> when the net ga<strong>in</strong> value is comparable to the <strong>in</strong>verse fiber length (i.e( ν) ⋅ = ⎡ ( ν) −α( ν) ⎤⋅ ≥1gnetL ⎣g ⎦ L ). That is the reason why the ASE threshold fluence <strong>in</strong> shortfibers is larger than that of random las<strong>in</strong>g <strong>in</strong> long fibers exhibit<strong>in</strong>g several breaks.Us<strong>in</strong>g the measured value of the net ga<strong>in</strong> an estimate of the stimulated emission crosssection(σ SE ) can be made. In the limit of l<strong>in</strong>ear absorption of the pump energy, the excitationdensity (N) created by each pulse, at the highest pump fluence, is estimated to be ~ 10 20 cm -3 .Further neglect<strong>in</strong>g population/ga<strong>in</strong> time relaxation, the stimulated emission cross-section (σ SE )of p-6P can be calculated from the relation [86, 87]:g = Γg − α =Γσ N − αnetSE72
Chapter 5: Random las<strong>in</strong>g and optical ga<strong>in</strong> <strong>in</strong> p-6P nanofibersThe optical conf<strong>in</strong>ement factor <strong>in</strong> typical p-6P nanofibers deposited on mica is estimated to be ~1%, while previous optical waveguid<strong>in</strong>g experiments <strong>in</strong> s<strong>in</strong>gly selected <strong>organic</strong> nanofibersyielded α ~ 100−300 cm -1 (see § 3.5.2 for more details).Us<strong>in</strong>g g net = 1200 cm -1 , Γ = 0.01, N = 10 20 cm -3 and α = 300 cm -1 , we obta<strong>in</strong>:σ SE ≈ 1.5 × 10 -15 cm 2 .Our estimate is supported by recent experimental reports of σ SE values as large as 10 -15 cm 2 <strong>in</strong>films of π-conjugated polymers [88] and 6 × 10 -16 cm 2 <strong>in</strong> polycrystall<strong>in</strong>e films of thiophenederivatives [89].73
<strong>Light</strong> <strong>amplification</strong> <strong>in</strong> <strong>organic</strong> <strong>self</strong>-<strong>assembled</strong> <strong>nanoaggregates</strong>74
CHAPTER 6CONCLUSIONSAND OUTLOOK6.1 Summary of resultsIn this thesis, random las<strong>in</strong>g and ga<strong>in</strong> properties of <strong>self</strong>-<strong>assembled</strong> <strong>organic</strong> nanofibers basedon highly crystall<strong>in</strong>e p-6P epitaxially grown on muscovite mica surface have been studied.The high polarization ratio of the emission and the high bimolecular recomb<strong>in</strong>ation ratefound <strong>in</strong> these samples demonstrate the high crystal order of the nanofibers and the preferentialalignment of the needles on the mica surface.In samples with close packed nanofibers coherent random las<strong>in</strong>g emission occurs atexcitation density as low as 0.5 µJ/cm -2 , <strong>in</strong> correspondence of the 0-1 and 0-2 bands of the p-6Pemission spectrum. The l<strong>in</strong>es spectral distribution and the threshold pump fluence of the randomlas<strong>in</strong>g emission depend strongly on the sample excitation region.Correlated spatially resolved photolum<strong>in</strong>escence measurements and atomic forcemorphological studies on isolated nanofibers have shown the one dimensional character ofrandom las<strong>in</strong>g <strong>in</strong> p-6P nanofibers. Coherent optical feedback is provided by multiple lightbackscatter<strong>in</strong>g at submicron-thick fiber breaks, generated dur<strong>in</strong>g the growth process, which75
<strong>Light</strong> <strong>amplification</strong> <strong>in</strong> <strong>organic</strong> <strong>self</strong>-<strong>assembled</strong> <strong>nanoaggregates</strong><strong>in</strong>terconnect contiguous fiber segments. Las<strong>in</strong>g starts when ga<strong>in</strong> balances losses for the resonantmodes.A theoretical model based on a one-dimensional transfer matrix method for lightpropagation along the fiber has been used to describe spectral resonances observed <strong>in</strong> randomlas<strong>in</strong>g <strong>in</strong> nanofibers. This model allows one to reproduce the spectral density of the las<strong>in</strong>g l<strong>in</strong>esand accounts for <strong>in</strong>tensity variation of the peaks as a function of the position along the nanofiberand of the structural parameters of the nanofibers.In addition to coherent random las<strong>in</strong>g, at higher excitation fluence, evidence of spectralnarrow<strong>in</strong>g due to amplified spontaneous emission (or, possibly <strong>in</strong>coherent random las<strong>in</strong>g) hasbeen shown on samples with close-packed nanofibers.In selected needles without breaks, the weaker light scatter<strong>in</strong>g leads to predom<strong>in</strong>antamplified spontaneous emission. Amplification of waveguided light <strong>in</strong> break-free nanofibers hasmade it possible to estimate the net optical ga<strong>in</strong> of a typical nanostructure as well as thestimulated emission cross-section, ~1.5 × 10 -15 cm 2 , which is close to the best values reportedfor <strong>organic</strong> materials used for laser application.6.2 Potential applications of <strong>self</strong>-<strong>assembled</strong> <strong>organic</strong> nanofibersPractical application of <strong>self</strong>-<strong>assembled</strong> <strong>organic</strong> nanofibers <strong>in</strong> photonics, optoelectronics, andrelated fields stems from a number of technological achievements, among which are (i) theability of controll<strong>in</strong>g the material aggregation process <strong>in</strong>to highly crystall<strong>in</strong>e nanofibers withsuitable morphological characteristics, so as to achieve the desired photonic response (i.e., wellcontrolledlas<strong>in</strong>g modes), and (ii) the possibility of transferr<strong>in</strong>g large number of homogeneousnanofibers onto substrates suitable for device realization (such as ITO, Si, and SiO 2 ), whileensur<strong>in</strong>g a high degree of needle orientation. Concern<strong>in</strong>g the transfer capability, encourag<strong>in</strong>gresults have already been obta<strong>in</strong>ed with <strong>self</strong>-<strong>assembled</strong> <strong>organic</strong> nanofibers from p-6P [90] andthiophene/p-phenylene co-oligomers [23]. Additional requirements depend on the specificapplication. In the follow<strong>in</strong>g, we briefly discuss potential applications of <strong>organic</strong> nanofibers <strong>in</strong>photonic sens<strong>in</strong>g and electrically-driven las<strong>in</strong>g.6.2.1. Prospect for electrically pumped p-6P las<strong>in</strong>gIn this section an estimate for the electrical current density which has to flow through thenanofibers film to achieve las<strong>in</strong>g threshold <strong>in</strong> cont<strong>in</strong>uous-wave (cw) operation are presented[91]. The current density, at a given exciton population density, is derived by impos<strong>in</strong>g that thetotal formation rate of s<strong>in</strong>glet excitons is equal to the total recomb<strong>in</strong>ation rate. The estimate is76
Chapter 6: Conclusions and outlookmade for the sample shown <strong>in</strong> Figure 5.1, where the lowest threshold densities have been found,and us<strong>in</strong>g for the s<strong>in</strong>glet-s<strong>in</strong>glet annihilation rate the value estimated <strong>in</strong> § 5.2. (k ss : ≈10 -7 cm 3 s -1 ).For the recomb<strong>in</strong>ation rate, density-dependent losses other than s<strong>in</strong>glet-s<strong>in</strong>glet annihilationare neglected. This approximation puts a lower limit to the threshold current density required forcw las<strong>in</strong>g. With<strong>in</strong> these approximations, the density of the s<strong>in</strong>glet excitons is determ<strong>in</strong>ed by therate equation [75]:dNξ J= −kN− + =dtξ + 1 ed20kssN0where k 0 is the radiative recomb<strong>in</strong>ation rate, J the current density, e the electron charge, andξ=1/3 is the s<strong>in</strong>glet-to-triplet generation ratio [92]. The thickness of the recomb<strong>in</strong>ation region dis set equal to the average thickness of the nanofibers (~ 110 nm).The variation <strong>in</strong> s<strong>in</strong>glet population density with current density J is shown <strong>in</strong> Figure 6.1.The m<strong>in</strong>imum measured threshold density N th = 6×10 16 cm -3 yields an equivalent thresholdcurrent density of J th = 3 kA/cm 2 .Density (cm -3 )10 16N th= 6 x 10 16 cm -3 3 kA/cm 210 17 10 100 1000 10 4 10 510 15current density (A/cm 2 )Fig. 6.1. Steady state s<strong>in</strong>glet density versus current density, calculated us<strong>in</strong>g k ss = 10 -7 cm 3 s -1 . Thehorizontal and vertical dashed red l<strong>in</strong>es <strong>in</strong>dicate the threshold density and the correspond<strong>in</strong>g currentdensity J th .Therefore to operate at a current density J < 1 kA/cm 2 , which should be susta<strong>in</strong>able <strong>in</strong> highmobility<strong>organic</strong> crystals [75], las<strong>in</strong>g should start at a density N th < 3×10 16 cm -3 . This limit isclose to the m<strong>in</strong>imum threshold density reported <strong>in</strong> our samples. Furthermore, this thresholdvalue is only a factor of three higher than the exciton density at which s<strong>in</strong>glet-s<strong>in</strong>gle annihilationprocess dom<strong>in</strong>ates the s<strong>in</strong>glet recomb<strong>in</strong>ation dynamics: N = k PL / k SS = 2 × 10 16 cm -3 .However, the question whether such current densities are susta<strong>in</strong>able <strong>in</strong> <strong>organic</strong> nanofibersbased on highly crystall<strong>in</strong>e materials such as p-6P calls for further experimental <strong>in</strong>vestigations.In fact, deep knowledge about, e.g., the electrode-<strong>in</strong>duced optical losses, the breakdown electric77
<strong>Light</strong> <strong>amplification</strong> <strong>in</strong> <strong>organic</strong> <strong>self</strong>-<strong>assembled</strong> <strong>nanoaggregates</strong>field, the thermal dissipation efficiency, and the effects of ambient conditions on materialdegradation, is necessary to assess the feasibility of electrically-pumped nanofiber-baseddevices <strong>in</strong> a quantitative way.6.2.2. Nanofiber-based photonic sens<strong>in</strong>gOptical <strong>in</strong>terrogation of m<strong>in</strong>iaturized devices based on suitable random media is currentlybe<strong>in</strong>g envisioned as an effective solution for enabl<strong>in</strong>g new encoded mark<strong>in</strong>g and remotemonitor<strong>in</strong>g capabilities for next-generation <strong>in</strong>formation technologies [93,94].To this regard, we showed <strong>in</strong> § 5.3.2 that random las<strong>in</strong>g emission is very sensitive tovariation <strong>in</strong> structural characteristics of the nanofibers, e.g., position, distance, and width of thebreak-<strong>in</strong>duced air gaps. Simple model calculations allow us to prove the concept that small localperturbations (<strong>in</strong>duced, e.g., by chemical contam<strong>in</strong>ation) can lead to huge changes <strong>in</strong> thecoherent optical spectrum of a nanofiber.We add that surface adsorption of molecular species <strong>in</strong> nanofibers <strong>assembled</strong> from suitablyfunctionalized oligomers [78] could generate photonic chemosens<strong>in</strong>g, e.g., by modulation of theeffective <strong>in</strong>dex of the nanofiber propagation modes. Operation at the onset of random las<strong>in</strong>gshould lead to <strong>in</strong>creased sensitivity of nanofiber-based sensors [95].Thus, we suggest that there is potential for <strong>self</strong>-<strong>assembled</strong> <strong>organic</strong> nanofibers for photonicsens<strong>in</strong>g applications, e.g., for position sensors.6.2 Interplay among <strong>in</strong>termolecular excitonic coupl<strong>in</strong>g, exciton-phononand exciton-photon <strong>in</strong>teractions <strong>in</strong> H-aggregates: an unresolved issue.In the second chapter of this thesis, we have reviewed the unusual emission properties of H-aggregates <strong>in</strong> terms of a model Hamiltonian developed by Spano for p<strong>in</strong>wheel aggregates. Thiswas done with the aim of provid<strong>in</strong>g a sound theoretical framework to identify the predom<strong>in</strong>antemission transitions close to the optical gap. Spano's theoretical effort stems from the idea to<strong>in</strong>clude the three basic excited-state <strong>in</strong>teractions <strong>in</strong> molecular aggregates: exciton <strong>in</strong>termolecularcoupl<strong>in</strong>g, exciton-phonon and exciton-photon <strong>in</strong>teractions. The emerg<strong>in</strong>g physical picture iswell described by Figure 2.7, from which we try to s<strong>in</strong>gle out here the follow<strong>in</strong>g three ma<strong>in</strong>messages:1) The 0-0 excitonic transition is weak or dipole-forbidden; whatever is the mechanismprovid<strong>in</strong>g a f<strong>in</strong>ite transition dipole, the emission becomes superradiant. This latter conceptmeans that the 0-0 radiative rate scales as the coherence volume of the exciton. This generalrule should hold: the stronger the excitonic coupl<strong>in</strong>g, the larger the excitonic volume.2) The 0-p vibronic replicas are dipole allowed, and polarized along the c crystal axis.78
Chapter 6: Conclusions and outlook3) The overall <strong>in</strong>tensity of the vibronic replicas results from the competition between<strong>in</strong>termolecular excitonic coupl<strong>in</strong>g and exciton-phonon <strong>in</strong>teraction. When the strength of thelatter <strong>in</strong>teraction predom<strong>in</strong>ates, the <strong>in</strong>tensity of vibron emissions as well as their emissioncross section approach the ones characteristic of the isolated molecule. In the opposite,strong excitonic coupl<strong>in</strong>g regime, the generalized Franck-Condon factor is close to one, andconsequently, phonon emission becomes much weaker; the overall light emission quantumyield should be also much smaller than that observed <strong>in</strong> s<strong>in</strong>gle oligomer.In p-6P, we have found an extraord<strong>in</strong>ary large emission cross section at the 0-1 phononemission peak, coherently with the observed high emission quantum yield (~ 30 % [47]). Thesedata suggests that p-6P is <strong>in</strong> the weak excitonic coupl<strong>in</strong>g regime. Referr<strong>in</strong>g to Figure 2.7, wecould estimate an adimensional excitonic coupl<strong>in</strong>g parameter f ~ 10 -1 -10 -2 , whereas Spano'scalculations <strong>in</strong> p<strong>in</strong>wheel aggregates rather <strong>in</strong>dicate f ~ 1, with a quantum yield around 1% [36].This large discrepancy <strong>in</strong> the prediction of the actual radiative decay rate of H-aggregates,which <strong>in</strong> other words also means the impossibility to assess whether the excitonic coupl<strong>in</strong>g is <strong>in</strong>the strong or weak coupl<strong>in</strong>g regime, is <strong>in</strong>deed arduous to expla<strong>in</strong> and deserves furthertheoretical and experimental <strong>in</strong>vestigations.One could claim that disorder tends to localize the excitonic wavefunction, which could alsobe at the orig<strong>in</strong> of the detection of the 0-0 spontaneous emission, otherwise symmetry forbidden<strong>in</strong> p-6P. However, this consideration appears <strong>in</strong> contrast with experimental data <strong>in</strong> otheroligomer crystals. Specifically, the measured quantum yield of high quality s<strong>in</strong>gle crystals ofsexithiophene, with negligible structural disorder [96] and no violation of the emission selectionrules [97], is comparable to that of the non-<strong>in</strong>teract<strong>in</strong>g molecule.More <strong>in</strong>sight on this basic physical issue could be provided by the experimental measure ofthe excitonic wavefunction delocalisation, namely, the coherent volume of the exciton [98].79
<strong>Light</strong> <strong>amplification</strong> <strong>in</strong> <strong>organic</strong> <strong>self</strong>-<strong>assembled</strong> <strong>nanoaggregates</strong>80
Appendix AAppendix ATransfer Matrix MethodConsider a planar structure makes of different layers of given f<strong>in</strong>ite thickness, <strong>in</strong>f<strong>in</strong>ite x-yextension, and parallel to the z axis (Figure A.1). Suppose each layer made of homogenousmaterials with uniform, frequency dependent dielectric constant, which differ from layer tolayer. The whole structure is thus planar and translational <strong>in</strong>variant along the plane. Thepropagation of a monochromatic electric field at frequency ω, <strong>in</strong> absence of charge or currentdensity, is described by the Helmholtz wave equations [70]:→ → 22 ω→ →2 ε ( )⎛ ⎞ ⎛ ⎞∇ E⎜r, z⎟+z E⎜r,z⎟= 0(A.1)⎝ ⎠ c ⎝ ⎠where→ris the <strong>in</strong> plane position vector.zxε(z)Fig. A.1. Example of multilayered dielectric structure with the correspond<strong>in</strong>g dielectric constant profileε(z).Because of the <strong>in</strong>-plane translational <strong>in</strong>variance, the solutions of the equation (A.1) areplane waves along the <strong>in</strong>-plane direction. For each given <strong>in</strong>-plane wave vectorpolarization we can write:→k //and81
Ligth <strong>amplification</strong> <strong>in</strong> <strong>organic</strong> <strong>self</strong>-<strong>assembled</strong> <strong>nanoaggregates</strong>→ →⎛ ⎞E→ ⎜r,z⎟= ε → U→z ek // ⎝ ⎠ k // k // , ω→ →⋅ rik//( )(A.2)where εkr is the polarization vector. Replac<strong>in</strong>g <strong>in</strong>to equation (A.1) we get a one dimentionalproblem for the mode function U2dU( z)→ :k // , ω→2k // , ω ω 2+2 ⎜ 2 ε − //dz⎛⎝ c⎞⎟⎠( z) k U→( z)k // ,ω= 0(A.3)This equation may be separately solved <strong>in</strong> each homogeneous layer. The solution for a layerwith dielectric constant ε is:→→⎛ ⎞ −ikzz ⎛ ⎞U→( z)= El⎜k // ⎟e + Er⎜k // ⎟ek // , ω ⎝ ⎠ ⎝ ⎠ikzz(A.4)withk z2ω =22 ε −k // . El and E r are complex coefficients which have to be determ<strong>in</strong>ed bycimpos<strong>in</strong>g the proper boundary conditions at the <strong>in</strong>terface between two layers. This task can bemade easily with<strong>in</strong> the transfer matrix approach.(1) (2)1E r2E r1E l2E lFig. A.2. Field propagat<strong>in</strong>g across the <strong>in</strong>terface between two layers (1) and (2) of a planar structure.zWe can def<strong>in</strong>e for each position z <strong>in</strong> space a two dimensional vector, with components given bythe two coefficients <strong>in</strong> (A.4):⎡E⎤r⎢⎣El⎦ ⎥ (A.5)We drop the k → // -dependence of El and E r s<strong>in</strong>ce the problem is separate <strong>in</strong> k r // -space. For anarbitrary structure, like that shown <strong>in</strong> Figure A.2, we can write the field <strong>in</strong> the form (A.2) foreach z position of the two given layers (1) and (2). The boundary conditions at the <strong>in</strong>terface82
Appendix Abetween the layers will result <strong>in</strong> a l<strong>in</strong>ear relation between the coefficients of the field <strong>in</strong> the tworegions, which can be written as:⎡ ( 2)( 21) ( 21)() 1E ⎤ ⎡r M11 M ⎤⎡12 E ⎤r⎢ ⎥ = ⎢ ⎥⎢⎥(A.6)( 2)( 21) ( 21)() 1⎢⎣E⎥l ⎦⎢⎣M12 M ⎥⎢12 ⎦⎣E⎥l ⎦The matrix M (21) thus def<strong>in</strong>ed is the <strong>in</strong>terface transfer matrix of the structure we are consider<strong>in</strong>g.The most important property of transfer matrix is that they can be composed to obta<strong>in</strong> transfermatrix of complex structures. This means that, given for example the structure shown <strong>in</strong> FigureA.3, characterized by transfer matrixes M (21) and M (32) , the transfer matrix of the overallstructure is simply M (31) = M (21) M (32) , and the coefficient of the field <strong>in</strong> a z position of the region(3) are related to those <strong>in</strong> the layer (1) by the relaction:⎡ ( )E ⎤ ⎡⎢ ⎥ ⎢⎢⎣E⎥⎦⎢⎣() ⎤⎥⎥⎦3 1r( 31)Er= M( 3)() 1lEl(A.7)Hence, start<strong>in</strong>g from the matrices for the simplest element, namely the homogeneous layerof a given thickness and the simplest <strong>in</strong>terface, one can derive the wave propagation forarbitrarily complex layered structures.(1) (2) (3)1E r2E r3E r1E l2E l3E lz 1 z 2zFig. A.3. Field propagat<strong>in</strong>g on a multilayered structure.It can be shown that the transfer matrix correspond<strong>in</strong>g to the propagation from z 1 to z 2 <strong>in</strong>homogeneous medium (Figure A.3) is given by [99]:Mhom⎡ikz( z2−z1)e0 ⎤= ⎢⎥(A.8)⎢−ikz( z2−z1)⎣ 0 e ⎥ ⎦The transfer matrix for an <strong>in</strong>terface between two dielectric layers with refraction <strong>in</strong>dex n 1and n 2 , is different for the two different polarizations TE (Transverse Electric) and TM(Transverse Magnetic) of the electromagnetic field. Apply<strong>in</strong>g the Maxwell boundary condition,it can be shown that the <strong>in</strong>terface transfer matrix for the TE polarization is given by:83
Ligth <strong>amplification</strong> <strong>in</strong> <strong>organic</strong> <strong>self</strong>-<strong>assembled</strong> <strong>nanoaggregates</strong>MTEwhile for the TM polarization is:⎡ ( 2) ( 1)( 2) ( 1)kz + kz kz −k⎤z⎢( 2)( 2)⎥⎢ 2kz2kz⎥= ⎢ ( 2) ( 1)( 2) ( 1)⎥⎢kz − kz kz + kz⎥⎢ ( 2)( 2)2kz2k⎥⎣z ⎦(A.9)MTM⎡ ( 2) ( 1) ( 2) ( 2)( 2) ( 1) ( 2) ( 2)n2 kz + n1 kz n2 kz −n1k ⎤z⎢( )( )⎥2 2⎢ 2nn 1 2kz2nn 1 2kz⎥= ⎢ ( 2) ( 1) ( 2) ( 2)( 2) ( 1) ( 2) ( 2)⎥⎢n2 kz − n1 kz n2 kz + n1kz⎥⎢( 2)( 2)2nn 1 2kz2nn 1 2k⎥⎣z ⎦(A.10)Here2ω ε( j)=22 −k // , where j = 1, 2 <strong>in</strong>dicate the left and right side of material, respectively,ck z jand n j = ε j .84
AcknowledgementsFirst of all I want to thank my advisors Prof. Giovanni Bongiovanni and Prof.Andrea Mura for giv<strong>in</strong>g me the possibility to do a Ph.D. <strong>in</strong> their research group andfor the constant support.Especially thanks to Francesco Quochi, without whom this work would havebeen impossible to carry out.Thank also to all the colleagues and other persons that collaborated with me <strong>in</strong>all these three years.R<strong>in</strong>grazio <strong>in</strong>f<strong>in</strong>e la mia famiglia e tutti i miei amici per non avermi mai fattomancare il loro supporto.Fabrizio CordellaNovember 200585
BibliographyBibliography[1] V. Podzorov, E. Menard, A. Borissov, V. Kirukh<strong>in</strong>, J.A. Rogers, and M.E. Gershenson,Phys. Rev. Lett. 93, 086602 (2004).[2] M. Bergreen, A. Dodabalapur, R.E. Slusher, and Z. Bao, Nature 389, 466 (1997).V.G. Kozlov, V. Bulovic, P.E. Burrows, and S. R. Forrest, Nature 389, 362 (1997). V.Bulovic, V.G. Kozlov, S.R. Khalf<strong>in</strong>, and S. R. Forrest, Science 279, 553 (1998) D.Schneider, T. Rabe, T. Riedl, T. Dobbert<strong>in</strong>, M. Kröger, E. Becker, H.H. Johannes, W.Kowalsky, T. Weimann, J. Wang,P. H<strong>in</strong>ze, A. Gerhard, P. Stossel, and H Vestweber, Adv.Mater. 17, 31 (2005). M. Anni, S. Lattante, R. C<strong>in</strong>golani, G. Gigli, and G. Barbarella,Appl. Phys. Lett., 83, 2754 (2003).). D. Pisignano, M. Anni, G. Gigli, R. C<strong>in</strong>golani, M.Zavelani-Rossi, G. Lanzani, G. Barbarella, and L. Favaretto, Appl. Phys. Lett. 81, 3534(2002). H. Yanagi, A. Yoshiki, S. Hotta, and S. Kobayashi, J. Appl. Phys. 96, 4240(2004). H. yamamoto, T. Oyamada, H. Sasabe, and C. Adachi, Apll. Phys. Lett. 84, 1401(2004).[3] M. D. Ward, MRS Bullet<strong>in</strong> 30, 705 (2005).[4] S. Innotta, T. Toccoli, J. Polymer Sci. B 41, 2501 (2003). L. Casalis, M.F.Danisman, B.Nickel, G. Braco, T. Toccoli, S. Innotta, and G. Scoles, Phys. Rev. Lett. 90, 206101(2003).[5] H.J. Brouwer, V. V. Krasnikov, T. A. Pham, R. E. Gill, and G. Hadziioannou, Appl. Phys.Lett. 73, 708 (1998).[6] Y. Huang, G.T. Paloczi, J.K.S. Poon, A. Yariv, Adv. Mater. 16, 44 (2004).[7] J.G.C. Ve<strong>in</strong>ot, H. Yan, S.M. Smith, J. Cui, Q. Huang, T.J. Marks, Nano Lett. 2, 333(2002).[8] C.-Y. Chao, L.J. Guo, Appl. Phys. Lett. 83, 1527 (2003).[9] G. Ziegler <strong>in</strong>: Hanbook of <strong>organic</strong> conductive molecules and polymers, Vol 3 (Ed. H.S.Nalwa), Wiley, New York, 1997, ch 13.[10] R. Resel, Th<strong>in</strong> Solid Films, 433, 1 (2003).[11] M. Br<strong>in</strong>kmann, S. Graff, C. Straupe, J.-C. Wittmann, C. Chaumont, F. Nuesch, A. Aziz,M. Shaer, and L. Zuppiroli, J. Phys. Chem. B, 107, 10531 (2003).87
<strong>Light</strong> <strong>amplification</strong> <strong>in</strong> <strong>organic</strong> <strong>self</strong>-<strong>assembled</strong> <strong>nanoaggregates</strong>[12] B. Krause, A.C. Dur, K. Ritley, F. Schreiber, H. Dosch, and D. Smilgies, Phys. Rev. B, 66,235404 (2002).[13] F. Balzer, H.-G. Rubahn, Adv. Func. Mater. 15, 17 (2005).[14] A. Andreev, G. Matt, C.J. Brabec, H. Sitter, D. Badt, H. Seyr<strong>in</strong>ger, N.S. Sariciftci, Adv.Mater. 12, 629 (2000).[15] H. Yanagi, S. Okamoto, Appl. Phys. Lett. 71, 2563 (1997).[16] H. Plank, R. Resel, S. Purger, J. Keckes, A. Thierry, B. Lotz, A. Andreev, N.S. Sariciftci,and H. Sitter, Phys. Rev. B 64, 235423 (2001).[17] F. Balzer, J. Beermann, S.I. Bozhevolnyi, A.C. Simonsen, and H.-G. Rubahn, Nano Lett.3, 1311 (2003).[18] H. Yangi, T. Morikawa, and S. Hotta, Appl. Phys. Lett. 81, 1512 (2002).[19] M. Ichikawa, H. Yanagi, Y. Shimizu, S. Hotta, N. Suganuma, T. Koyama, Adv. Mater. 14,1272 (2002). H. Yanagi, Y Araki, T Ohara, S. Hotta, M.M. Ichikawa, Y. Taniguchi, Adv.Func. Mater. 13, 767 (2003).[20] K. Takazawa, Y. Kitahama, Y. Kimura, and G. Kido, Nano Lett. 5, 1293 (2005).[21] M. Boncheva and G.M. Whitesides, MRS Bullet<strong>in</strong> 30, 736 (2005).[22] F. Balzer, V.G. Bordo, AC. Simonsen and H.G. Rubahn, Appl. Phys. Lett. 82, 10 (2003).[23] H. Yanagi, T Ohara, and T. Morikawa, Adv. Mater. 13, 1452 (2001).[24] F. Balzer, K. Al Shamery, R. Neuendorf, and H.-G. Rubahn, Chem. Phys Lett. 368, 307(2003).[25] H. Yanagi, A. Yoshiki, S. Hotta, and S. Kobayashi, J. Appl. Phys. 96, 4240 (2004). H.Yanagi, and A. Yoshiki, Appl. Phys. Lett. 84, 4783 (2004).[26] A. C. Simonsen and H.G. Rubahn, Nano Lett. 2, 1379 (2002).[27] S.V. Frolov, M. Ozaki, W. Gellermann, K. Yosh<strong>in</strong>o, and Z.V. Vardeny, Phys. Rev. Lett.78, 729 (1997).[28] H. Cao <strong>in</strong> Las<strong>in</strong>g <strong>in</strong> random media, Institute of Physics publish<strong>in</strong>g, Waves Random Media13, R1 (2003).[29] H. Cao, J.Y. Xu, S.T. Ho, and S.-H. Chang, Phys. Rev. Lett. 82, 2278 (1999).[30] S.F. Yu, C. Yuen, S.P. Lou, WI. Park, and G.-C. Yi Appl. Phys Lett. 84, 3241 (2004).[31] S.P. Lau, H.Y. Yang, S.F. Yu, H.D. Li, M. Tenemura, T. Okita, H. Hatano, and H.H. Hng,Appl. Phys. Lett. 87, 013104 (2005).[32] B.Q. Sun, M. Gai, Q. Gao, H.H. Tan, C. Jagadish, L. Ouyang, J. Zou, Appl. Phys. Lett. 93,5855 (2003)[33] S.V. Frolov, Z.V. Vardeny, K. Yosh<strong>in</strong>o, A. Zakhidov, and R.H. Baughman, Phys. Rev. B59, 5284 (1999). R.C. Polson and Z.V. Vardeny, Phys. Rev. B. 71, 045205 (2004).88
Bibliography[34] R.C. Polson and Z.V. Vardeny, Appl. Phys. Lett. 85, 1289 (2004).[35] R.C. Polson and Z.V. Vardeny, Appl. Phys Lett. 85, 1892 (2004). R.C. Polson, J.D. Huangand Z.V. Vardeny, Synth Meth. 119, 7 (2001).[36] M. Anni, S. Lattante, R. C<strong>in</strong>golani, G. Gigli,G. Barbarella, and F. Favaretto Appl. Phys.Lett., 83, 2754 (2003).[37] H. Cao, J.Y. Xu, D.Z. Zang, S.-H. Chang, S.T. Ho, E.W. Seel<strong>in</strong>g, X. Liu, and R.P.H.Chang, Phys. Rev. Lett. 84, 5584 (2000).[38] M. Pope, C.E. Swenberg, Electronic Processes <strong>in</strong> Organic Crystals and Polymers (OxfordUniversity Press, New York, 1999).[39] A.S. Davydov, Theory of molecular excitons, (Plenum Press, New York, 1971).[40] L. Antol<strong>in</strong>i, G. Horovitz, F. Kouki and F. Garnier, Adv. Mater. 10, 382 (1998).[41] G.P. Charbonneau and Y. Delugeard, Acta Crystallogr. B: Struct. Crystallogr. Cryst.Chem. 33, 1586 (1977).[42] L. Claes, J.P. François, and M.S. Deleuze, Chem. Phys. Lett. 339, 216 (2001).[43] B.S. Hotta and K. Waragai, Adv. Mater. 5, 896 (1993).[44] S. Guha, W. Graupner, R. Resel, M. Chandrasekhar, H. R. Chandrasekhar, R. Glaser, andG. Leis<strong>in</strong>g, Phys Rev. Lett. 82, 3625 (1999).[45] J. Stampfl, S. Tasch, G. Leis<strong>in</strong>g, and U.Scherf, Syth. Met. 71, 2125 (1995).[46] S.V. Frolov, Ch. Kloc, B. Batlogg, M. Wohlgenannt, X Jiang, and Z.V. Vardeny, Phys.Rev. B 63, 205203 (2001).[47] A. Piaggi, G. Lanzani, G. Bongiovanni, A. Mura, W. Graupner, F. Meghdadi, G. Leis<strong>in</strong>g,and M. Nisoli, Phys. Rev. B 56, 10133 (1997).[48] F.C. Spano, and S. Siddiqui, Chem. Phys. Lett. 314, 481 (1999).[49] F.C. Spano, Chem. Phys. Lett. 331, 7 (2000).[50] F.C. Spano, J. Chem. Phys. 114, 5376 (2001).[51] F.C. Spano, J. Chem. Phys. 116, 5877 (2002).[52] P. Pushnig and C. Ambrosh-Draxl, Phis. Rev. B 60, 7891 (1999). W. Graupner, F.Meghdadi, G. Leis<strong>in</strong>g, G. Lanzani, M. Nisoli, S. De Silvestri, W. Fischer, and F. Stelzer,Phys. Rev. B 56, 128 (1997). D.J. Gundlach, Y.Y. L<strong>in</strong>, T.N. Jackson, and D.G. Shlon,Appl. Phys. Lett. 71, 3853 (1997).[53] K.N. Baker, A.V. Fratt<strong>in</strong>i, T. Resch, H.C. Knachel, W.W. Adams, E.P. Socci, and B.L.Farmer, Polymer 34, 1571 (1993).[54] D. Schneider, T. Rabe, T. Riedl, T Dobbert<strong>in</strong>, M. Kröger, E. Becker, H.-H. Johannes, andW. Kowalsky, J. Appl. Phys. 98, 043104 (2005).[55] F. Balzer, H.-G. Rubahn, Appl. Phys. Lett. 79, 3860 (2001).89
<strong>Light</strong> <strong>amplification</strong> <strong>in</strong> <strong>organic</strong> <strong>self</strong>-<strong>assembled</strong> <strong>nanoaggregates</strong>[56] F. Balzer, V.G. Bordo, AC. Simonsen and H.G. Rubahn, Phys. Rev. B 67, 115408 (2003).[57] F. Balzer, H.-G. Rubahn, Nano Lett. 2, 747 (2002)[58] A. Andreev, H. Sitter, C.J. Brabec, P. H<strong>in</strong>terdorfer, G. Spr<strong>in</strong>gholz, N.S. Sariciftci, Synth.Met. 121, 1379 (2001). H. Plank, R. Resel, A. Andreev, N.S. Sariciftci, H. Sitter, J.Crystal Growth 237-239, 2076 (2002).[59] A. Andreev, F. Quochi, F. Cordella, A. Mura G. Hlawacek, G. Bongiovanni, H. Sitter; C.Teichert, and N.S. Sariciftci, J. Appl. Phys, <strong>in</strong> pr<strong>in</strong>t.[60] H. Plank, R. Resel, H. Sitter, A. Andreev, N.S. Sariciftci, G. Hlawacek, C. Teichert,A.Thierry, B.Lotz, Th<strong>in</strong> Solid Films 443, 108 (2003).[61] E.W. Radoslovich, Acta Cryst. 13, 919 (1960).[62] H. Plank, R. Resel, A. Andreev, N.S. Sariciftci, and H. Sitter, J. Cryst. Growth 237-239,2076 (2002).[63] H. Plank, R. Resel, S. Purger, J. Keckes, A. Thierry, B. Lotz, A. Andreev, N.S. Sariciftci,and H. Sitter, Phys. Rev. B 64, 235423 (2001).[64] K. Muller and C. Chang, Surf. Sc. 9, 458 (1968).[65] F. Balzer, L. Kankate, H. Nieus H.-G. Rubahn, Proceed<strong>in</strong>g SPIE 5925, 9 (2005).[66] Y. Kuwahara, Phys. Chem. M<strong>in</strong>. 28, 1 (2001).[67] F. Balzer, L. Kankate, H. Nieus, and H.-G. Rubahn, Proceed<strong>in</strong>g SPIE 5724, 285 (2005).[68] P. Avouris, T. Hertel, R. Martel, T. Schmidt, H.R. Shea, and R.E. Walkup, Appl. Surf. Sc.141, 201 (1999)[69] H. Yangi, T. Ohara, and T. Marikawa, Adv. Mater. 13, 1452 (2001).[70] J.D. Jackson <strong>in</strong> Classical Electrodynamics (John Wiley and son, Inc. 1975).[71] V.S. Volkov, S.I. Bozhevolnyi, V.G. Bordo, and H.-G. Rubahn, Journal of Microscopy215, 241 (2004).[72] V.G. Bordo, private comunication.[73] F. Quochi, F. Cordella, R. Orrù, J.E. Communal, P. Verzeroli, A. Mura, G. Bongiovanni,A. Andreev, H. Sitter, and N.S. Sariciftci, Appl. Phys. Lett., 84, 4454 (2004).[74] G. Ihle<strong>in</strong>, F. Shüth, O. Kraub, U. Vietze, and F. Laeri, Adv. Mater. 10, 1117 (1998).[75] M.A. Baldo, R.J.Holmes, and S.R. Forrest, Phys Rev B 66, 035321 (2002)[76] A.J. Campillo, R.C. Hyer, S.L. Shapiro, and C.E. Swenberg, Chem. Phys. Lett. 48, 495(1977).[77] F. Balzer, and H.G. Rubahn, Appl. Phys. Lett. 79, 3860 (2001).[78] M Schiek, A. Lützen, R. Koch, K. Al-Shamery, F. Balzer, R. Frese, and H.G. Rubahn,Appl. Phys. Lett. 86, 153107 (2005).[79] O. Svelto, Pr<strong>in</strong>ciples of Lasers (Plenum Press, New York and London, 1998).90
Bibliography[80] F. Quochi, F. Cordella, A. Mura, , G. Bongiovanni, F. Balzer, and H.G. Rubahn, J. Phys.Chem. B 109, 21690 (2005).[81] A.L. Bur<strong>in</strong>, M.A. Ratner, H. Cao, and S.H. Chang, Phys. Rev. Lett. 88, 093904 (2002).[82] Y. Sorek and R. Reisfeld, Appl. Phys. Lett. 66, 1169 (1995). K.L. Shaklee and R.F.Leheny, Appl. Phys. Lett. 18, 475 (1971).[83] M.D. McGehee, R. Gupta, S. Veenstra, E.K. Miller, M.A. Diaz-Garcia, and A. HeegerPhys. Rev. B 11, 7035 (1998).[84] M.D. McGehee and A. Heeger Adv. Mater. 12, 1655 (2000).[85] F. Quochi, F. Cordella, A. Mura, , G. Bongiovanni, F. Balzer, and H.G. Rubahn, Appl.Phys. Lett. In pr<strong>in</strong>t.[86] L. Wu, W. Tian, and F. Gao, Semicond. Sci. Technol. 19, 1149 (2004).[87] D. Schneider, T. Rabe, T. Riedl, T Dobbert<strong>in</strong>, M. Kröger, E. Becker, H.-H. Johannes, andW. Kowalsky, J. Appl. Phys. 98, 043104 (2005).[88] S.V. Frolov, M. Ozaki, W. Gellermann, K. Yosh<strong>in</strong>o, and Z.V. Vardeny, Phys. Rev. Lett.78, 729 (1997).[89] D. Pisignano, M. Anni, G. Gigli, R. C<strong>in</strong>golani, M. Zavelani-Rossi, G. Lanzani, G.Barbarella, and L. Favaretto, Appl. Phys. Lett. 81, 3534 (2002).[90] H. Yanagi, T. Morikawa, S. Hotta, Appl. Phys. Lett. 81, 1512 (2002).[91] F. Quochi, A. Andreev, F. Cordella, R. Orrù, A. Mura, G. Bongiovanni, H. Hoppe, H.Sitter, and N.S. Sariciftci, J. Lum<strong>in</strong>escence 112, 321 (2005).[92] M.A. Baldo, D.F. O’Brien, M.E. Thompson, and S.R. Forrest, Phys Rev B 60, 14442(1999).[93] D.S. Wiersma, Nature 406, 132 (2000).[94] D.S. Wiersma, and S. Cavalieri, Nature 414, 708 (2001).[95] R. Aimee, Z. Zhu, C. F. Madigan, T.M. Swager, V. Bulovic, Nature 434, 876 (2005).[96] S.V. Frolov, private communication.[97] F. Me<strong>in</strong>ardi, M. Cerm<strong>in</strong>ara, A. Sassella, A. Borghesi, P. Spearman, G. Bongiovanni, A.Mura, and R. Tub<strong>in</strong>o, Phys. Rev. Lett. 8, 9157403 (2002).[98] S.-H. Lim, T. Bjorklund, F.C. Spano, and C.J. Bardeen Phys. Rev. Lett. 92, 107402 (2004).[99] V. Savona <strong>in</strong> L<strong>in</strong>ear Optical Properties of Semiconductor Microcavities with EmbeddedQuantum Wells, Lecture Notes <strong>in</strong> Physics, Spr<strong>in</strong>ger Verlag 1999.91
<strong>Light</strong> <strong>amplification</strong> <strong>in</strong> <strong>organic</strong> <strong>self</strong>-<strong>assembled</strong> <strong>nanoaggregates</strong>92
PublicationsPublications1. F. Quochi, F. Cordella, A. Mura, G. Bongiovanni, F. Balzer, and H.G. Rubahn. Ga<strong>in</strong><strong>amplification</strong> and las<strong>in</strong>g properties of <strong>in</strong>dividual <strong>organic</strong> nanofibers. Appl. Phys. Lett.(2005), <strong>in</strong> pr<strong>in</strong>t.2. A. Andreev, F. Quochi, F. Cordella, A. Mura G. Hlawacek, G. Bongiovanni, H. Sitter; C.Teichert, and N.S. Sariciftci. Para- sexiphenyl <strong>self</strong>-<strong>assembled</strong> nanofibers for laser <strong>in</strong> thedeep blue. J. Appl. Phys. (2005), <strong>in</strong> pr<strong>in</strong>t.3. F. Quochi, F. Cordella, A. Mura, G. Bongiovanni, F. Balzer, and H.G. Rubahn. Onedimenstional random las<strong>in</strong>g <strong>in</strong> a sigle <strong>organic</strong> nanofiber. J. Phys. Chem. B 109, 21690(2005).4. F. Quochi, A. Andreev, F. Cordella, R. Orrù, A. Mura, G. Bongiovanni, H. Hoppe, H.Sitter, and N.S. Sariciftci. Low threshold blue las<strong>in</strong>g <strong>in</strong> epitaxially grown para-sexiphenylnanofibers. Journ. of Lum<strong>in</strong>. 112, 321 (2005).5. Artizzu F. Deplano P. Marchio L. Mercuri ML. Pilia L. Serpe A. Quochi F. Orru R.Cordella F. Me<strong>in</strong>ardi F. Tub<strong>in</strong>o R. Mura A. Bongiovanni G. Structure and emissionproperties of Er(3)Q(9) (Q=8-qu<strong>in</strong>ol<strong>in</strong>olate). Inorg. Chem. 44, 840 (2005).6. Botta C. Patr<strong>in</strong>oiu G. Picouet P. Yunus S. Communal JE. Cordella F. Quochi F. Mura A.Bongiovanni G. Pas<strong>in</strong>i M. Destri S. Di Silvestro G. Organic nanostructured host-guestmaterials conta<strong>in</strong><strong>in</strong>g three dyes. Adv. Mat. 16, 1716 (2004).7. F. Quochi, F. Cordella, R. Orrù, J.E. Communal, P. Verzeroli, A. Mura, G. Bongiovanni, A.Andreev, H. Sitter, and N.S. Sariciftci. Random laser action <strong>in</strong> <strong>self</strong>-organized parasexiphenylnanofibers grown by hot –wall epitaxy. Appl. Phys. Lett. 84, 4454 (2004).8. G. Bongiovanni, C. Botta, J.E. Communal, F. Cordella, L. Magistrelli, A. Mura, G.Patr<strong>in</strong>oiu. P. Picouet, G. Di Silvestro Organic host-guest systems for blue emission. Mat.Sc. & Ing. C 23, 909 (2004).9. F. Cordella, R. Orrù, M.A. Loi, A. Mura, G. Bongiovanni. Transient hot-phonon-to-excitonspectrscopy <strong>in</strong> <strong>organic</strong> molecular semiconductors. Phys. Rev. B 68, 113203 (2003).10. G. Bongiovanni, F. Cordella, R. Orrù, A. Mura. Photoexcitation energy loss <strong>in</strong> molecularsemiconductors. Synt. Met. 139, 723 (2003).93
Ligth <strong>amplification</strong> <strong>in</strong> <strong>organic</strong> <strong>self</strong>-<strong>assembled</strong> <strong>nanoaggregates</strong>Conference proceed<strong>in</strong>g1. S.B. Petersen, M.T. Neves-Petersen, F. Quochi, F. Cordella, K. Thils<strong>in</strong>g-Hansen, A. Mura,G. Bongiovanni, and H.G. Rubahn. Fast and ultrafast response of aligned <strong>organic</strong>nanofibers – towards <strong>organic</strong> nanolaser. Proced<strong>in</strong>g SPIE 2006.94