Reading Outline Guide Example
Reading Outline Guide Example
Reading Outline Guide Example

You also want an ePaper? Increase the reach of your titles
YUMPU automatically turns print PDFs into web optimized ePapers that Google loves.
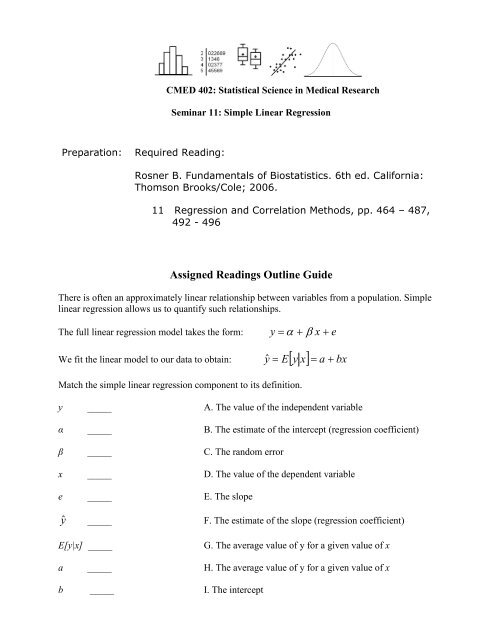
CMED 402: Statistical Science in Medical ResearchSeminar 11: Simple Linear RegressionPreparation:Required <strong>Reading</strong>:Rosner B. Fundamentals of Biostatistics. 6th ed. California:Thomson Brooks/Cole; 2006.11 Regression and Correlation Methods, pp. 464 – 487,492 - 496Assigned <strong>Reading</strong>s <strong>Outline</strong> <strong>Guide</strong>There is often an approximately linear relationship between variables from a population. Simplelinear regression allows us to quantify such relationships.The full linear regression model takes the form:y = α + β x + eWe fit the linear model to our data to obtain: y = E[ y x] = a + bxMatch the simple linear regression component to its definition.y _____ A. The value of the independent variableα _____ B. The estimate of the intercept (regression coefficient)β _____ C. The random errorx _____ D. The value of the dependent variablee _____ E. The slopeŷ _____ F. The estimate of the slope (regression coefficient)ˆE[y|x] _____G. The average value of y for a given value of xa _____ H. The average value of y for a given value of xb _____ I. The intercept
The interpretation of the regression line for different value of βFor any sample point (x i , y i ), the ___________ component of that point about the regression line isdefined by yi− yˆi .This is the difference between the actual value and the predicted value. The___________ component of that point about the regression line is defined by yˆi − y . The bestfitting regression line has large regression components and small residual components. The worstfitting regression line has small regression components and large residual components. Oneapproach to quantifying how good a regression line fits the data is to square the deviations aboutthe mean, y i − y , sum them up over all points, and decompose this sum of squares into regressionand residual components.Decomposition of the Total Sum or Squares into Regression and Residual Components:n∑( y i − y)i=1n∑( yˆi − y)i=1n∑( y i − yˆi )i=12 is the _________ sum of squares (Total SS)2is the _________ sum of squares (Reg SS)2is the _________ sum of squares (Res SS)R 2 can be thought of as the proportion of the variance of y that can be explained by x.If R 2 = ____, then all variation in y can be explained by variation in x, and all data points fall onthe regression line. If R 2 = ____, then x gives no information about y, and the variance of y is thesame with or without knowing x.
The simple linear regression model is a great tool, but its answers will only be useful if it is theright model for the data. We need to check the assumptions before using the model. The fourassumptions are:(1)(2)(3)(4)The main question of interest in simple linear regression is whether or not a linear relationshipexists between x and y. This can be tested by the slope parameter.H 0 : β = 0 (No linear association between x and y)H 1 :Compute the test statistic:bt = whereSE( b)Compare to critical value:t n− 2,1− α2If H 0 : β = 0 is not rejected, what is the best “guess” for the value of the response variable for anyvalue of the predictor variable?Confidence Intervals for the Slope of the Regression Line:Lower Bound:Upper Bound:One important use for regression lines is in making predictions. For a given value of x, an estimatefrom the regression line is denoted y ˆ = ax + b . Frequently, the accuracy of these predictions mustbe assessed. How accurate a prediction is depends on whether we are making predictions for onespecific subject or for the mean value of all subjects of a given x. Intervals for an individualfrom the population are called _______________ intervals. Intervals for the mean of thepopulation are called confidence intervals.Both are of the form: yˆ± t ⋅ SE( yˆ)n−2,1−α2
ut when predictions are made from regression lines for individual observations,and when predictions are made from regression lines for the mean value of y for a given x,Are prediction or confidence intervals wider? Explain.Simple Linear Regression focuses on predicting one dependent variable (y) from an independentvariable (x). Often we are interested not in predicting one variable from another but rather ininvestigating whether or not there is a relationship between two variables. The _______________________________ is a useful tool for quantifying the linear relationship between two variablesand is better suited for this purpose than the regression coefficient.Label each scatter diagram as a linear, nonlinear or no relation between predictor and response.
Properties of the Linear Correlation Coefficient• Always between ___ and ___, inclusive• If r = ___, there is a perfect positive linear relation between the two variables• If r = ___, there is a perfect negative linear relation between the two variables• If r > 0, then the variables are said to be positively correlated – as x increases, y tends to___________, whereas as x decreases, y tends to ___________• If r < 0, then the variables are said to be negatively correlated – as x increases, y tends to___________, whereas as x decreases, y tends to ___________• If r is close to ___, this implies no linear relation between the two variables.True False For the least-squares regression model, we require that the independentvariable, x, be normally distributed.True False R 2 is defined as Res SS / Total SSTrue False The point ( x, y)falls on the regression line.True False A regression coefficient is another name for a correlation coefficient.True False A correlation coefficient of 0 means no relationTrue False The sample correlation coefficient is only meaningful if the two variablesare normally distributed