MATH 110 Chapter 2 Review 02-11 - The Learning Lab at HFCC
MATH 110 Chapter 2 Review 02-11 - The Learning Lab at HFCC
MATH 110 Chapter 2 Review 02-11 - The Learning Lab at HFCC
Create successful ePaper yourself
Turn your PDF publications into a flip-book with our unique Google optimized e-Paper software.
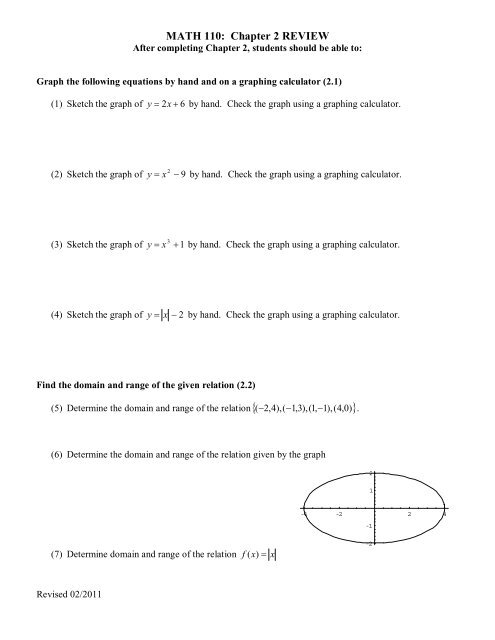
<strong>MATH</strong> <strong><strong>11</strong>0</strong>: <strong>Chapter</strong> 2 REVIEWAfter completing <strong>Chapter</strong> 2, students should be able to:Graph the following equ<strong>at</strong>ions by hand and on a graphing calcul<strong>at</strong>or (2.1)(1) Sketch the graph of y = 2 x + 6 by hand. Check the graph using a graphing calcul<strong>at</strong>or.(2) Sketch the graph of y = x 2 − 9 by hand. Check the graph using a graphing calcul<strong>at</strong>or.(3) Sketch the graph of y = x 3 + 1 by hand. Check the graph using a graphing calcul<strong>at</strong>or.(4) Sketch the graph of y = x − 2 by hand. Check the graph using a graphing calcul<strong>at</strong>or.Find the domain and range of the given rel<strong>at</strong>ion (2.2)(5) Determine the domain and range of the rel<strong>at</strong>ion{ ( − 2,4),( −1,3),(1,−1),(4,0)}.(6) Determine the domain and range of the rel<strong>at</strong>ion given by the graph21-4 -2 2 4-1(7) Determine domain and range of the rel<strong>at</strong>ion f ( x)= x-2Revised <strong>02</strong>/20<strong>11</strong>
Solve problems using graphs (2.3)(14) <strong>The</strong> cost of renting a piece of machinery is given by the linear function C ( x)= 4x+ 10 , whereC (x) is in dollars and x is given in hours.a. Find the cost of renting the piece of machinery for 8 hours.b. Graph C ( x)= 4x+ 10c. How can you tell from the graph of C(x)th<strong>at</strong> as the number of hours increases, the total costincreases also?Finding the slope of a line (2.4)(15) Find the slope of the line th<strong>at</strong> goes through the points ( − 2,7),( −2,−14).(16) Find the slope of the line th<strong>at</strong> goes through the points ( − 2,7),( −5,7).(17) Find the slope of the line th<strong>at</strong> goes through the points ( − 2,7),( −5,−14).(18) Find the slope of the line − 3 x − 4y= 6 .Interpret the slope-intercept form in an applic<strong>at</strong>ion (2.4)(19) One of the fastest growing occup<strong>at</strong>ions in the next few years is expected to be nursing. <strong>The</strong>number of people y in thousands employed in nursing in the United St<strong>at</strong>es can be estim<strong>at</strong>ed bythe linear equ<strong>at</strong>ion − 266 x + 10y= 27, 409 where x is the number of years after 2000a. Find the slope and the y-intercept of the linear equ<strong>at</strong>ion.b. Wh<strong>at</strong> does the slope mean in this context?c. Wh<strong>at</strong> does the y-intercept mean in this context?Revised <strong>02</strong>/20<strong>11</strong>
Graph a line using its slope and y-intercept (2.5)(29) Draw the graph of the line th<strong>at</strong> has the slope1− and y-intercept ( 0,3).2(30) Draw the graph of the line th<strong>at</strong> has the slope 2 and y-intercept ( 0, − 1).Find the equ<strong>at</strong>ion of parallel and perpendicular line (2.5)(31) Find the equ<strong>at</strong>ion of the line through ( 1,5)and parallel to the line y = 3x− 4 . Express youranswer in slope-intercept form.(32) Find the equ<strong>at</strong>ion of the line through ( 1,5)and perpendicular to the line y = 3x− 4 . Express youranswer in function not<strong>at</strong>ion.Draw sc<strong>at</strong>tered plots and find the linear regression of the equ<strong>at</strong>ion using graphing calcul<strong>at</strong>or (2.6)(33) <strong>The</strong> average total expenditures for all phone services increased for the years 2001-2006. <strong>The</strong>table below shows the annual average expenditures per consumer unit. Let x be number of yearssince 2000.Year 2001 20<strong>02</strong> 2003 2004 2005 2006Average $ Spentper Phone Service $914 $957 $956 $990 $1048 $1087a. Use linear regression to fit a line to the d<strong>at</strong>a. If necessary round your coefficients to threedecimal places.b. Find the r<strong>at</strong>e <strong>at</strong> which the amount of expenditures is increasing each year.c. If the trend continues to increase <strong>at</strong> this r<strong>at</strong>e, find the expected amount of expenditures forresidential phones in the year 2016.d. Wh<strong>at</strong> does the y-intercept indic<strong>at</strong>e in this context?Revised <strong>02</strong>/20<strong>11</strong>
Answers(1)765432y1x−4 −3 −2 −1 1 2 3 4 5−1(2)321yx−4 −3 −2 −1 −1 1 2 3 4 5−2−3−4−5−6−7−8−9−10(3)8642-2-1 1 2-2-4-6Revised <strong>02</strong>/20<strong>11</strong>
(4)21.510.5-4 -2 -0.5 2 4-1-1.5-2(5) Domain: {-2, -1, 1, 4} Range: {4, 3, -1, 0}(6) Domain: { x − 4 ≤ x ≤ 4}Range: { y − 2 ≤ y ≤ 2}(7) Domain: All real numbers Range: { y y ≥ 0}(8) No, it is not a function. <strong>The</strong> graph of the rel<strong>at</strong>ion does not pass the vertical line test. Further for x= 4y can either be –4 or 4.(9) Yes, it is a function. <strong>The</strong> graph passes the vertical line test.(10) f ( x)= −2x+ 46y54(0, 4)321(2, 0)x−4 −3 −2 −1 1 2 3 4 5−1(<strong>11</strong>)6x−123x− 6f ( x)= =4 221-2 -1 1 2 3-1-2-3-4Revised <strong>02</strong>/20<strong>11</strong>
(29)654321-2 2 4 6 8-1(30)2y1x−2 −1 1 2−1−2(31) y = 3 x + 2(32) f ( x )1 16 = − x +3 3(33)a. y = 33 .486x+ 874. 8b. $ 33. 49c. $ 1410. 57d. $ 874. 80 (average amount spent in the year 2000)Revised <strong>02</strong>/20<strong>11</strong>


