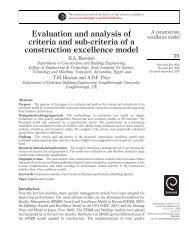
368 A.L.F. Lima E Silva et al. / Journal <strong>of</strong> Computational Physics 189 (2003) 351–370Fig. 22. Schematic illustration <strong>of</strong> the angle h.Fig. 23. Pressure coefficient distribution, between the stagnation points ðh ¼ 0Þ and ðh ¼ 180Þ: (a) Re ¼ 10, 20, 40 (present study);.: Re ¼ 10, 20, 40 [14]; (b) Re ¼ 50, 80, 100, 150 (present study);O: Re ¼ 80, 100 [14].Table 2Comparison <strong>of</strong> mean drag coefficient (C D ) with those <strong>of</strong> other authorsRe Present work Park et al.[14]Sucker and Brauer[17]Dennis and Chang[2]Ye et al.[26]10 2.81 2.78 2.6720 2.04 2.01 2.08 2.05 2.03 2.2240 1.54 1.51 1.73 1.52 1.52 1.4847 1.46 – – – – –50 1.46 – 1.65 – – –80 1.40 1.35 1.51 – 1.37 1.29100 1.39 1.33 1.45 – – –150 1.37 – 1.36 – – –300 1.27 1.37 1.22 – 1.38 –Tritton[20]
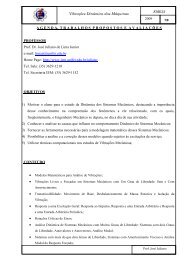
A.L.F. Lima E Silva et al. / Journal <strong>of</strong> Computational Physics 189 (2003) 351–370 369Fig. 24. Strouhal number vs. Reynolds number.Fig. 24 shows the Strouhal number, defined by Eq. (30), as compared with the Strouhal number obtainedby other authors [16,25,26]. It should be noted that for low Reynolds numbers the results are in goodagreement [9,14,24]. As the Reynolds number increases the error factor <strong>of</strong> the numerical <strong>simulation</strong> increases.The present work presents consistent results even for Re ¼ 300.5. ConclusionsThe Physical Virtual Model (PVM), proposed in the present work, permits the <strong>simulation</strong> <strong>of</strong> unsteady,viscous incompressible <strong>flows</strong> <strong>over</strong> an immersed <strong>circular</strong> cylinder using a Cartesian grid. Statistical parameters,including drag and lift coefficients, the Strouhal number, wall pressure and the length <strong>of</strong> thebubble recirculation, were reported for several values <strong>of</strong> the Reynolds number. The results show consistencyagreement with previous numerical and experimental results. The proposed model seems to be apromising tool and can be also applied to other geometries, to mobile geometries and to higher Reynoldsnumbers. The CPU time used to compute 10 s <strong>of</strong> <strong>simulation</strong>, for Re ¼ 80, was approximately 36 h in aPentium IV, 2 GHz. This time was sufficient to obtain the statistic parameters and it is compatible withother methods such as Finite-Volume and the Lattice–Boltzman Methods.AcknowledgementsThe authors acknowledge Fundacß~ao CAPES for the financial support. The computations were performedon a Pentium IV 2.0 GHz, at the Mechanical Engineering College <strong>of</strong> the Federal University <strong>of</strong>Uberl^andia.References[1] S. Armfield, R. Street, The fractional-step method for the Navier–Stokes equations on staggered grids: the accuracy <strong>of</strong> threevariations, J. Comp. Phys. 153 (1999) 660.[2] S.C.R. Dennis, G. Chang, <strong>Numerical</strong> solutions for steady flow past a <strong>circular</strong> cylinder at Reynolds numbers up to 100, J. FluidMech. 42 (1970) 471.[3] E.A. Fadlun, R. Verzicco, P. Orlandi, J. Mohd-Yous<strong>of</strong>, Combined immersed-boundary finite-difference methods for three<strong>dimensional</strong>complex <strong>flows</strong> <strong>simulation</strong>s, J. Comp. Phys. 161 (2000) 35.